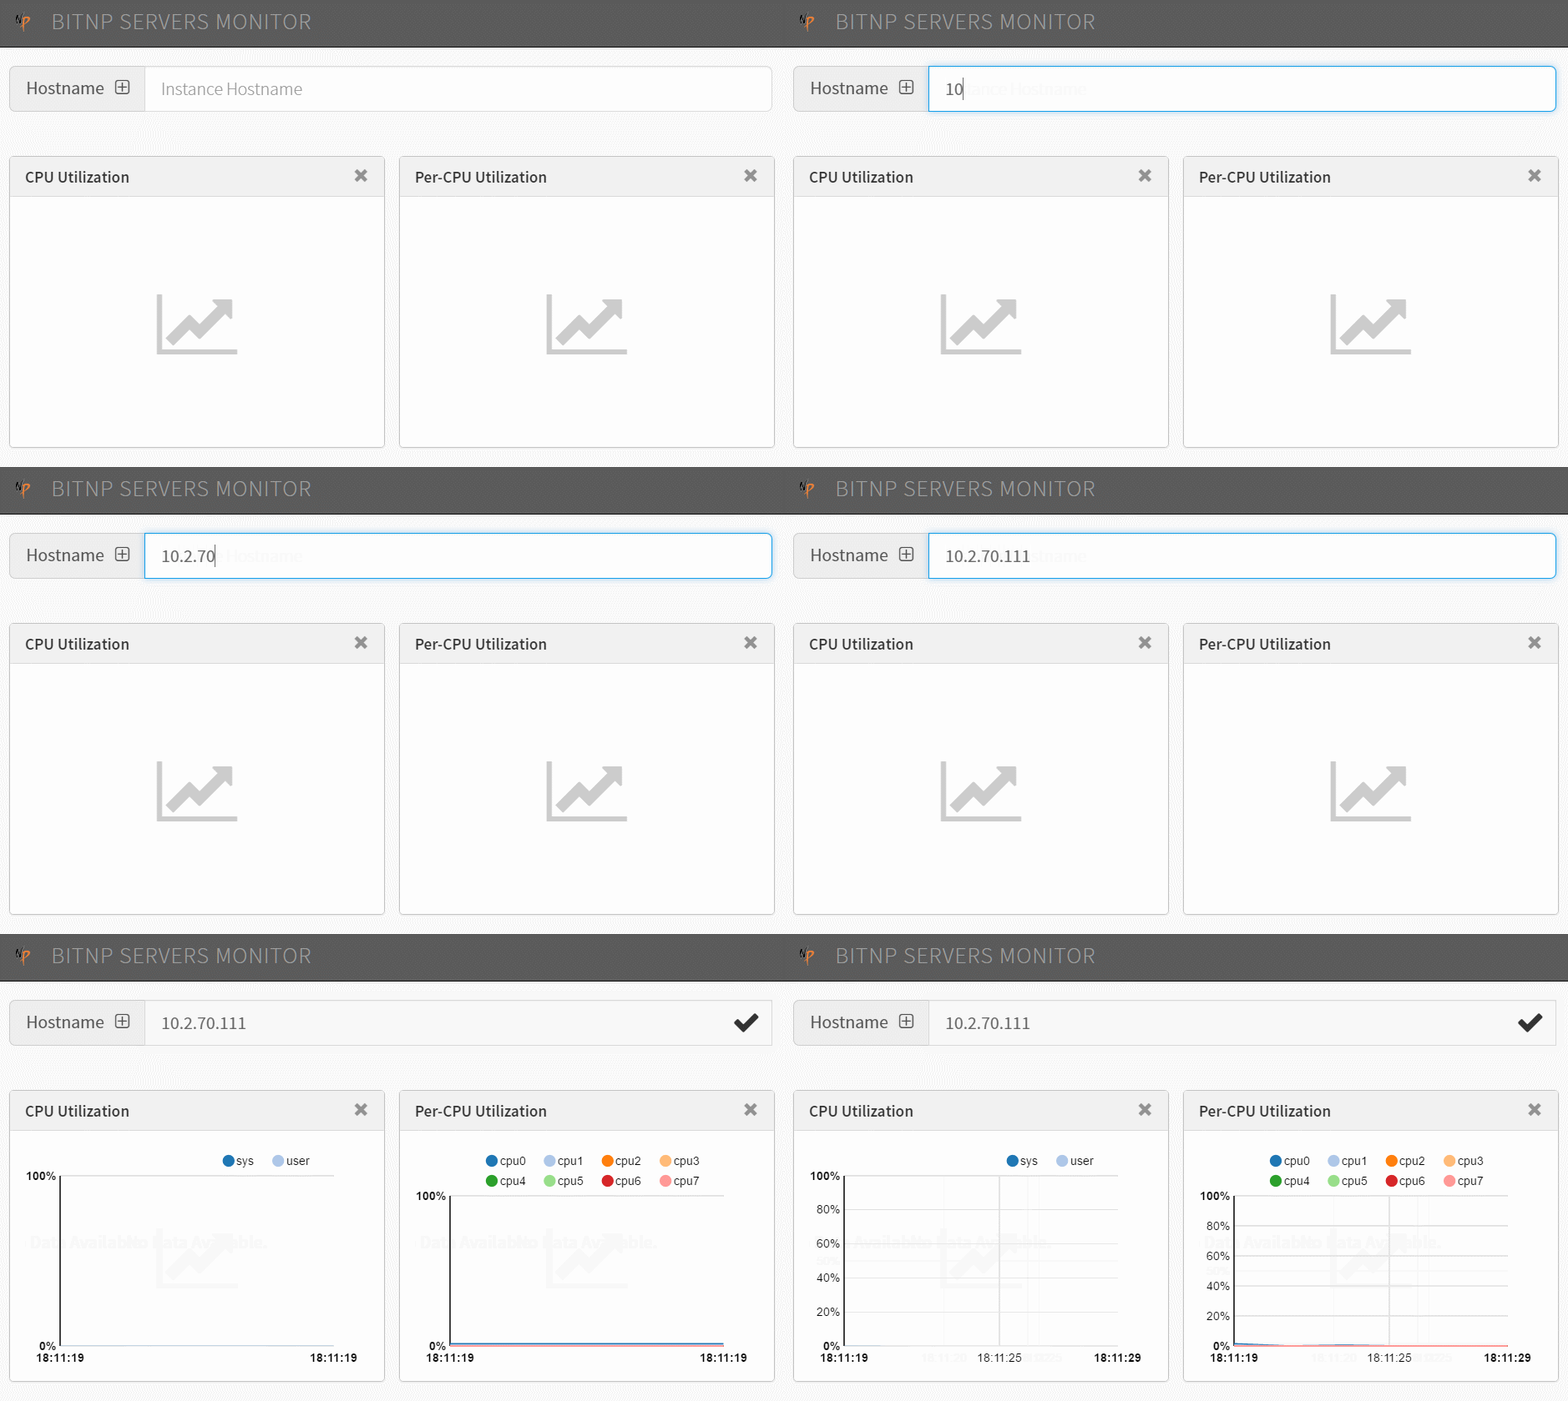
- This web shows Server's performance information by dynamic graphs using the data collected from 'Performance Co-Pilot' Client server.
- To install basic PCP tools and services and enable collecting performance data on Fedora/RHEL, run:
# yum install pcp
# chkconfig pmcd on
# service pmcd start
# chkconfig pmlogger on
# service pmlogger start
- To install basic PCP tools and services and enable collecting performance data on Debian/Ubuntu, run:
$ sudo apt-get install pcp
$ sudo update-rc.d pmcd defaults
$ sudo update-rc.d pmlogger defaults
$ sudo service pmcd restart
$ sudo service pmlogger restart
-
This will enable the Performance Metrics Collector Daemon ( pmcd(1) ) on the host which then in turn will control and request metrics on behalf of clients from various Performance Metrics Domain Agents (PMDAs). The PMDAs provide the actual data from different components (domains) in the system, for example from the Linux Kernel PMDA or the NFS Client PMDA. The default configuration includes over 1000 metrics with negligible overall overhead. Local PCP archive logs will also be enabled on the host for convenience with pmlogger(1) .
-
To enable PMDAs which are not enabled by default, for example the Postfix PMDA, run the corresponding Install script:
# cd /var/lib/pcp/pmdas/postfix
# ./Install
- The client tools will contact local or remote PMCDs as needed, communication with PMCD over the network uses TCP port 44321 by default.
-
Performance Metrics Web Daemon ( pmwebd(1) ) is a front-end to both PMCD and PCP archives, providing a REST web service (over HTTP/JSON) suitable for use by web-based tools wishing to access performance data over HTTP. Custom applications can access all the available PCP information using this method, including custom metrics generated by custom PMDAs.
-
To install the PCP web service on Fedora/RHEL:
# yum install pcp-webapi
# chkconfig pmwebd on
# service pmwebd start
- To install the PCP web service on Debian/Ubuntu:
$ sudo apt-get install pcp-webapi
$ sudo update-rc.d pmwebd defaults
$ sudo service pmwebd restart
- Just copy these web files to a folder that you can access by your browser.
- Input cilent server's
IP(:Port)toHostname. Default port is44323.
- http://monitor.bitnp.net
- (Accessible only in BIT campus network)
