This tutorial is from the Hortonworks Sandbox - a single-node Hadoop cluster running in a virtual machine. Download to run this and other tutorials in the series.
This tutorial describes how to use Excel 2013 to access data in the Hortonworks sandbox on Windows 7.
In this procedure, we will use a Microsoft Query in Microsoft Excel 2013 to access sandbox data. This procedure should also apply to other versions of Excel. The process may not be identical in other versions of Excel, but it should be similar.
- Windows 7
- Hortonworks ODBC driver (64-bit) installed and configured
- Hortonworks Sandbox 1.2 or later (installed and running)
- Microsoft Excel 2013 Professional Plus 64-bit
To access Hortonworks sandbox data with Excel 2013:
- Use the Microsoft Query feature to access the sandbox repository.
- Specify sandbox data to import into Excel.
- Import the data as a spreadsheet or pivot chart.
-
In Windows, open a new Excel workbook, then select Data > From Other Sources > From Microsoft Query.

-
On the Choose Data Source pop-up, select the Hortonworks ODBC data source you installed previously, then click OK.

-
After the connection to the sandbox is established, the Query Wizard appears. Select the omniture table in the Available tables and columns box, then click the right arrow button to add the entire omniture table to the query. Click Next to continue.
Note: You can select multiple tables and columns to add to a query. Use the + symbols to expand tables. Use the right arrow button to add tables and columns to a query. Use the left arrow buttons to remove tables and columns. The double left arrow button removes all tables and columns from a query.
-
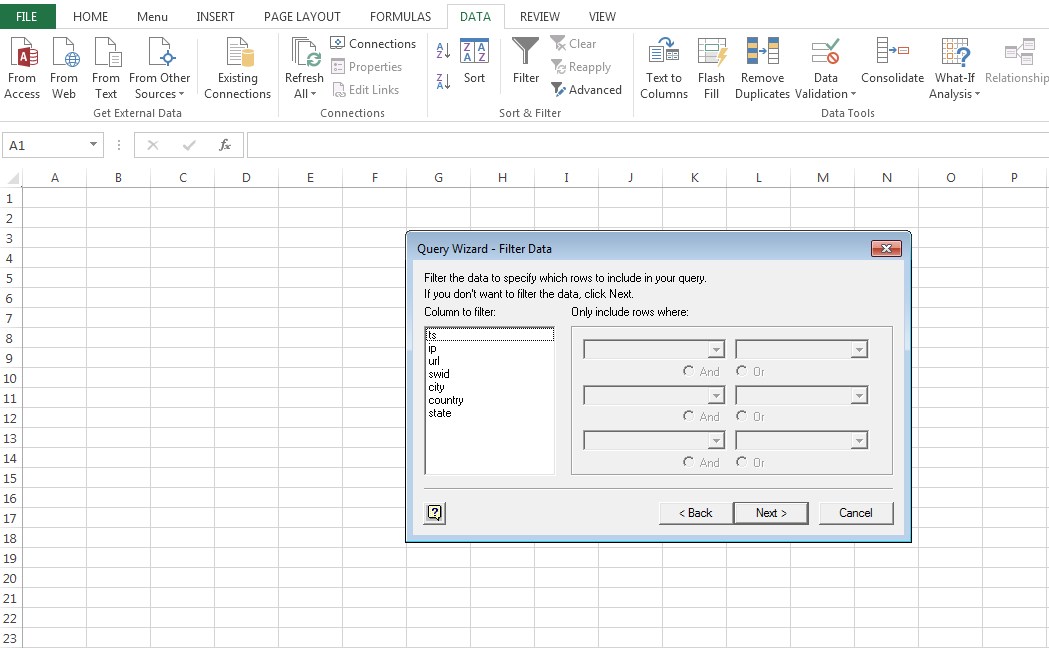
On the Filter Data screen, click Next to continue without filtering the data.
Note: You can use Filter Data to include column rows based on filtering criteria. Select a column to filter, then use the drop-down boxes and radio buttons to specify which rows to include.

-
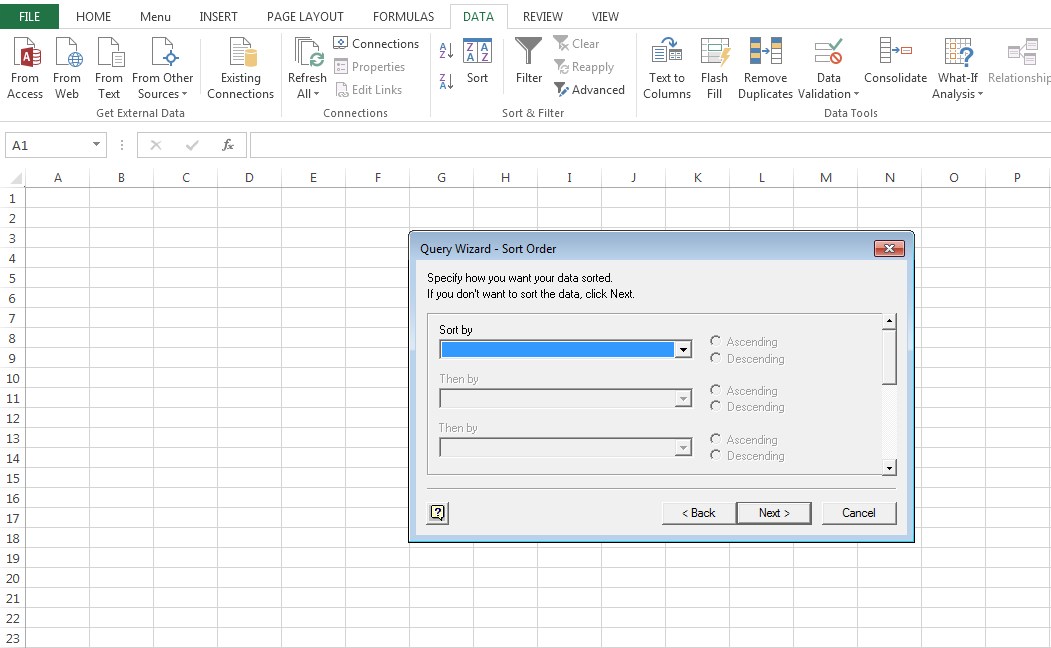
On the Sort Order screen, click Next to continue without setting a sort order.
Note: You can use Sort Order to sort the query based on column data in ascending or descending order.

-
Click Finish on the Query Wizard Finish screen to retrieve the query data from the sandbox and import it into Excel.

-
On the Import Data dialog box, click OK to accept the default settings and import the data as a table.
Note: You can use the Import Data dialog box to import the query data as a pivot chart, or to specify an insertion point.

-
The imported query data appears in the Excel workbook.


Now that you have successfully imported sandbox data into Microsoft Excel, you can use the features in Excel to analyze the data.