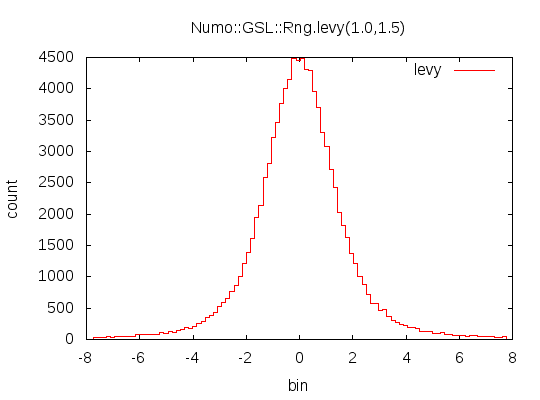
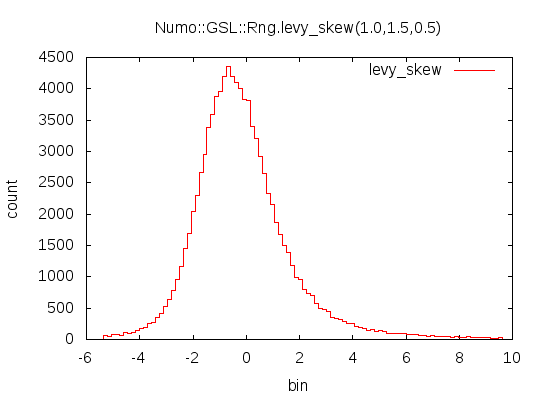
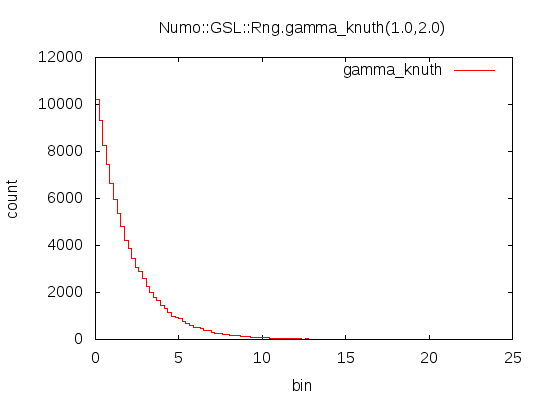
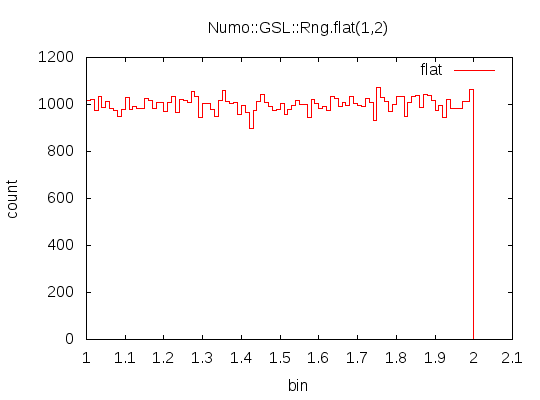
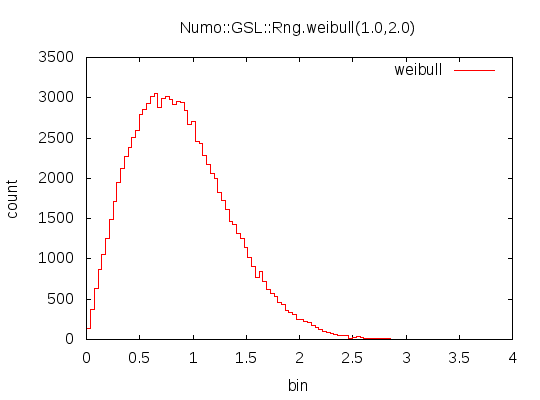
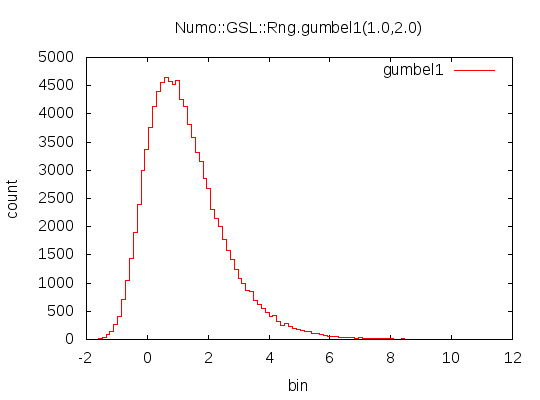
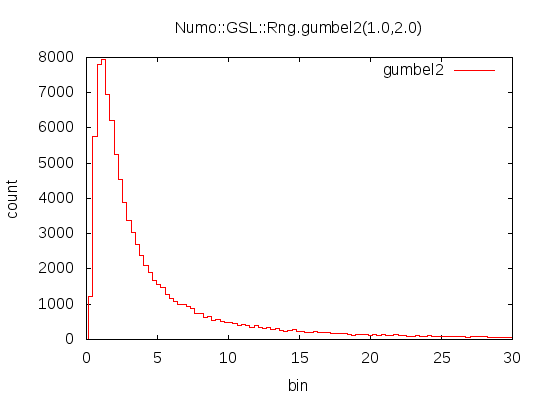
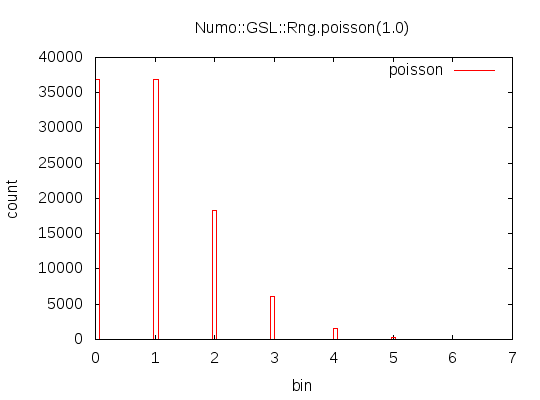
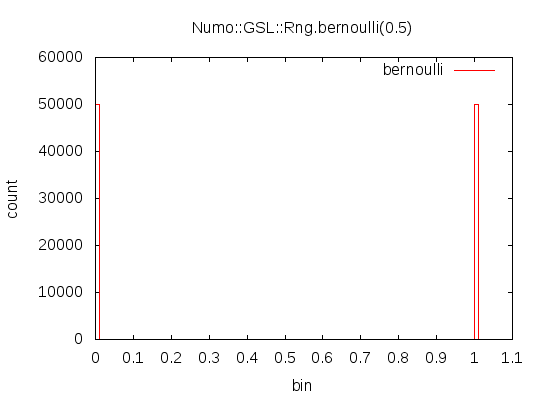
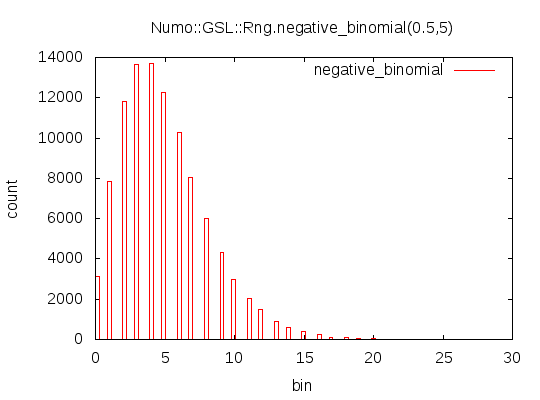
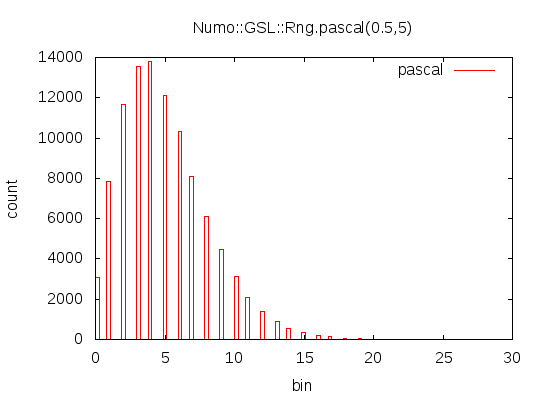
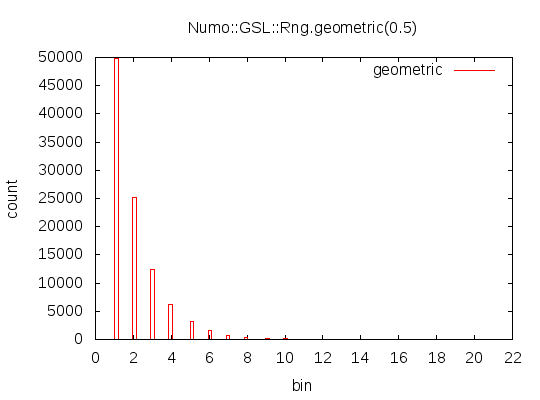
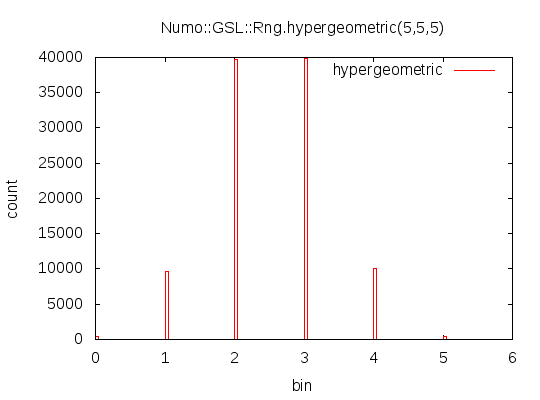
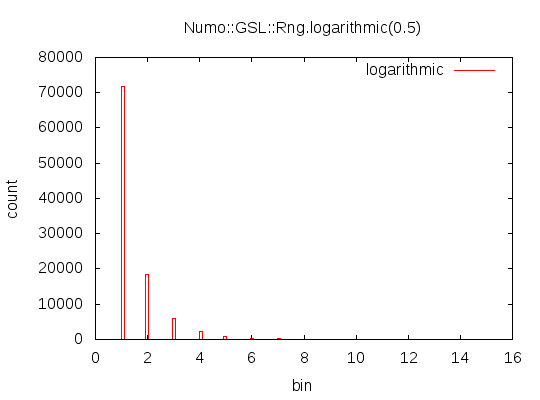
require "numo/narray"
require "numo/gsl"
require "numo/gnuplot"

def hist(dat,name=nil)
  f = case name
      when "cauchy"
        0.025
      when /levy/
        0.01
      end
  if f
    e = (dat.size*f).to_i
    dat = dat[dat.sort_index[e..-1-e]]
  end
  n = 100
  m = 30
  min,max = dat.minmax
  min = -m if min<-m
  max = m if max>m
  scale = (max-min)/n
  y = (dat-min)/scale
  y = y[y.ge(0) & y.le(n)]
  y = Numo::Int32.cast(y)
  x = (Numo::DFloat.new(n+1).seq+0.5) * scale + min
  [x, y.bincount]
end

def gplot(plot_args,setting,fn)
  Numo.gnuplot do
    set xlabel:"bin"
    set ylabel:"count"
    setting.each{|k,v| set k,v}
    plot(*plot_args)
    pause mouse:"any"
    output "img/"+fn+".png",size:[540,400]
    #output fn+".ps","color"
    reset
  end
end

rng = Numo::GSL::Rng.new
N = 100000

sigma = 1.0
a = 1.0
b = 2.0
c = 1.0
alpha = 1.5
beta = 0.5
mu = 1.0
zeta = 1.0
nu = 5.0
nu1 = 5.0
nu2 = 3.0
p = 0.5
n = 5
n1 = 5
n2 = 5
t = 5

[["gaussian",[sigma]],
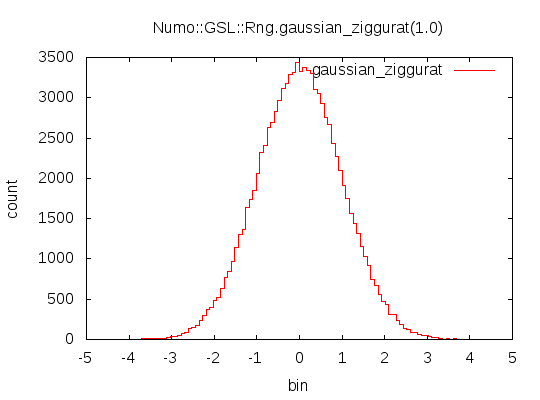
 ["gaussian_ziggurat",[sigma]],
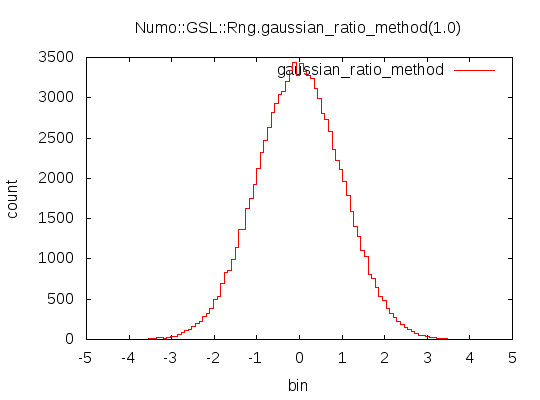
 ["gaussian_ratio_method",[sigma]],
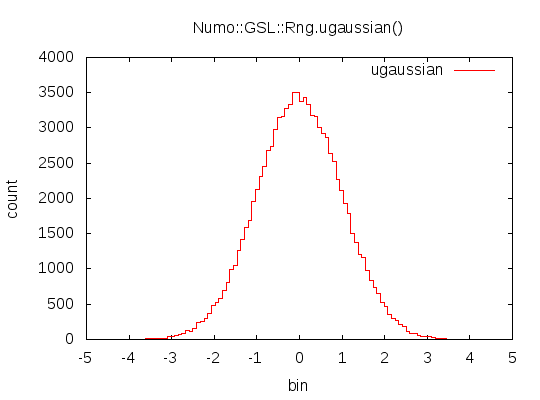
 ["ugaussian",[]],
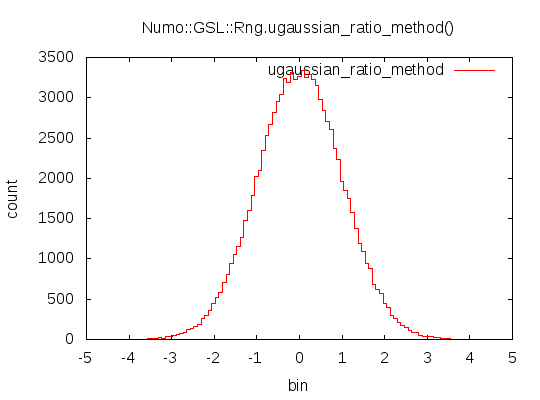
 ["ugaussian_ratio_method",[]],
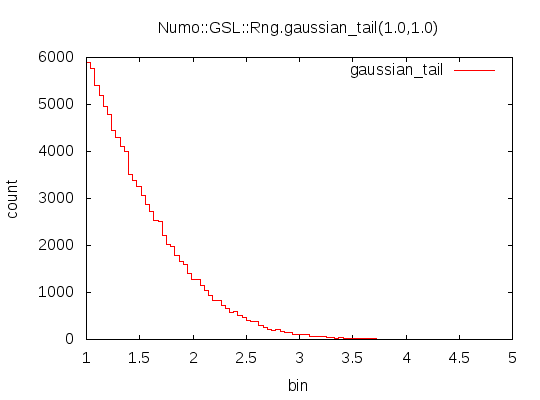
 ["gaussian_tail",[a,sigma]],
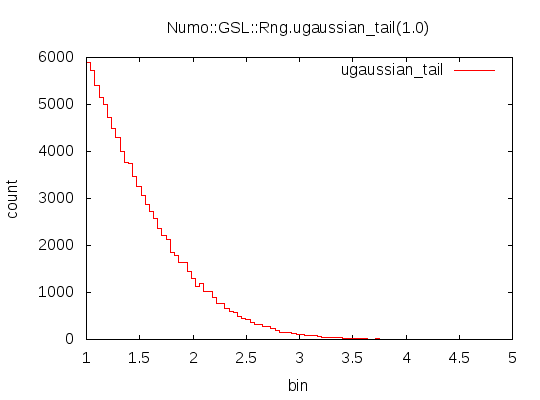
 ["ugaussian_tail",[a]],
 ["exponential",[mu]],
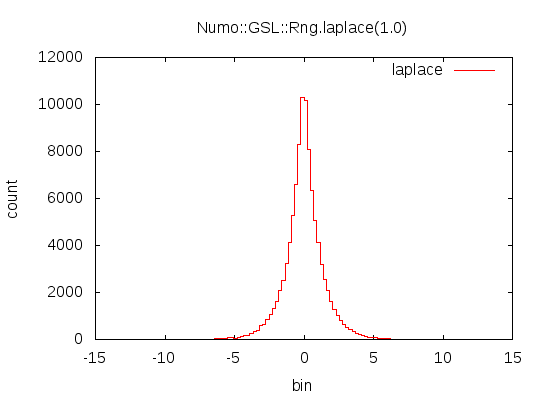
 ["laplace",[a]],
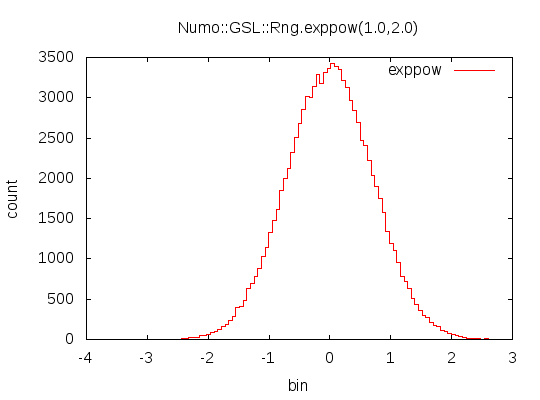
 ["exppow",[a,b]],
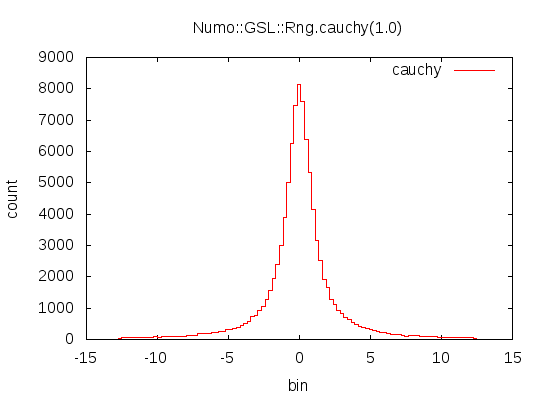
 ["cauchy",[a]],
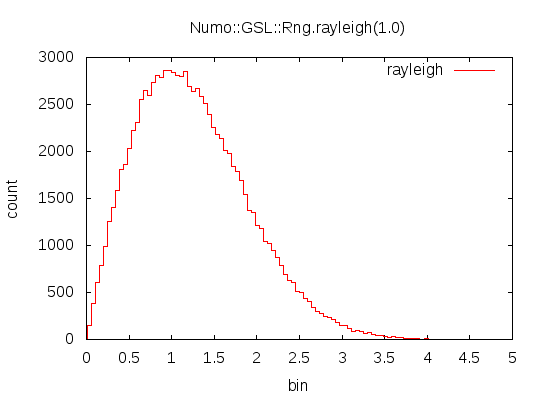
 ["rayleigh",[sigma]],
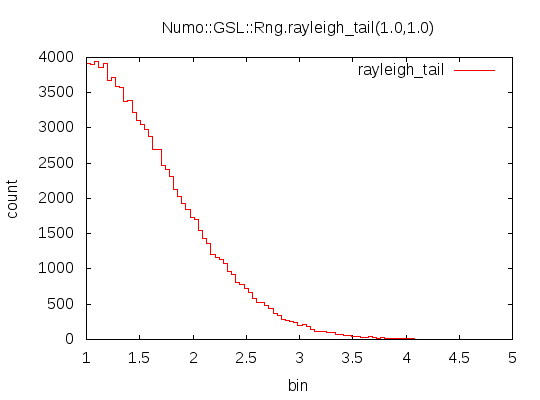
 ["rayleigh_tail",[a,sigma]],
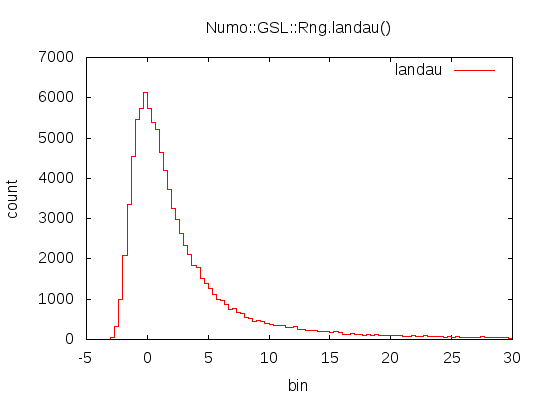
 ["landau",[]],
 ["levy",[c,alpha]],
 ["levy_skew",[c,alpha,beta]],
 ["gamma",[a,b]],
 ["gamma_knuth",[a,b]],
 ["flat",[1,2]],
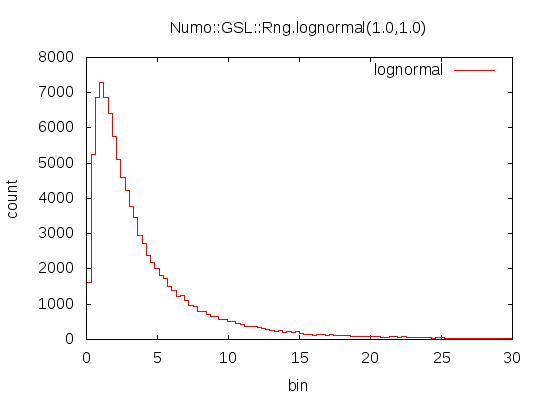
 ["lognormal",[zeta,sigma]],
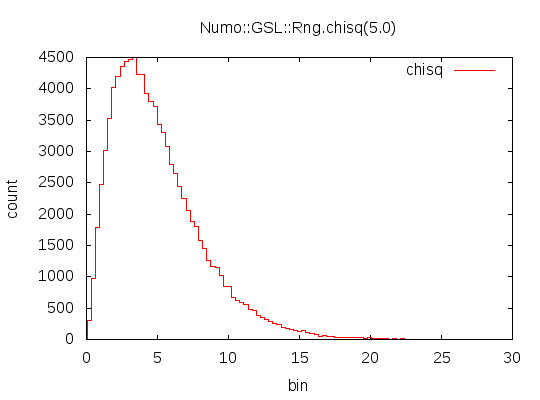
 ["chisq",[nu]],
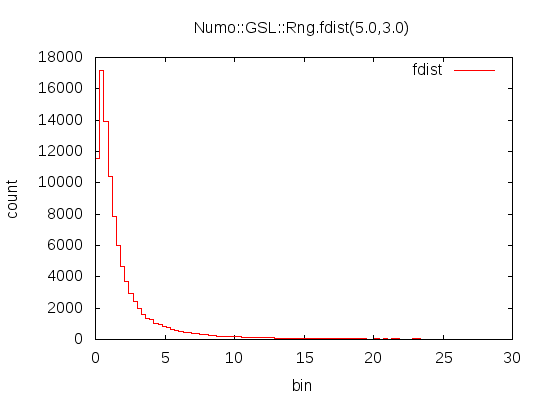
 ["fdist",[nu1,nu2]],
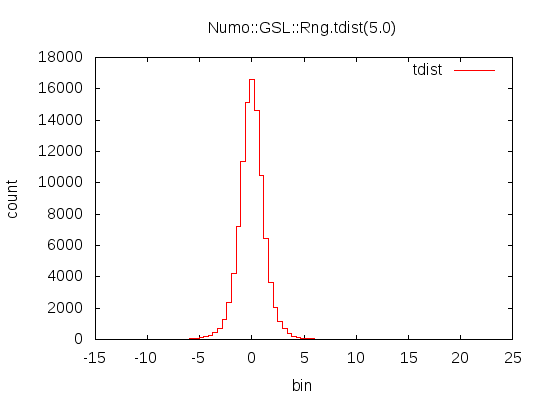
 ["tdist",[nu]],
 ["beta",[a,b]],
 ["logistic",[a]],
 ["pareto",[a,b]],
 ["weibull",[a,b]],
 ["gumbel1",[a,b]],
 ["gumbel2",[a,b]],
 ["poisson",[mu]],
 ["bernoulli",[p]],
 ["binomial",[p,n]],
 ["negative_binomial",[p,n]],
 ["pascal",[p,n]],
 ["geometric",[p]],
 ["hypergeometric",[n1,n2,t]],
 ["logarithmic",[p]],
].each do |m,a|
  dat = rng.send(m,*(a+[N]))
  s = {title:"Numo::GSL::Rng.#{m}(#{a.join(",")})"}
  gplot([*hist(dat,m),w:"histeps",t:m],s,m)
end
