The ultimate goal here is to build a digital dashboard for sustainable cities. We’re focusing on a few interesting contributing bits to this effort, using LA as an example:
-
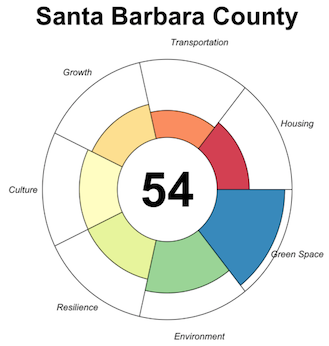
Describe framework for a sustainable city index based on Ocean Health Index a la sustainsb.github.io.
-
Assign weights on relative importance of goals using Twitter to assess social value [#2].
-
Describe candidate data layers for Los Angeles [#4].
-
LA data sources:
-
LA data applications:
-
data layers:
-
Greenhouse Gases from report Southern California Association of Governments (SCAG) Regional Greenhouse Gas Emissions Inventory and Reference Case Projections, 1990-2035
-
use ropensci/tabulizer to extract table from pdf
-
context: GHG Protocol for Cities
-
-
Transportation from report SCAG Regional Travel Demand Model and 2012 Model Validation: could map table of values by LA regions
-
-
-
Calculate scores automatically using Travis Continuous Integration, using sustainsb.github.io fetching USGS groundwater measurements as an example [#1].
-
Tweak rstudio/leaflet to allow for choropleth maps with select dropdown list, rather than simple show/hide layers [#3].
We’ll populate these into the LA public Trello board of projects to recruit fellow city data scientist enthusiasts.
PS: we have a spin-off of this: a quantified self package for collecting, visualising and archiving data about yourself called selfquant