The datasets on which the below analysis is based are provided here on a daily basis by the RKI, the public health institute in Germany. The nowcasts could not have been possible without the repositories of:
- Michael Böhme, maintained here
- CharlesStr, maintained here
- Irae Hueck Costa, maintained here
The nowcasting techniques used are described here.
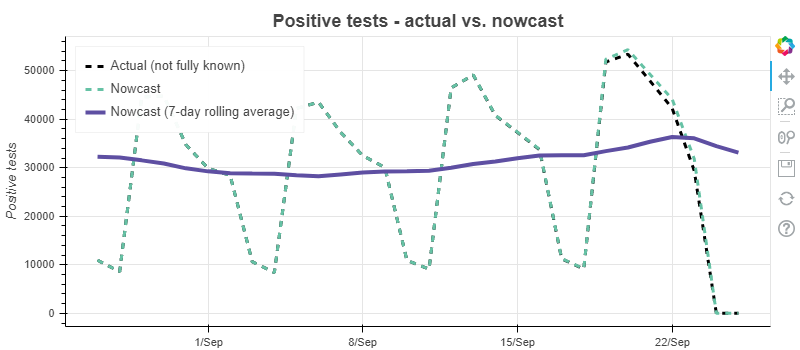
The below graph, which will be updated on a daily basis, shows the currently known amount of reported positive tests for the last 30 days ("Actual (not fully known)"), the nowcast for the reported amount of positive tests on a given date ("Nowcast"), as well as a 7-day rolling average of the number of reported positive tests (based on the nowcasts, "Nowcast (7-day rolling average)"). The nowcasts are generated by using a so-called Poisson chain ladder.
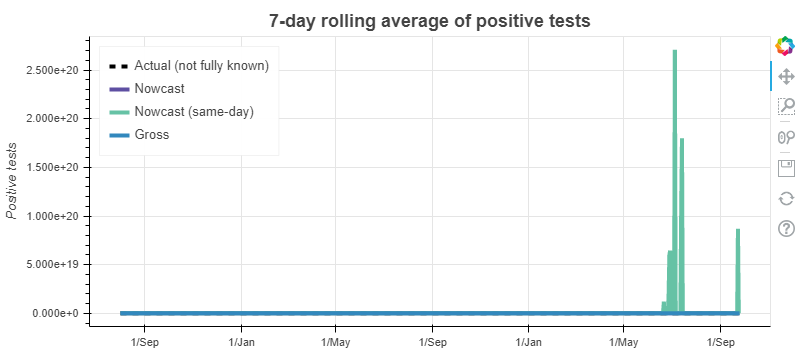
The next graph puts shows the 7-day rolling averages of the nowcast ("Nowcast") based on all information that is currently available, together with the past performance of the nowcast ("Nowcast (same-day)"), the gross reported number of positive tests ("Gross") as well as the actual data ("Actual (not fully known)").
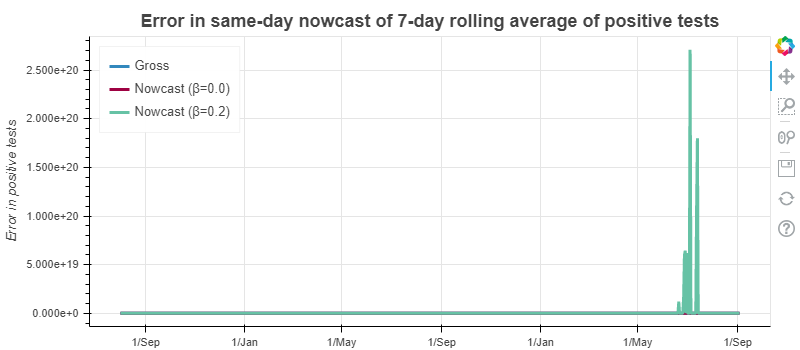
The error of the (7-day rolling average of the) nowcast can be seen in the graph below, where the error of the nowcast for various parameters (β = 0 corresponds to equal weights for all observations, the higher the value of β, the more weight is placed on recent observations) is compared to the error of the gross reported number of positive tests.