-
-
MachineSet is created.
-
Name of the machine set -gpu-. This should not be a hard requirement though.
-
Machine set has taint section
taints:
  - effect: NoSchedule
    key: odh-notebook  <--- Use own taint name or skip all together
    value: 'true'
-
MachineSet has a label
 metadata:
   labels:
     node-role.kubernetes.io/odh-notebook: '' <--- Put your label if needed
-
MachineSet instance type
 providerSpec:
   value:
   ........................
   instanceType: g5.2xlarge <---- Change vm type if needed
-
The nodes are provisioned with the proper label. The number of pods running should be greater than 20.
-
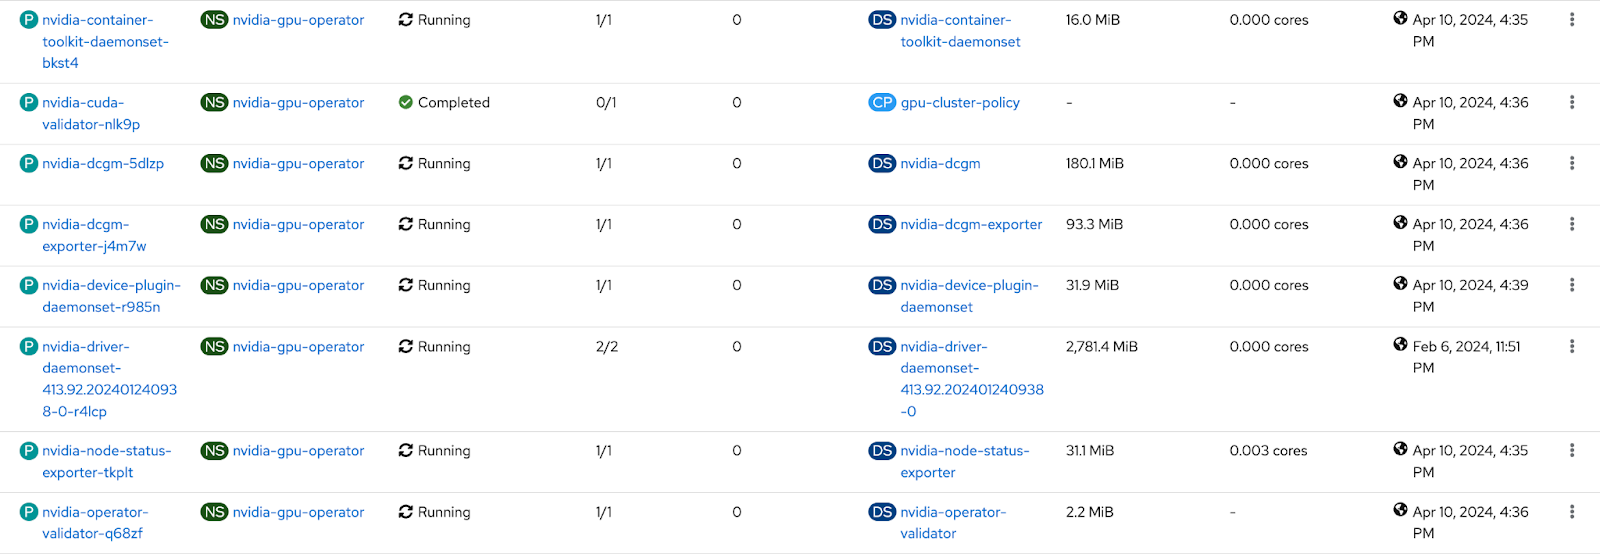
NVIDIA pods should be running on the nodes. Check the pods running on the GPU nodes.
-
-
Verify Node Feature Discovery Operator is installed:
-
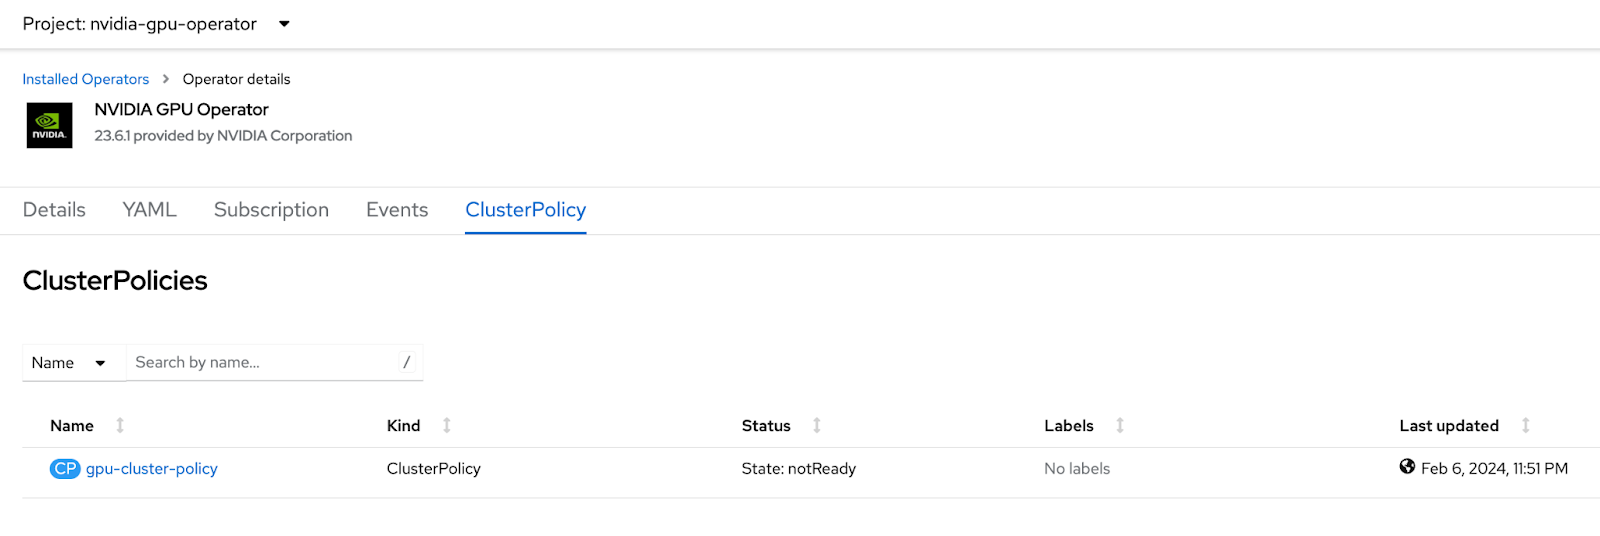
Verify NVIDIA GPU Operator is installed.
-
-
Application provisioned correctly.
-
Click on the rag-llm namespace
-
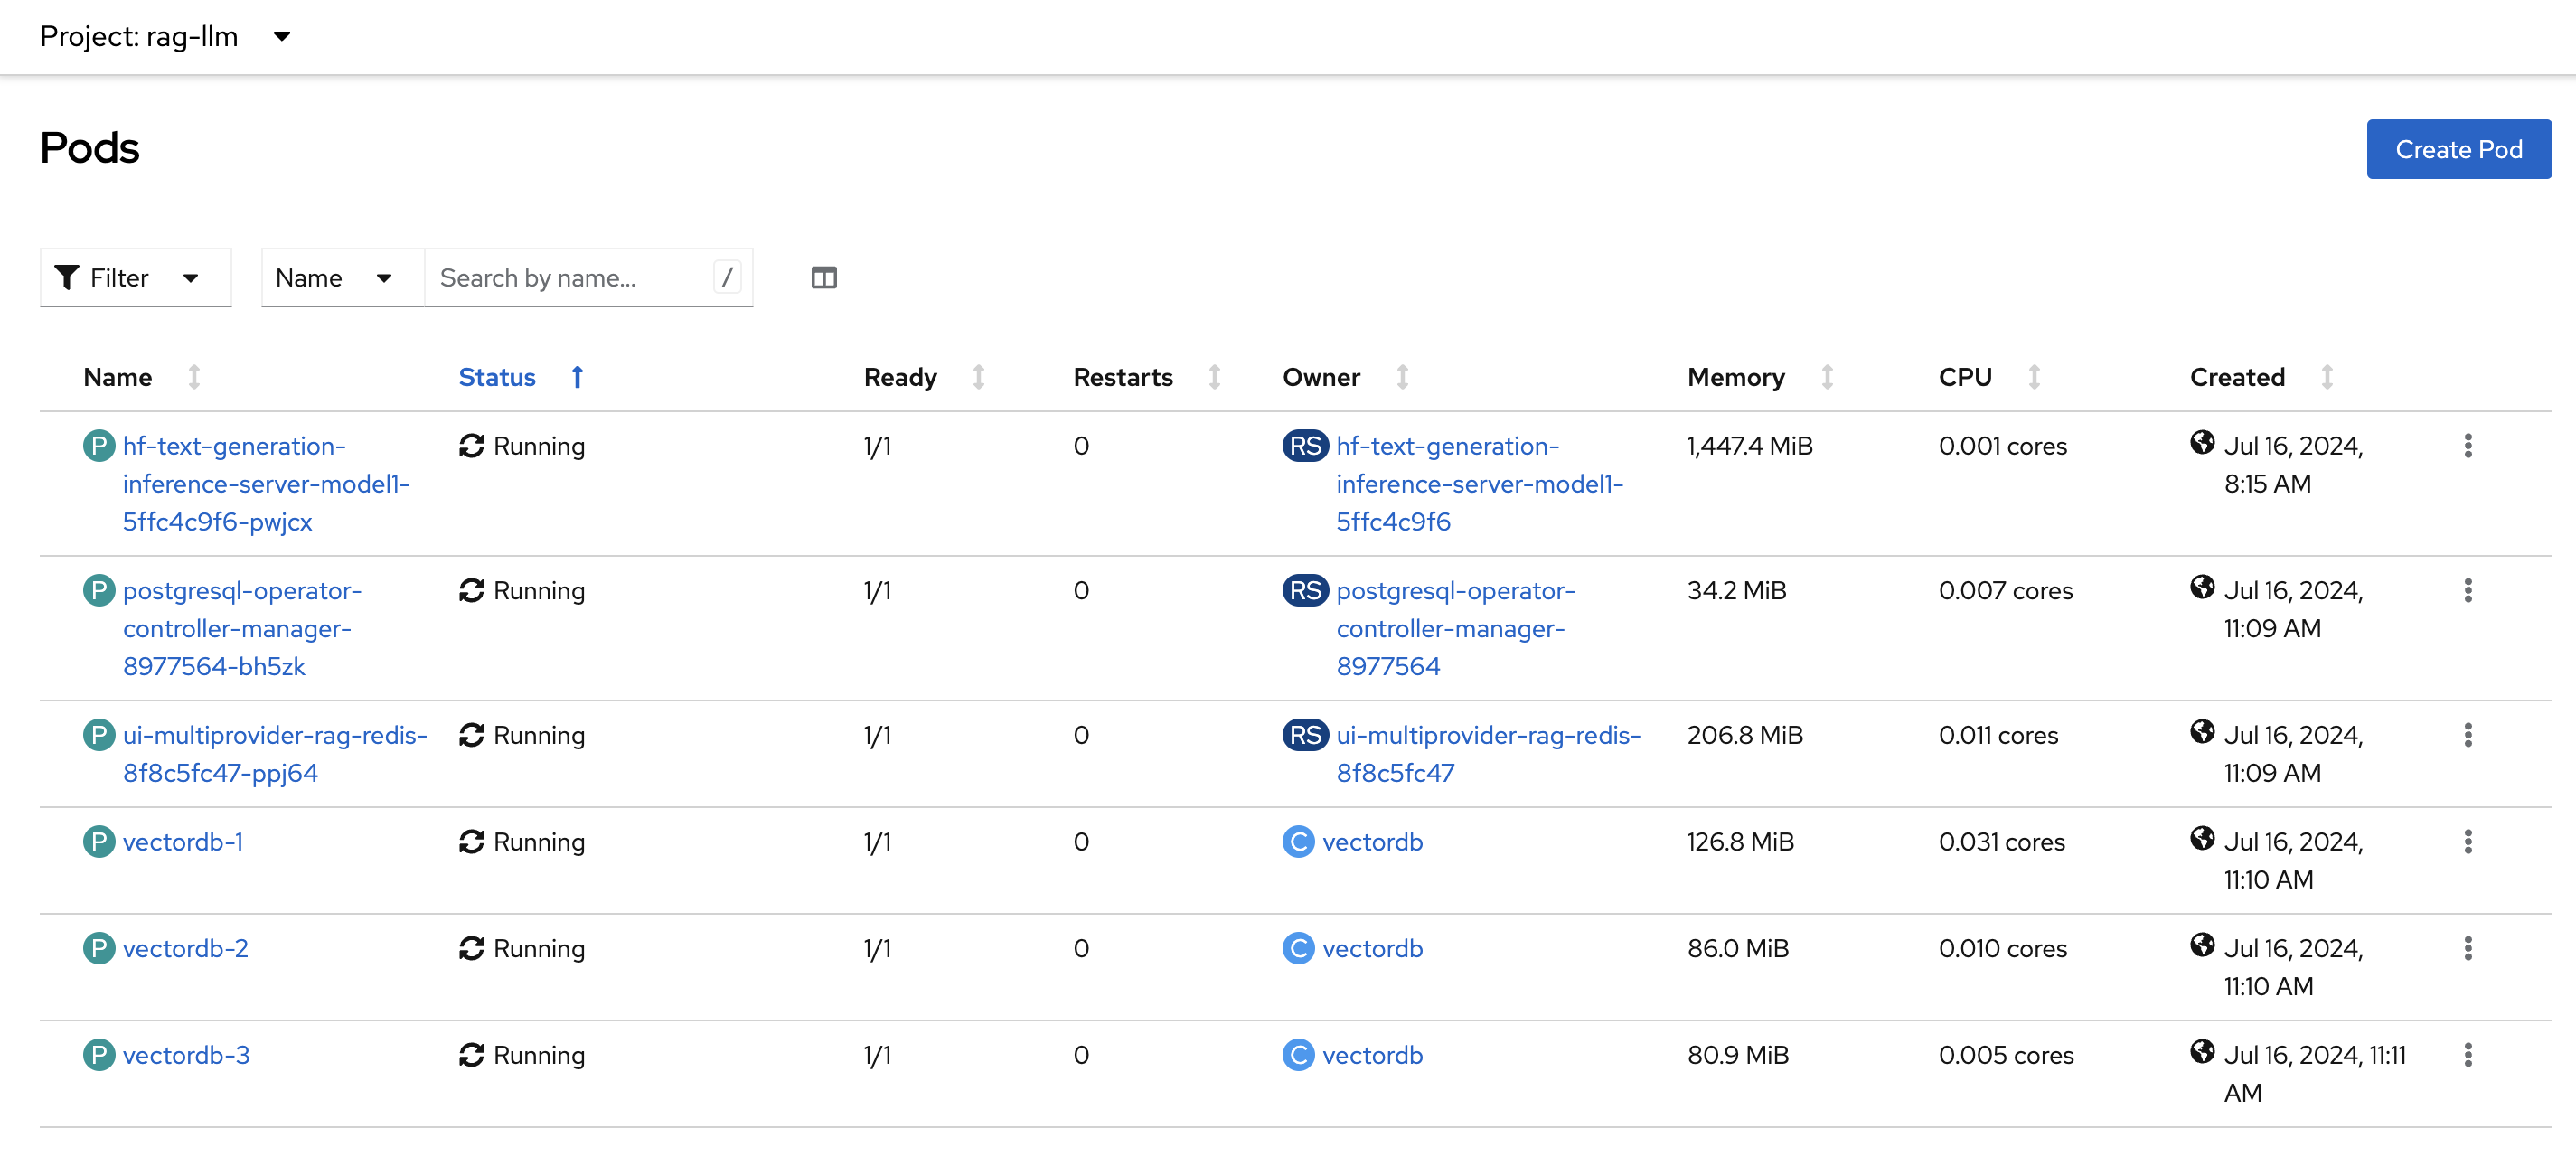
By Default, EDB Operator will be deployed, which will deploy PGVECTOR vector database, 6 pods should be running
-
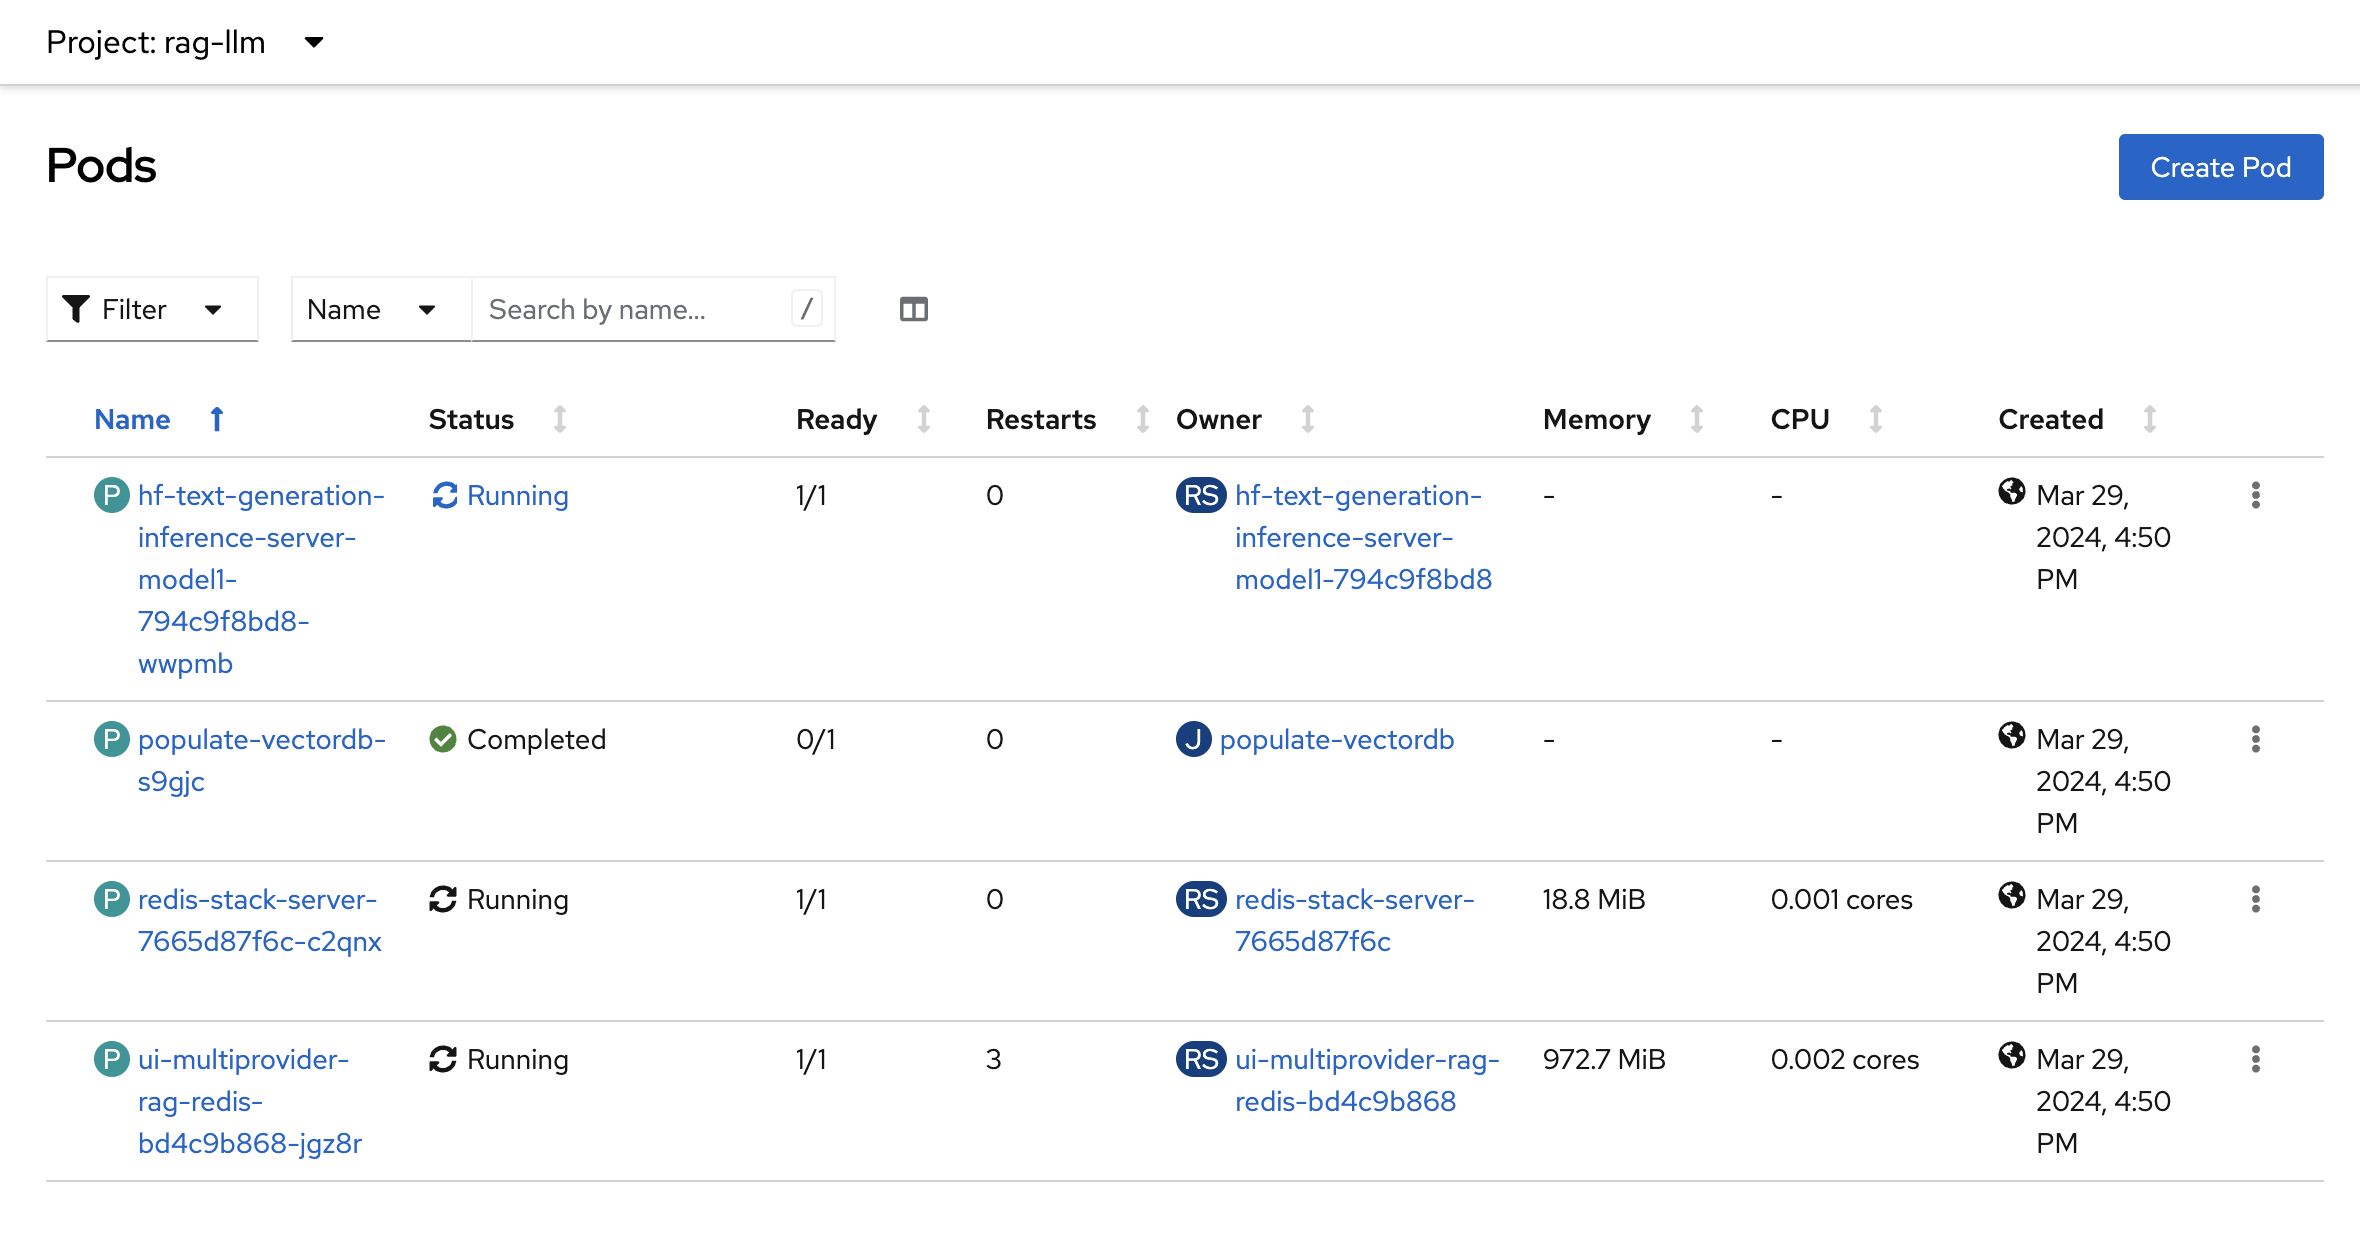
If the global.db.type is set to REDIS in the values-global.yaml, four pods should be running
-
Click on Networking → Routes from the left Navigation panel. An llm-ui route should exist
-
Click on the link under Location column and it should launch the application
-
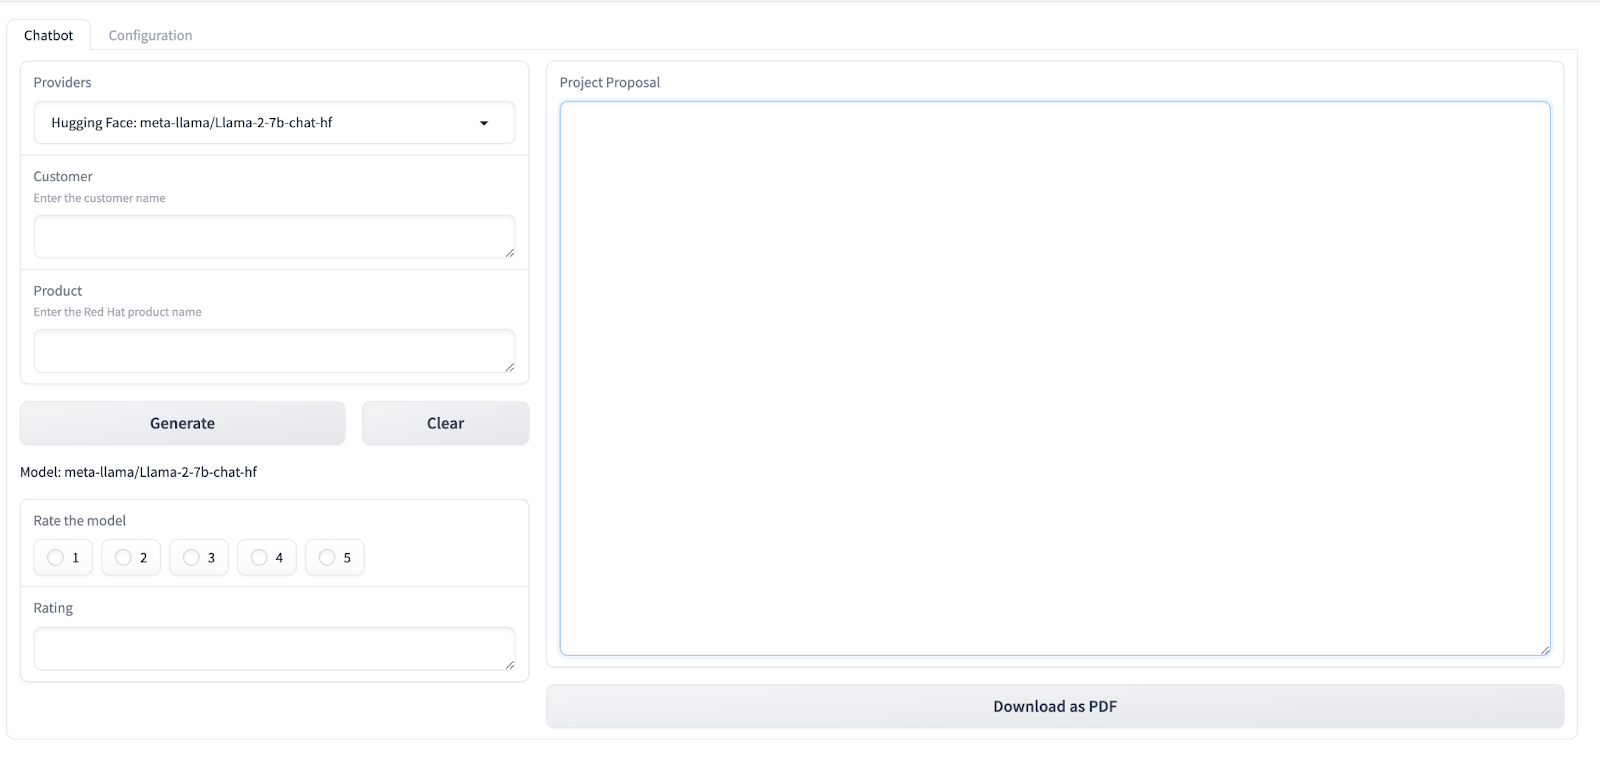
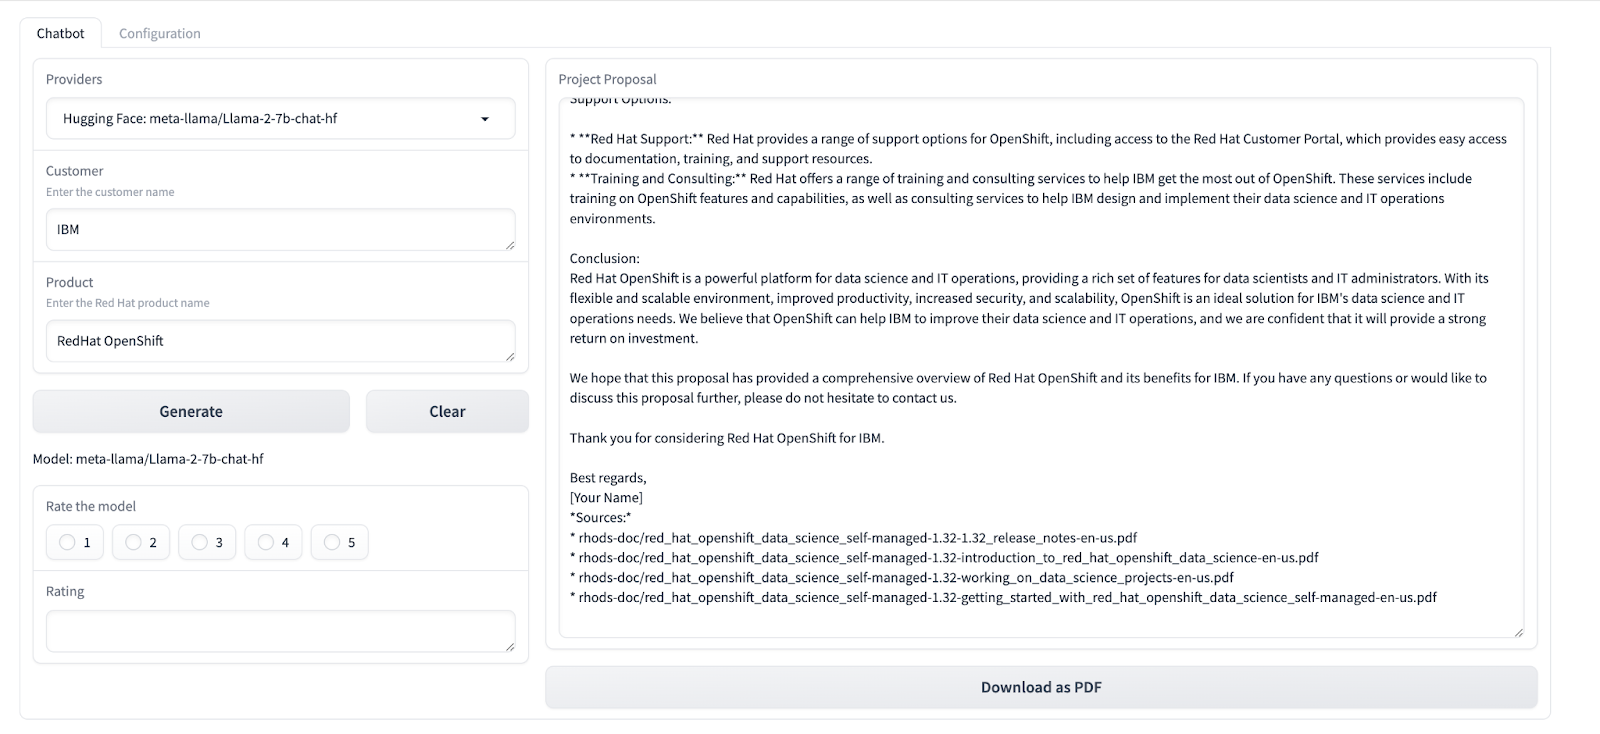
Enter customer name as ‘IBM’ and for product enter ‘RedHat OpenShift’ and click Generate. A project proposal should be generated
-
Click on Ratings to rate the model.
-
-
-
Verify Grafana and Prometheus are installed correctly.
- By default, Grafana application is deployed in llm-monitoring namespace.To launch the Grafana Dashboard, follow the instructions below:
-
Grab the credentials of Grafana Application
- Navigate to Workloads --> Secrets
- Click on the grafana-admin-credentials and copy the
GF_SECURITY_ADMIN_USER,GF_SECURITY_ADMIN_PASSWORD
-
Launch Grafana Dashboard
- Navigate to Networking --> Routes in the llm-monitoring namespace.
- Click on the Location link for grafana-route.
- Enter the Grafana admin credentials.
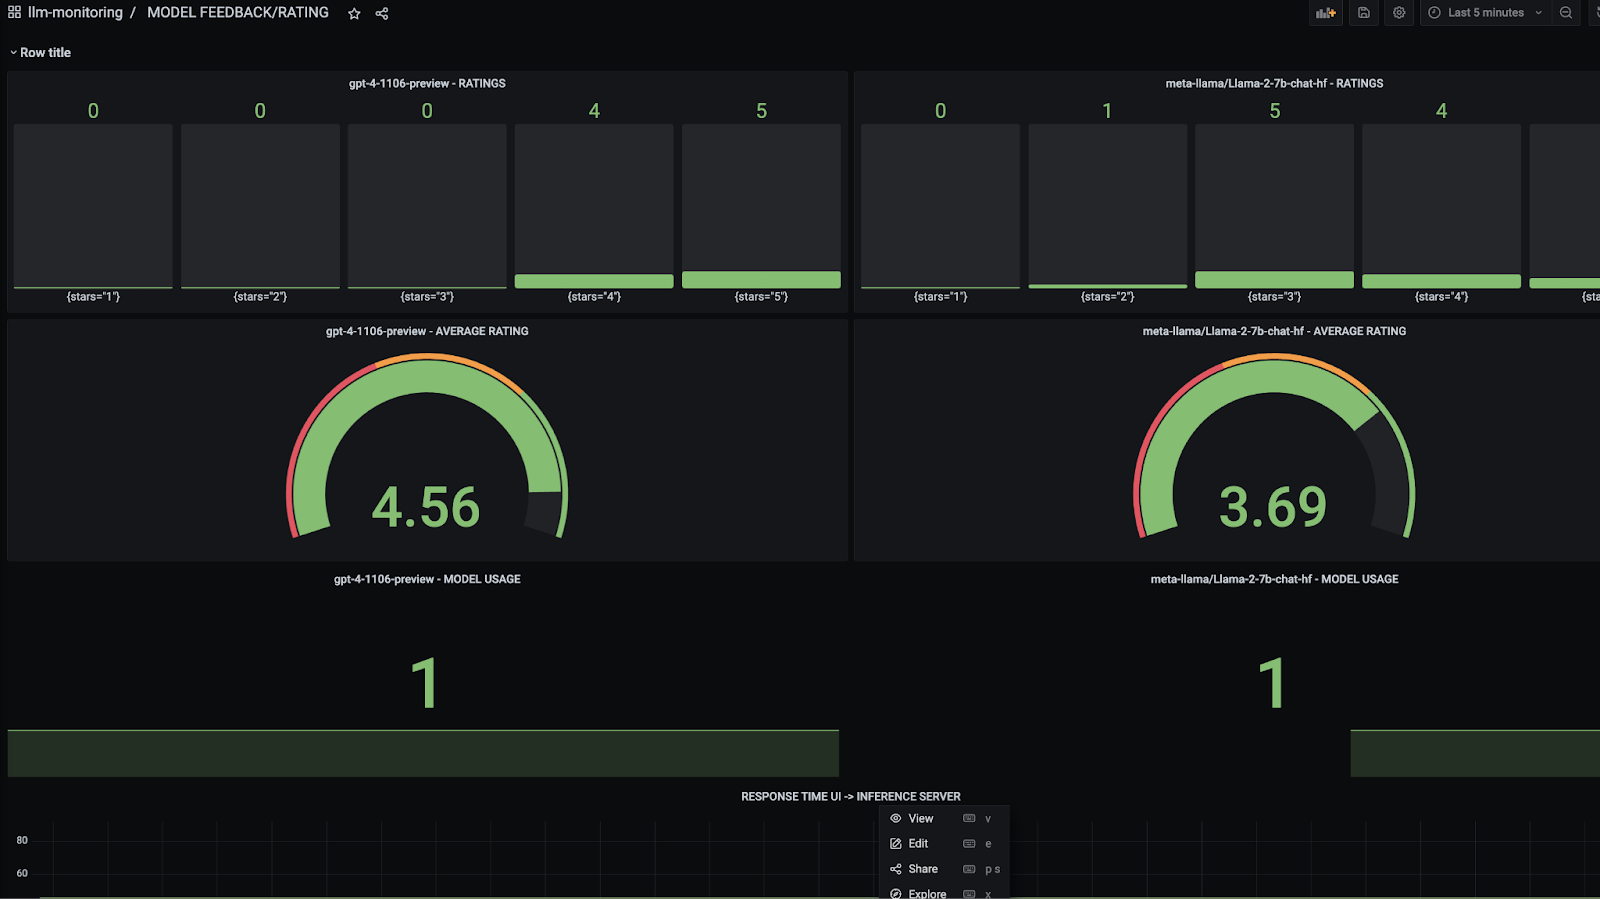
- Ratings are displayed for each model
-
Grafana Dashboard is displayed
-
- By default, Grafana application is deployed in llm-monitoring namespace.To launch the Grafana Dashboard, follow the instructions below:

