Skip to content
New issue

Have a question about this project? Sign up for a free GitHub account to open an issue and contact its maintainers and the community.

By clicking “Sign up for GitHub”, you agree to our terms of service and privacy statement. We’ll occasionally send you account related emails.

Already on GitHub? Sign in to your account

find_fisher_stats doesn't calculate fisher k or mean vector correctly for groups of poles which cross the dip=90 line #39

Open
JNDanielson opened this issue Mar 19, 2021 · 2 comments

Comments

@JNDanielson
Copy link

Hi Joe,
The find_fisher_stats, fisher_stats, and mean_vector functions don't seem to be calculating Fisher k (kappa) or the mean vector of a group of poles correctly where the group of poles includes orientations which cross a dip=90°.

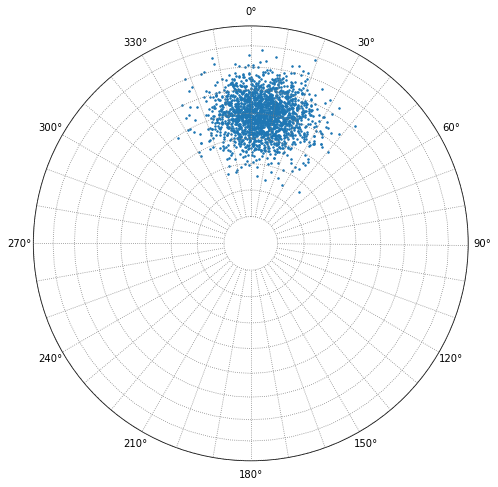
For example, the Fisher K and mean vector for this group of poles is correct. Calculated mean dip is 50°, Fisher K is 50.
image

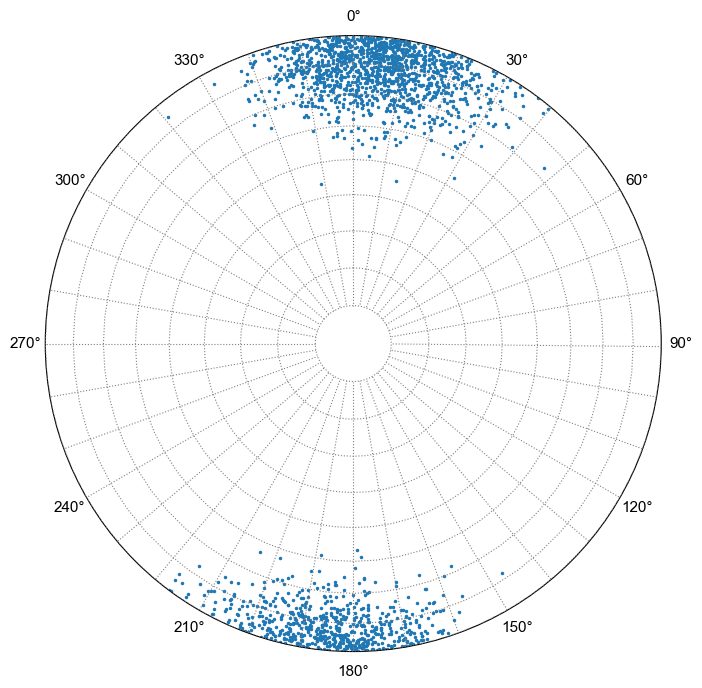
But, for this example the distribution has an actual Fisher k value of 25 and a mean dip of 85°, but the calculated kappa is 1.6 and the calculated mean dip is 62°.
image

I think the issue is the lines of code where you take the mean of the vectors.
xyz = np.vstack(xyz).T
mean_vec = xyz.mean(axis=0)

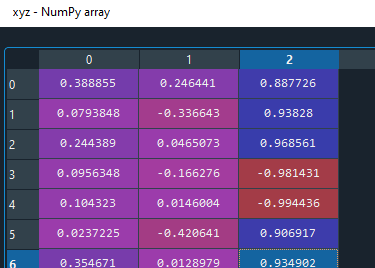
When the largest eigenvalue flips direction, just taking the mean gives you a bad result.
image

As a hack/workaround, I think you can do something like flip the normals so they all point in the same direction:
le = np.argmax(np.max(np.abs(xyz), axis=0)) # largest eigenvalue is the one we should normalize the others by
cond = xyz[:,le]<0
xyz = np.where(cond[:,None],xyz*-1,xyz)

But I bet you can come up with a better solution. This library is awesome, thanks for all your work on it!

@JNDanielson
Copy link
Author

JNDanielson commented Mar 23, 2021

Ok, I figured out a better solution to figure out the mean vector mean_vec. This uses the scatter matrix approach from Directional Statistics (Jupp and Mardia, 2000, pp.165).

import scipy.linalg as la
import numpy as np

# strikes, dips are variables containing orientations for the distribution of poles
lons, lats = mpl.stereonet_math.pole(np.mod(strikes,360),(dips))
x, y, z = mpl.stereonet_math.sph2cart(lons, lats)

xyz = np.hstack((x,y,z))
xyz = np.array(xyz).T

# xbar is the sample mean vector. This won't be accurate for vectors that point in opposite directions.
xbar = xyz.mean(axis=1)

# xobar is the sample mean direction
Rbar = np.linalg.norm(xbar)
xobar = xbar/Rbar
xobar = xobar.reshape(3,1)

# n is number of poles in the distribution
n = xyz.shape[1]

# initialize the scatter matrix T
T = np.zeros((3,3))

# Equation 9.2.10 from Directional Statistics (Jupp and Mardia, 2000, pp.165)
for i in range(n):
    T += (xyz[:,i].reshape(3,1)).dot((xyz[:,i].reshape(3,1)).T)
T = T/n

# Mean vector of distribution is one of the eigenvectors of the scatter matrix T
eigs = la.eigh(T)
mean_vec = eigs[1][:,2]
mean_pole = mpl.stereonet_math.vector2pole(mean_vec[1],mean_vec[2],-1*mean_vec[0])

### print results to test
calculated_strike = mean_pole[0]
calculated_dip = mean_pole[1]
print(calculated_strike)
print(calculated_dip)

@JNDanielson
Copy link
Author

I'll figure out how to make a pull request, but in the meantime here's a working update to the fisher_stats function that fixes the issues with mean orientation and kappa.

def fisher_stats(lons, lats, conf=95):
    """
    Returns the resultant vector from a series of longitudes and latitudes. If
    a confidence is set the function additionally returns the opening angle
    of the confidence small circle (Fisher, 19..) and the dispersion factor
    (kappa).

    Parameters
    ----------
    lons : array-like
        A sequence of longitudes (in radians)
    lats : array-like
        A sequence of latitudes (in radians)
    conf : confidence value
        The confidence used for the calculation (float). Defaults to None.

    Returns
    -------
    mean vector: tuple
        The point that lies in the center of a set of vectors.
        (Longitude, Latitude) in radians.

    If 1 vector is passed to the function it returns two None-values. For
    more than one vector the following 3 values are returned as a tuple:

    r_value: float
        The magnitude of the resultant vector (between 0 and 1) This represents
        the degree of clustering in the data.
    angle: float
        The opening angle of the small circle that corresponds to confidence
        of the calculated direction.
    kappa: float
        A measure for the amount of dispersion of a group of layers. For
        one vector the factor is undefined. Approaches infinity for nearly
        parallel vectors and zero for highly dispersed vectors.

    """
    xyz = sph2cart(lons, lats)
    xyz = np.vstack(xyz)

    # xbar is the sample mean vector
    xbar = xyz.mean(axis=1)

    # xobar is the sample mean direction
    r_value = np.linalg.norm(xbar)
    xobar = xbar/r_value
    xobar = xobar.reshape(3,1)
    num = xyz.shape[1]

    # Equation 9.2.10 from Directional Statistics (Jupp and Mardia, 2000, pp.165)
    T = np.zeros((3,3))
    for i in range(num):
        T += (xyz[:,i].reshape(3,1)).dot((xyz[:,i].reshape(3,1)).T)
    T = T/num

    # Mean vector of distribution is one of the eigenvectors of the scatter matrix T
    eigs = la.eigh(T)
    mean_vec = eigs[1][:,2]

    if num > 1:
        p = (100.0 - conf) / 100.0
        r_value = np.sqrt(eigs[0].max())
        vector_sum = mean_vec*num*r_value
        result_vect = np.sqrt(np.sum(np.square(vector_sum)))
        fract1 = (num - result_vect) / result_vect
        fract3 = 1.0 / (num - 1.0)
        angle = np.arccos(1 - fract1 * ((1 / p) ** fract3 - 1))
        angle = np.degrees(angle)
        kappa = (num - 1.0) / (num - result_vect)
        mean_vec = cart2sph(*mean_vec)
        return mean_vec, (r_value, angle, kappa)

    else:
        return None, None

Sign up for free to join this conversation on GitHub. Already have an account? Sign in to comment
Labels
None yet
Projects
None yet
Development

No branches or pull requests

1 participant