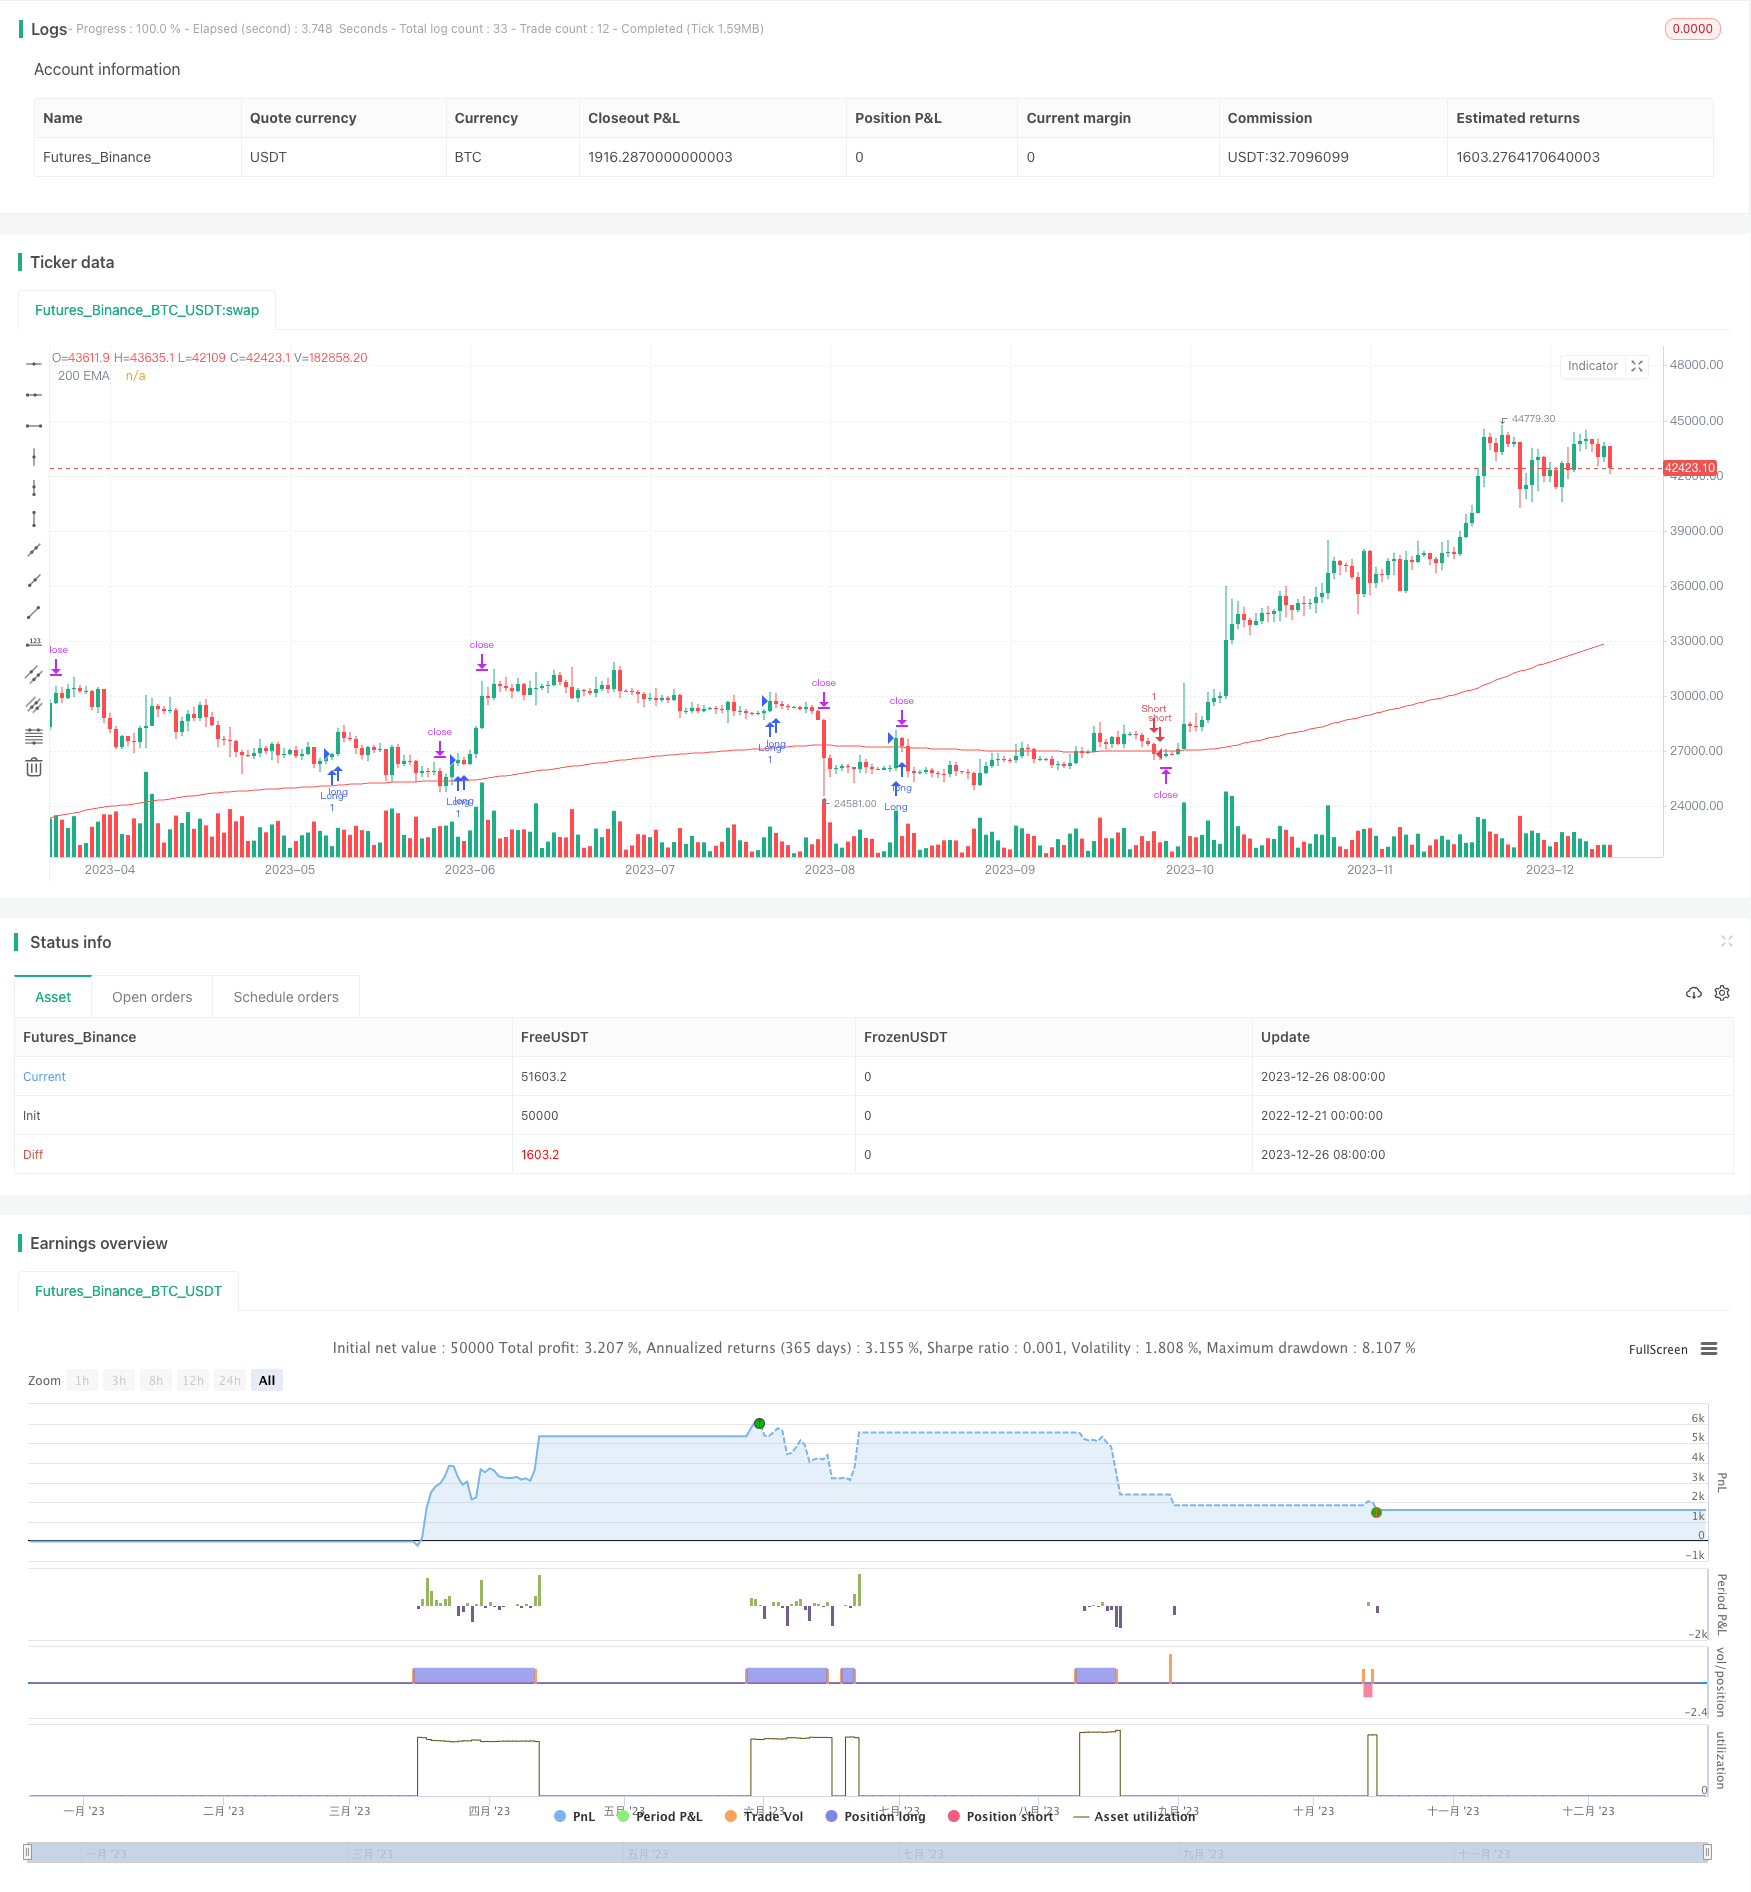
Name
MACD和EMA金叉死叉策略MACD-and-EMA-Crossover-Strategy
Author
ChaoZhang
Strategy Description
[trans]
该策略通过计算MACD指标的快线和慢线的交叉来判断入场和出场。同时结合EMA指标判断趋势方向。当快线从下方突破慢线而且MACD 값低于0时做多;当快线从上方跌破慢线而且MACD值高于0时做空。止损exit为当时信号产生时的EMA值;止盈为入场价乘以2。
当MACD的快线从下方突破慢线而且MACD值低于0时,说明股价的短期移动平均线开始上涨,动量开始增强,可以买入。当MACD的快线从上方突破慢线而且MACD值高于0时,说明股价的短期移动平均开始下跌,动量开始减弱,可以卖出。
EMA指标判断总体趋势方向。EMA值较高时为上升趋势,价值低于时为下降趋势。策略仅在EMA表示为上升趋势时做多,在EMA表示为下降趋势时做空,避免逆势交易。
止损方式为当信号产生时的EMA值。EMA能很好地判断趋势,设定为EMA值可以减少止损被前期低点或高点击穿的概率。止盈设定为入场点的2倍,收益风险比为2。
该策略结合MACD指标和EMA指标,能够较好地判断入场时机和趋势方向。止损方式合理,避免了追涨杀跌。收益风险比为2,属于较 conserve 的参数设定。MACD指标参数可调节,可以灵活适应市场的变化。
MACD指标存在avraging lag,指标转折往往滞后于价格转折。策略无法确定具体的入场点位,存在一定盲目性。止损容易被震荡行情触发。止盈点可能会提前或延迟被触发。
- 优化MACD指标的参数,使其更加灵敏或稳定。
- 结合其他指标判断入场时机,确定更准确的入场点位。
- 动态调整止损止盈参数。
- 优化资金管理,确定更合适的头寸大小。
该策略综合运用MACD指标和EMA指标判断入场时机和趋势方向。使用的是简单合理的止损止盈方式。可针对MACD指标滞后性、止损止盈参数等进行进一步优化,从而获得更好的策略效果。
||
This strategy uses the crossover of the MACD indicator fast and slow lines to determine entries and exits. The EMA indicator is also used to judge trend direction. It goes long when the fast line breaks through the slow line from below and the MACD value is below 0; it goes short when the fast line breaks through the slow line from above and the MACD value is above 0. The stop loss exit is set to the EMA value when the signal was generated; the take profit is set to 2 times the entry price.
When the fast line of the MACD breaks through the slow line from below and the MACD value is below 0, it indicates that the short-term moving average of the price starts to rise and the momentum begins to strengthen, so a long position can be taken. When the fast line breaks through the slow line from above and the MACD value is above 0, it indicates that the short-term moving average of the price begins to fall and the momentum begins to weaken, so a short position can be taken.
The EMA indicator judges the overall trend direction. Higher EMA values indicate an upward trend while lower values indicate a downward trend. The strategy only goes long when the EMA indicates an upward trend and goes short when the EMA indicates a downward trend to avoid counter trend trading.
The stop loss is set to the EMA value when the signal was generated. The EMA can judge the trend well. Setting it as the EMA value can reduce the probability of stop loss being taken out by previous low or high points. The take profit is set to 2 times the entry price, giving a risk reward ratio of 2.
This strategy combines the MACD and EMA indicators to better determine entry timing and trend direction. The stop loss method avoids chasing rises and selling falls. The risk reward ratio of 2 is a relatively conservative parameter setting. The parameters of the MACD indicator can be adjusted to flexibly adapt to market changes.
The MACD indicator has averaging lag, indicator turns tend to lag price turns. The strategy cannot determine specific entry points, there is some blindness. The stop loss tends to be triggered by volatile price action. Take profit points may be hit prematurely or with delay.
- Optimize parameters of MACD to make it more sensitive or stable.
- Incorporate other indicators to determine more accurate entry points.
- Dynamically adjust stop loss and take profit parameters.
- Optimize money management to determine more suitable position sizing.
This strategy combines the MACD and EMA indicators to determine entry timing and trend direction. It uses simple and reasonable methods for stop loss and take profit. Further optimizations can be done on the lagging of the MACD, stop loss and take profit parameters etc. to obtain better strategy results. [/trans]
Strategy Arguments
| Argument | Default | Description |
|---|---|---|
| v_input_1 | 12 | Fast Length |
| v_input_2 | 26 | Slow Length |
| v_input_3 | 9 | Signal Length |
Source (PineScript)
/*backtest
start: 2022-12-21 00:00:00
end: 2023-12-27 00:00:00
period: 1d
basePeriod: 1h
exchanges: [{"eid":"Futures_Binance","currency":"BTC_USDT"}]
*/

//@version=5
strategy("MACD & EMA 200 Strategy", overlay=true)

// MACD Settings
fastLength = input(12, title="Fast Length")
slowLength = input(26, title="Slow Length")
signalLength = input(9, title="Signal Length")
src = close

[macdLine, signalLine, _] = ta.macd(src, fastLength, slowLength, signalLength)

// 200 EMA
ema200 = ta.ema(src, 200)
plot(ema200, title="200 EMA", color=color.red)

// Long Condition
longCondition = ta.crossover(macdLine, signalLine) and macdLine < 0 and close > ema200
if (longCondition and strategy.position_size <= 0)
    strategy.entry("Long", strategy.long)
    longStopLoss = ema200
    longTakeProfit = close + 2 * (close - ema200)
    strategy.exit("Exit Long", "Long", stop=longStopLoss, limit=longTakeProfit)

// Short Condition
shortCondition = ta.crossunder(macdLine, signalLine) and macdLine > 0 and close < ema200
if (shortCondition and strategy.position_size <= 0)
    strategy.entry("Short", strategy.short)
    shortStopLoss = ema200
    shortTakeProfit = close - 2 * (ema200 - close)
    strategy.exit("Exit Short", "Short", stop=shortStopLoss, limit=shortTakeProfit)
Detail
https://www.fmz.com/strategy/436876
Last Modified
2023-12-28 15:22:14
