Name
Ichimoku云图量化交易策略A-Quantitative-Ichimoku-Cloud-Trading-Strategy
Author
ChaoZhang
Strategy Description
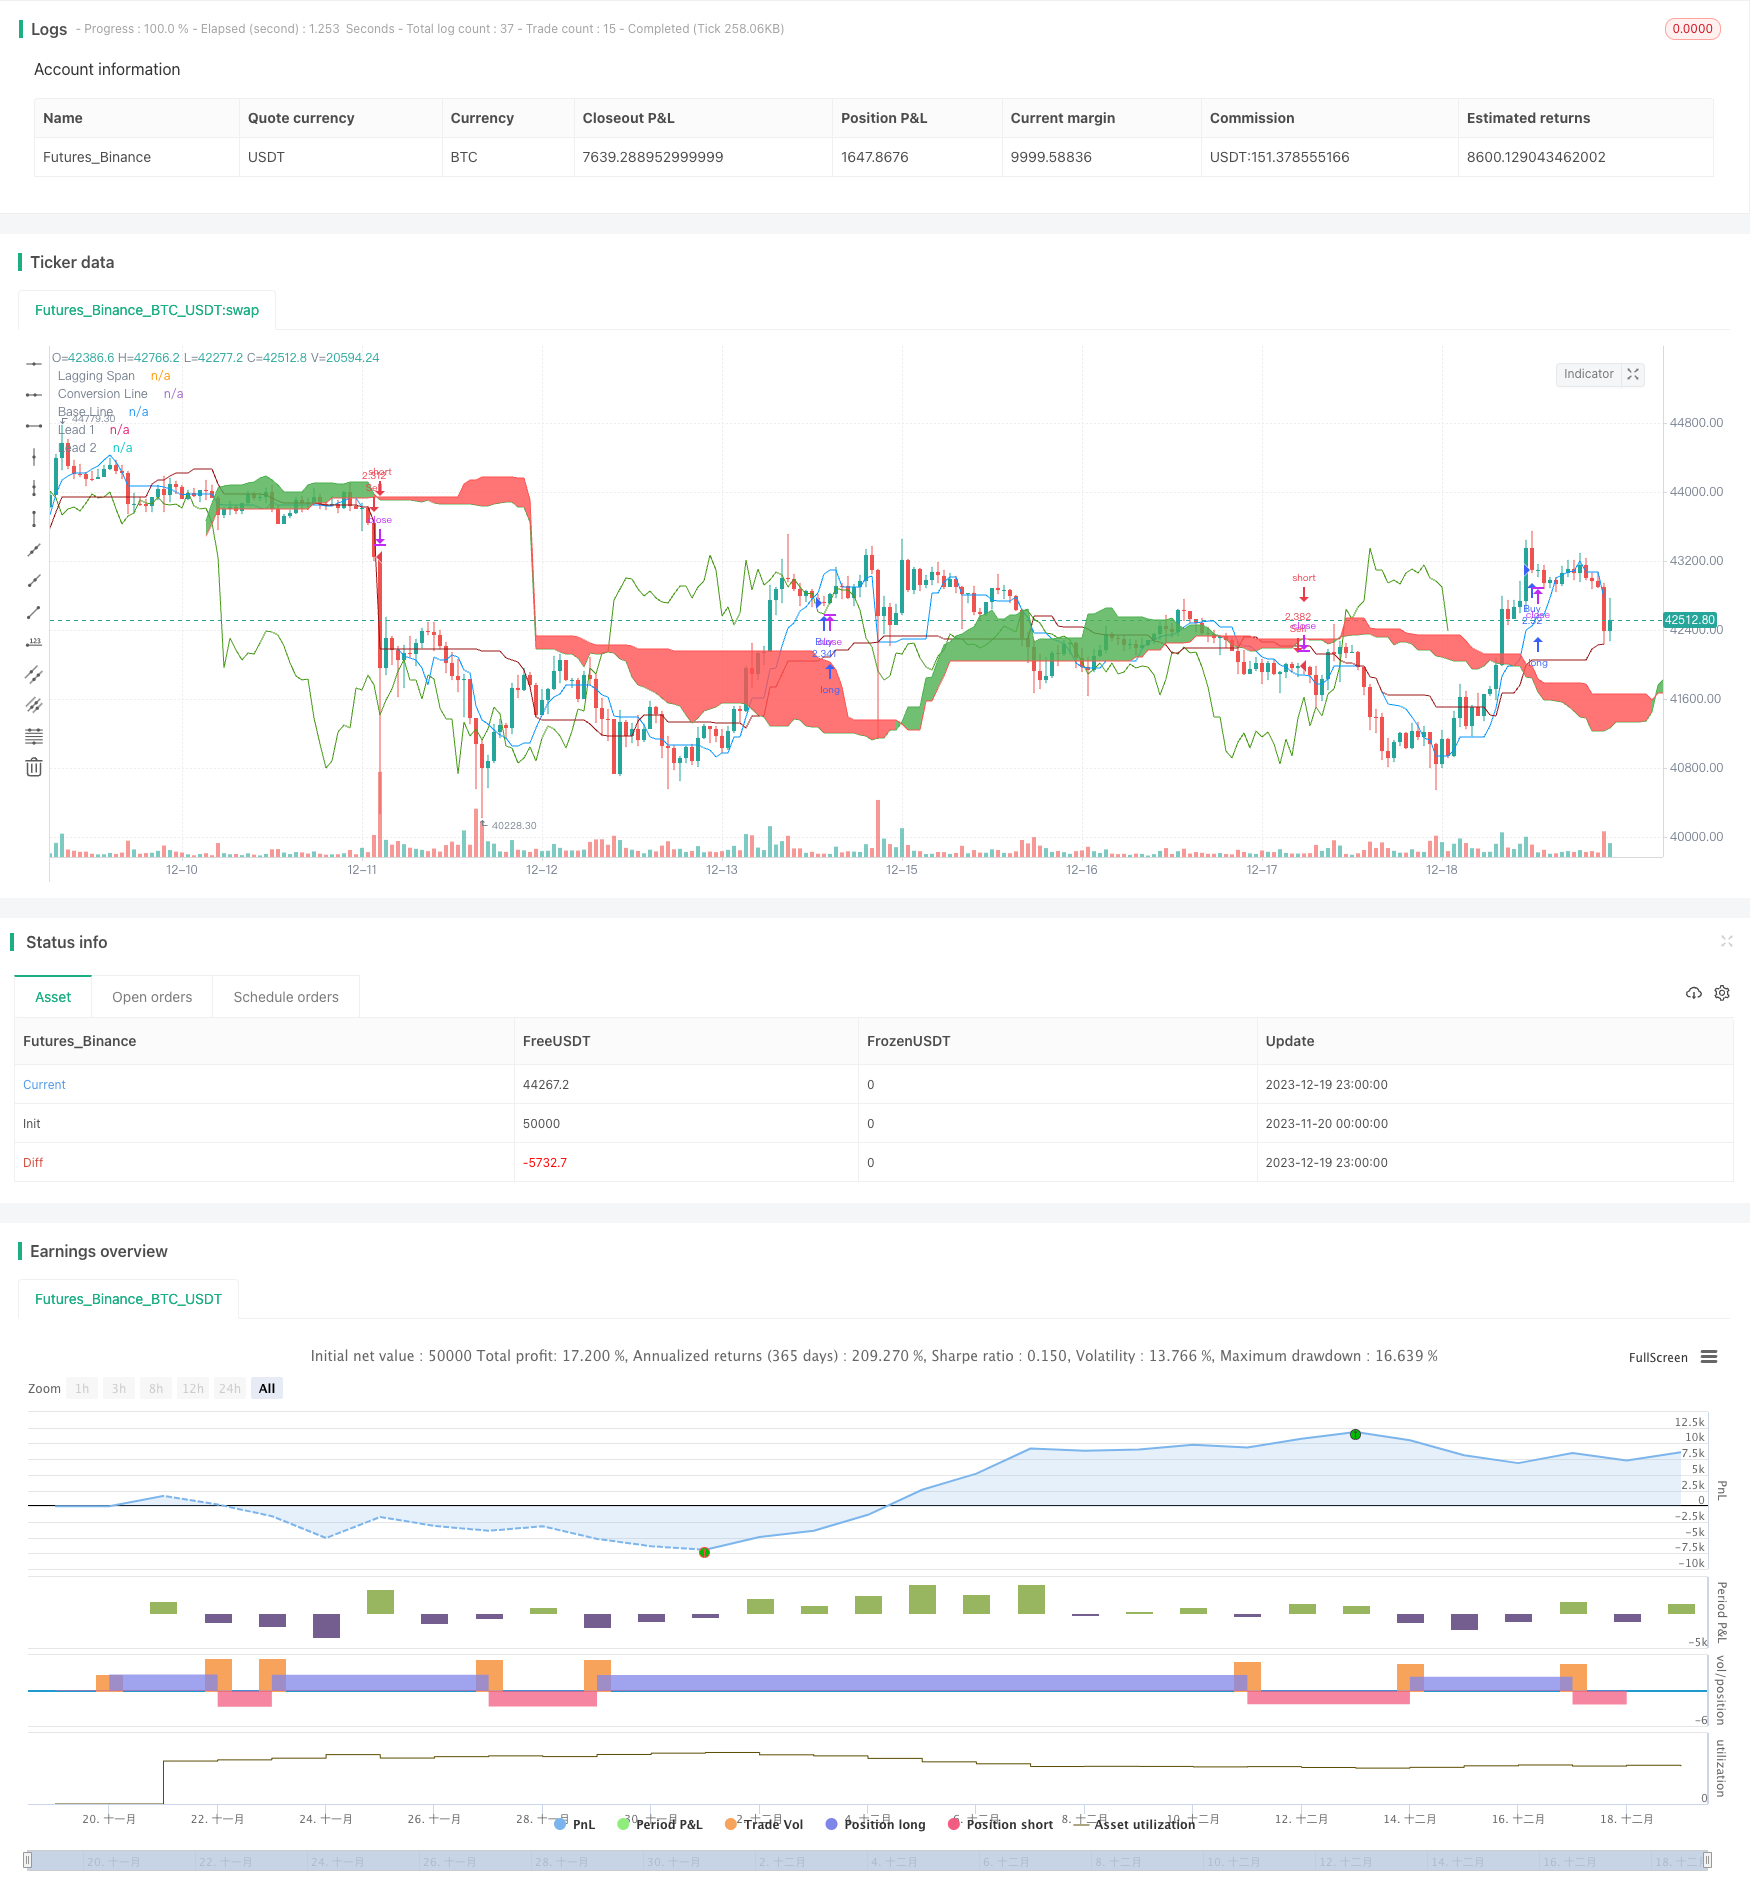
本策略基于市场技术分析中一种著名的趋势指标---Ichimoku云图,利用Ichimoku云图的转换线、基准线和云图之间的交叉关系来判断市场趋势,并进行量化交易。该策略适用于追踪市场中期趋势的交易者。
该策略的核心指标是Ichimoku云图中的三条线:转换线、基准线和云图。转换线代表近期价格动量,基准线代表中期价格趋势,而云图则可视化地反映中长期支持与阻力区域。策略通过判断这三者之间的交叉关系来确定市场趋势和交易信号。
具体来说,策略逻辑主要基于以下规则:
-
当基准线上穿云图时,表示中期趋势转为上涨,做多;
-
当转换线上穿云图时,表示短期价格开始反弹,做多;
-
当基准线下穿云图时,表示中期趋势转为下跌,做空;
-
当转换线下穿云图时,表示短期价格开始下挫,做空。
此外,为过滤假信号,策略还加入价格与云图之间的交叉作为辅助条件。只有转换线或基准线交叉云图,而价格同时也交叉云图,才会生成真正的交易信号。
相比单一使用移动平均线等指标,本策略最大的优势在于同时结合多时间段的数据,判断市场结构的变化。转换线反映短期情况,基准线反映中期趋势,云图反映长期支撑阻力。它们的组合可以更准确地把握住市场的转折点。此外,Ichimoku云图本身就具有滤波假信号的功能,避免买入噪音中的小峰或卖出噪音中的小谷,从而帮助我们抓住中长期趋势。
本策略最大的风险在于Ichimoku云图本身对参数设置较为敏感。如果参数设定不当,容易产生错误信号。此外,在震荡行情中,云图常常扁平化,导致产生大量不确定信号。策略订单的频繁打开与停止损耗手续费。最后,中长线交易本身具有亏损扩大的风险,需要严格控制止损点。
为降低风险,我们可以调整参数组合、设置止损策略、止盈策略,甚至可以考虑与其他指标组合使用Ichimoku云图。
本策略可以从以下几个方面进行优化:
-
优化参数组合。可以尝试不同长度周期的参数,找到最匹配目标交易品种的组合。
-
增加过滤条件。可以加入其他指标,确保在趋势选择上更加可靠。例如加入量能指标,确保在量能放大时打开订单。
-
增加止损机制。 trailing stop 或时间止损可以进一步控制单笔亏损。
-
结合波段策略。在中长线趋势基础上,识别更短周期的反转作为入场时机。
Ichimoku云图量化策略通过基准线、转换线与云图的交叉判定中长期趋势,并以此作为交易信号。相比单一指标,它综合判断多时间段的数据,能更可靠地判断结构性变化。同时内在的滤波机制也避免追逐市场噪音。如果参数优化和风险控制到位,该策略可以产生稳定的超额收益。它适合有经验的趋势交易者进行中长期持仓。
||
This strategy is based on the Ichimoku Cloud, a famous trend indicator in technical analysis, to determine market trends and generate trading signals by observing the crossover relationships between the Conversion Line, Base Line and Cloud Lines from the Ichimoku system. It is suitable for traders who want to track intermediate-term trends in the market.
The core components of this strategy are the three lines from the Ichimoku Cloud system: Conversion Line, Base Line and Cloud Lines. The Conversion Line represents short-term price action, the Base Line shows intermediate-term trends, while the Cloud visualizes areas of support and resistance. The strategy identifies market trends and trading opportunities by detecting crosses between these three elements.
Specifically, the main rules of this strategy are:
-
When the Base Line crosses above the Cloud, an upward trend is emerging in the intermediate-term, go long.
-
When the Conversion Line crosses above the Cloud, prices are starting to bounce back short-term, go long.
-
When the Base Line crosses below the Cloud, a downward trend is emerging, go short.
-
When the Conversion Line crosses below the Cloud, prices are starting to fall short-term, go short.
In addition, crosses between price and Cloud Lines act as filters for trade signals. Only when both the Conversion/Base Line and price cross the cloud together will a valid signal be generated.
Compared to single indicators like moving averages, the biggest advantage of this strategy is incorporating data from multiple timeframes to detect trend changes. The Conversion Line shows short-term moves, the Base Line intermediate moves and the Cloud reveals longer-term support/resistance levels. Their combination identifies turning points more accurately. Also, the inherent filtering mechanism of the Ichimoku reduces whipsaws from market noise, allowing us to capture the bigger trend.
The biggest risk is that the Ichimoku system is sensitive to input parameters. Inappropriate settings may produce bad signals frequently. Also, the cloud tend to flatten during range-bound periods, causing uncertain signals. Frequent order openings and stops may incur large commission fees. In addition, intermediate-term trades come with larger loss risks per trade, requiring strict risk control.
To mitigate risks, we can tweak the parameter mix, set stop loss/take profit levels or combine Ichimoku with other indicators.
There are several ways we can enhance this strategy:
-
Optimize parameter combinations to find the best fit for different trading instruments.
-
Add filtering conditions with other indicators to reinforce trend validation. For example, only take signals when trading volume expands.
-
Incorporate stop loss mechanisms like trailing stops or time stops to control single trade loss.
-
Combine with swing trading approaches to fine tune entry timing within bigger trends.
The Ichimoku Cloud strategy identifies intermediate-term trends using crosses of the Conversion/Base Lines against the Cloud. Compared to single indicators, it incorporates multiple timeframes for reliable trend change detection. The inherent noise filtering also avoids whipsaws. With proper parameter tuning and risk management, this strategy can generate stable excess returns over the long run. It suits experienced trend traders with intermediate-term holding periods.
[/trans]
Strategy Arguments
| Argument | Default | Description |
|---|---|---|
| v_input_1 | 9 | Conversion Line Periods |
| v_input_2 | 26 | Base Line Periods |
| v_input_3 | 52 | Lagging Span 2 Periods |
| v_input_4 | 26 | Displacement |
Source (PineScript)
/*backtest
start: 2023-11-20 00:00:00
end: 2023-12-20 00:00:00
period: 1h
basePeriod: 15m
exchanges: [{"eid":"Futures_Binance","currency":"BTC_USDT"}]
*/

//@version=3
strategy(title="Ichimoku Cloud", shorttitle="Ichimoku", overlay=true, default_qty_type=strategy.cash, default_qty_value=100000, initial_capital=100000, currency=currency.USD)


conversionPeriods = input(9, minval=1, title="Conversion Line Periods"),
basePeriods = input(26, minval=1, title="Base Line Periods")
laggingSpan2Periods = input(52, minval=1, title="Lagging Span 2 Periods"),
displacement = input(26, minval=1, title="Displacement")

donchian(len) => avg(lowest(len), highest(len))

conversionLine = donchian(conversionPeriods)
baseLine = donchian(basePeriods)
leadLine1 = avg(conversionLine, baseLine)
leadLine2 = donchian(laggingSpan2Periods)

plot(conversionLine, color=#0496ff, title="Conversion Line")
plot(baseLine, color=#991515, title="Base Line")
plot(close, offset = -displacement, color=#459915, title="Lagging Span")

p1 = plot(leadLine1, offset = displacement, color=green,
 title="Lead 1")
p2 = plot(leadLine2, offset = displacement, color=red,
 title="Lead 2")
fill(p1, p2, color = leadLine1 > leadLine2 ? green : red)


maxlead = max(leadLine1, leadLine2)
minlead = min(leadLine1, leadLine2)

//rules
A = baseLine> maxlead[displacement]
B = crossover(baseLine,  maxlead[displacement])

C = baseLine< minlead[displacement]
D = crossunder(baseLine, minlead[displacement])


E = conversionLine> maxlead[displacement]
F = crossover(conversionLine, maxlead[displacement])

G = conversionLine< minlead[displacement]
H = crossunder(conversionLine, minlead[displacement])


I = close>  maxlead[2*displacement]
J = crossover(close, maxlead[2*displacement])

K = close<minlead[2*displacement]
L = crossunder(close, minlead[2*displacement])


//strategies
if A
    if E
        strategy.entry("Buy", strategy.long, when= J)
if A
    if I
        strategy.entry("Buy", strategy.long, when= F)
if E
    if I
        strategy.entry("Buy", strategy.long, when= B)

if C
    if G
        strategy.entry("Sell", strategy.short, when=L)
if C
    if K
        strategy.entry("Sell", strategy.short, when=H)
if G
    if K
        strategy.entry("Sell", strategy.short, when=D)

//EOS
Detail
https://www.fmz.com/strategy/436133
Last Modified
2023-12-21 15:33:05
