Name
Heikin-Ashi与考夫曼自适应移动平均线交易策略Heikin-Ashi-and-Kaufman-Adaptive-Moving-Average-Trading-Strategy
Author
ChaoZhang
Strategy Description
[trans]
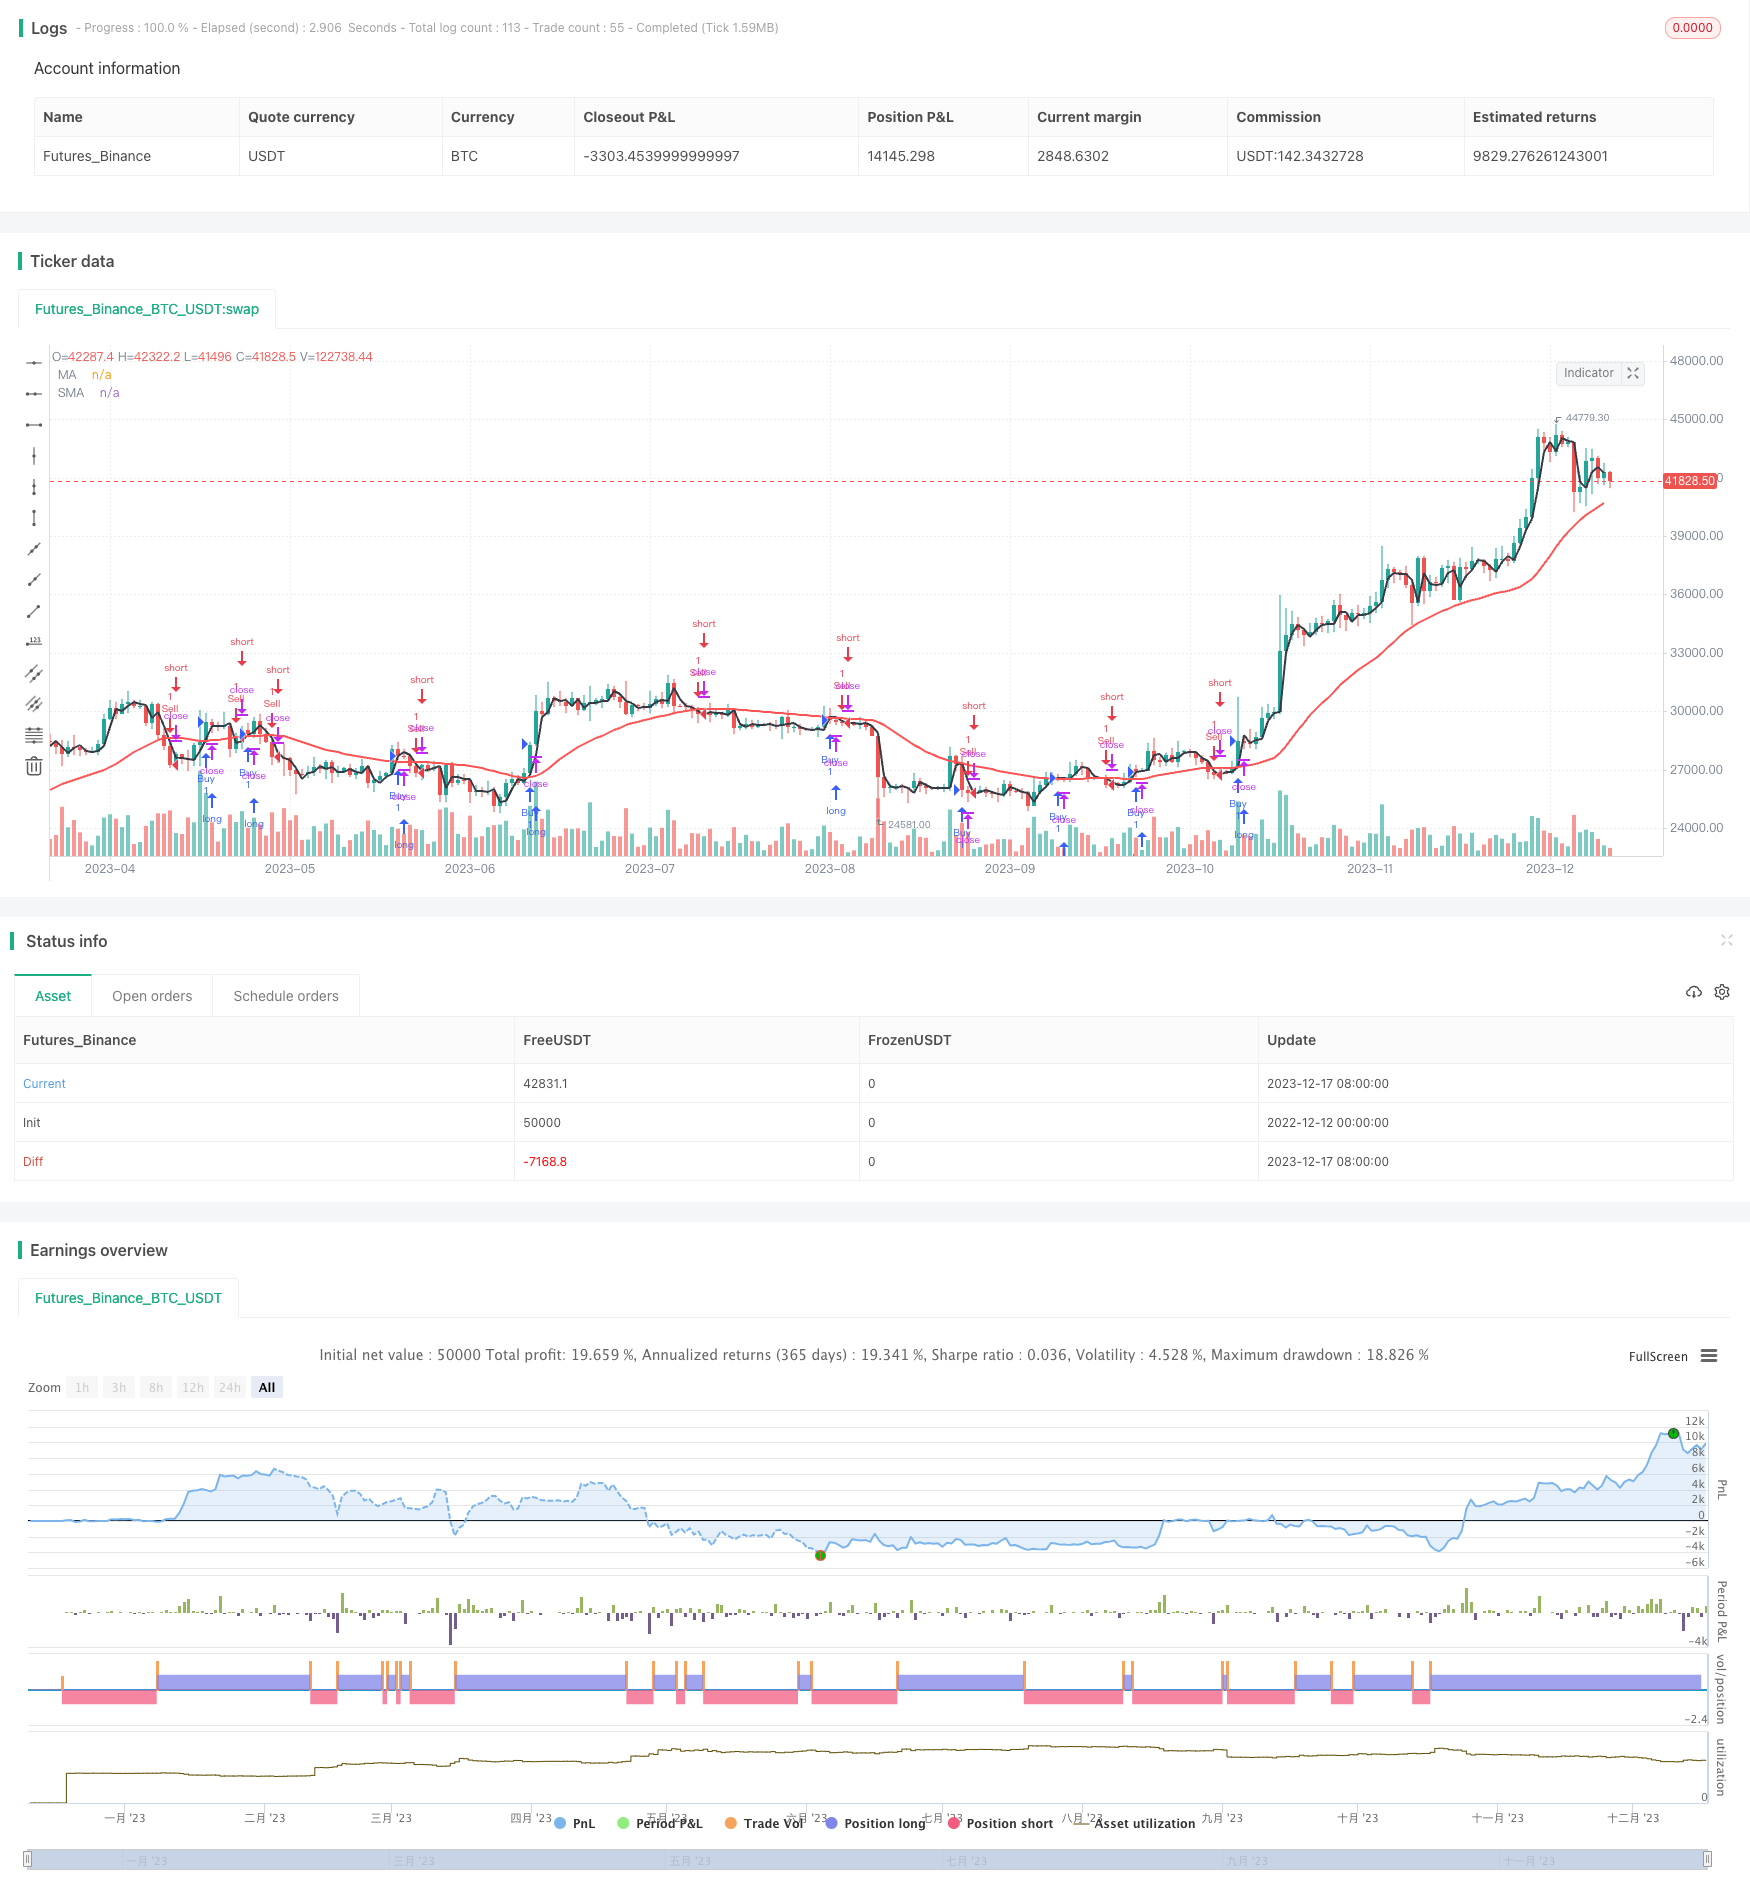
Heikin Ashi与考夫曼自适应移动平均线交易策略(HLC3/Kaufman Strategy)是一个结合Heikin Ashi K线和考夫曼自适应移动平均线(KAMA)的量化交易策略。该策略通过Heikin Ashi K线来确定交易方向,再利用考夫曼自适应移动平均线作为辅助指标进行交易信号过滤。
该策略主要由以下几个部分组成:
-
计算Heikin Ashi开盘价、收盘价。这些价格反映了K线实体的中间价格,可以过滤掉部分噪声。
-
计算考夫曼自适应移动平均线(KAMA)。KAMA能够动态调整自己的平滑度,在市场突发大幅波动时不会产生太多滞后。
-
比较Heikin Ashi收盘价与KAMA的大小关系来确定买入和卖出信号。当Heikin Ashi收盘价上穿KAMA时产生买入信号;当Heikin Ashi收盘价下穿KAMA时产生卖出信号。
-
可以添加ADX指标来判断趋势强弱,避免在震荡市场中产生错误信号。
该策略最大的优势在于结合了Heikin Ashi K线和KAMA的双重过滤,可以大大减少噪声交易和错误信号。具体优势如下:
- Heikin Ashi K线本身就具有去噪功能,从而过滤了部分短期波动。
- KAMA相比SMA和EMA更加灵敏,能够有效跟踪大级别的趋势变化。
- 结合Heikin Ashi和KAMA的双重滤波机制能够减少误差。
- 可配置ADX指标判断趋势强弱,避免错误信号。
- 交易信号直接明确,操作起来简单、灵活。
- 部分震荡行情中可能会产生错误信号,应适当调整参数来避免这种风险。
- 过于灵敏的取参容易追高杀跌,应适当放宽KAMA参数。
- 长期趋势行情中,KAMA可能会落后于价格变化一定程度。这需要结合ADX指标来确定趋势稳定性。
- 优化Heikin Ashi收盘价和KAMA参数,找到最佳过滤条件。
- 添加趋势判断指标如ADX,确保在趋势稳定时才产生交易信号。
- 结合其他辅助指标如Boll线来设定止损标准。
- 测试不同品种参数的稳定性,寻找最优参数组合。
Heikin Ashi与考夫曼自适应移动平均线交易策略是一种双重滤波的趋势跟踪策略。它结合了Heikin Ashi K线的去噪功能和KAMA对趋势变化的快速跟踪优势,能够有效过滤噪声交易、减少错误信号,适合追踪中长期趋势。该策略可以通过参数优化、辅助指标确认等手段进一步增强稳定性和盈利能力。
||
The Heikin Ashi and Kaufman Adaptive Moving Average Trading Strategy (HLC3/Kaufman Strategy) is a quantitative trading strategy that combines Heikin Ashi candles and Kaufman Adaptive Moving Average (KAMA). It uses Heikin Ashi candles to determine trading direction and KAMA as an auxiliary indicator for trade signal filtering.
The main components of this strategy are:
-
Calculate Heikin Ashi open and close prices. These prices reflect the middle price of candle bodies and can filter out some noise.
-
Calculate Kaufman Adaptive Moving Average (KAMA). KAMA can dynamically adjust its smoothness and will not lag too much during sharp market fluctuations.
-
Compare the relationship between Heikin Ashi close and KAMA to determine buy and sell signals. When Heikin Ashi close crosses over KAMA, a buy signal is generated. When Heikin Ashi close crosses below KAMA, a sell signal is generated.
-
Add ADX indicator to judge the strength of the trend to avoid wrong signals in range-bound markets.
The biggest advantage of this strategy is the dual filter of Heikin Ashi candles and KAMA, which can greatly reduce noisy trades and wrong signals. The specific advantages are:
- Heikin Ashi candles themselves have noise reduction capabilities to filter out some short-term fluctuations.
- KAMA is more sensitive than SMA and EMA and can effectively track trend changes at major levels.
- The combination of Heikin Ashi and KAMA dual filters can reduce errors.
- ADX indicator can be configured to determine the strength of the trend to avoid wrong signals.
- Trading signals are direct and easy to operate flexibly.
- Wrong signals may occur in some ranging markets. Parameters should be adjusted accordingly to avoid this risk.
- Overly sensitive parameters can easily chase peaks and kill bottoms. KAMA parameters should be relaxed properly.
- In long-term trending markets, KAMA may lag behind price changes to some extent. ADX should be combined to determine the stability of the trend.
- Optimize Heikin Ashi close and KAMA parameters to find the best filtering conditions.
- Add trend judging indicators such as ADX to ensure trading signals are generated only when the trend is stable.
- Combine other auxiliary indicators such as Bollinger Bands to set stop loss standards.
- Test the stability of parameters on different products to find the optimal parameter combinations.
The Heikin Ashi and Kaufman Adaptive Moving Average Trading Strategy is a dual filter trend tracking strategy. It combines the noise reduction capability of Heikin Ashi candles and KAMA's fast tracking of trend changes to effectively filter out noise trades and reduce wrong signals. It is suitable for tracking medium and long term trends. The strategy can be further enhanced in terms of stability and profitability through parameter optimization, confirmation by auxiliary indicators, etc.
[/trans]
Strategy Arguments
| Argument | Default | Description |
|---|---|---|
| v_input_1 | D | Hlc3 Time Frame |
| v_input_2 | true | Hlc3 Shift |
| v_input_3 | 20 | Slow EMA Period |
| v_input_4 | 5 | Length |
| v_input_5_hlc3 | 0 | xPrice: hlc3 |
| v_input_6 | 2.5 | Fastend |
| v_input_7 | 20 | Slowend |
Source (PineScript)
/*backtest
start: 2022-12-12 00:00:00
end: 2023-12-18 00:00:00
period: 1d
basePeriod: 1h
exchanges: [{"eid":"Futures_Binance","currency":"BTC_USDT"}]
*/

//@version=2
//Heikin/Kaufman   by Marco

strategy("HLC3/Kaufman Strategy ",shorttitle="HLC3/KAU",overlay=true)
res1 = input(title="Hlc3 Time Frame", defval="D")
test = input(1,"Hlc3 Shift")
sloma = input(20,"Slow EMA Period")

//Kaufman MA
Length = input(5, minval=1)
xPrice = input(hlc3)
xvnoise = abs(xPrice - xPrice[1])
Fastend = input(2.5,step=.5)
Slowend = input(20)
nfastend = 2/(Fastend + 1)
nslowend = 2/(Slowend + 1)
nsignal = abs(xPrice - xPrice[Length])
nnoise = sum(xvnoise, Length)
nefratio = iff(nnoise != 0, nsignal / nnoise, 0)
nsmooth = pow(nefratio * (nfastend - nslowend) + nslowend, 2)
nAMA = nz(nAMA[1]) + nsmooth * (xPrice - nz(nAMA[1]))

//Heikin Ashi Open/Close Price
//ha_t = heikinashi(tickerid)
//ha_close = request.security(ha_t, period, nAMA)
//mha_close = request.security(ha_t, res1, hlc3)
bha_close = request.security(syminfo.ticker, timeframe.period, nAMA)
bmha_close = request.security(syminfo.ticker, res1, hlc3)

//Moving Average
//fma = ema(mha_close[test],1)
//sma = ema(ha_close,sloma)
//plot(fma,title="MA",color=black,linewidth=2,style=line)
//plot(sma,title="SMA",color=red,linewidth=2,style=line)
bfma = ema(bmha_close[test],1)
bsma = ema(bha_close,sloma)
plot(bfma,title="MA",color=black,linewidth=2,style=line)
plot(bsma,title="SMA",color=red,linewidth=2,style=line)
//Strategy
//golong =  crossover(fma,sma)
//goshort =   crossunder(fma,sma)
golong =  crossover(bfma,bsma)
goshort =   crossunder(bfma,bsma)
strategy.entry("Buy",strategy.long,when = golong)
strategy.entry("Sell",strategy.short,when = goshort)
Detail
https://www.fmz.com/strategy/435897
Last Modified
2023-12-19 15:51:30
