Name
Bollinger带通道-RSI双线策略Bollinger-Band-RSI-Dual-Line-Strategy
Author
ChaoZhang
Strategy Description
本策略将布林线与相对强弱指标(RSI)相结合,在RSI指标超买超卖的同时,需要对应的突破布林线的上下轨,这样使得本策略的交易信号更加严格和可靠。
- 使用布林线,根据前期n天的收盘价计算出中轨线、上轨线和下轨线。
- 计算RSI指标,判断市场是否过度看涨或看跌。
- 只有当RSI指标显示超买(高于rsi_overbought参数),且价格突破布林线上轨时,做空头交易。
- 只有当RSI指标显示超卖(低于rsi_oversold参数),且价格突破布林线下轨时,做多头交易。
这样,本策略同时利用布林线的通道特征和RSI指标的超买超卖信号,避免单一指标判断错误,更加可靠。
- 综合利用布林线与RSI指标的优势,判断更加严格,避免失误。
- 布林线设定动态通道,能够把握市场波动规律。
- RSI判断超买超卖情况,避免追高杀跌。
- 布林线参数若设定不当,上下轨无法有效包住价格。
- RSI参数若设定不当,无法有效判断真实的超买超卖情况。
- 策略本身无法判断趋势方向,需要搭配其他指标使用。
针对以上风险,应该优化参数,严格测试模型,并辅以其他指标判断大趋势。
- 测试不同周期参数的布林线,找到最佳周期参数。
- 测试不同参数RSI指标,确定较优参数。
- 可以加入移动均线等其他指标判断总体趋势。
本策略成功结合了布林线与RSI指标的优势,在两者同时出现信号时发出交易指令,这样可以有效避免单一指标判断失误的情况,使得交易更加可靠。同时,也要优化参数,严格测试,并辅以其他指标判断大趋势,从而进一步提高策略的稳定性和收益率。
||
This strategy combines Bollinger Bands with the Relative Strength Index (RSI) indicator. It requires signals from both indicators - RSI overbought/oversold together with breakouts of Bollinger Bands upper/lower lines - before issuing any trading signals. This makes the strategy's signals more strict and reliable.
- Calculate Bollinger Bands consisting of middle line, upper line and lower line based on closing prices over a lookback period.
- Compute RSI indicator to judge if the market is overly bullish or bearish.
- Initiate short trade only when RSI shows overbought (higher than rsi_overbought parameter) and price breaks above Bollinger upper line.
- Initiate long trade only when RSI shows oversold (lower than rsi_oversold parameter) and price breaks below Bollinger lower line.
By requiring agreement from both Bollinger Bands and RSI, this strategy avoids acting on misleading signals from a single indicator, hence more reliable.
- Utilizes strengths of both Bollinger Bands and RSI, making signals more strict and avoiding mistakes.
- Bollinger Bands set dynamic channels to capture market volatility patterns.
- RSI gauges overbought/oversold scenarios, preventing chasing peaks or killing dips.
- Improper Bollinger parameters may fail to envelop prices effectively.
- Improper RSI parameters may fail to judge real overbought/oversold conditions accurately.
- Strategy itself cannot determine trend direction, requiring other indicators.
To address the above risks, parameters should be optimized, models strictly tested, and major trends determined with additional indicators.
- Test Bollinger Bands with different lookback periods to find optimal parameters.
- Test different RSI parameters to determine relatively better settings.
- Add other indicators like moving averages to determine overall trend.
This strategy successfully combines the strengths of Bollinger Bands and RSI, issuing trading signals only when both indicators agree. This avoids acting on misleading signals from any single indicator, making trades more reliable. Nonetheless, parameters should be optimized, models strictly tested, and major trends determined with other indicators, to further enhance the strategy's stability and profitability.
[/trans]
Strategy Arguments
| Argument | Default | Description |
|---|---|---|
| v_input_1 | 6 | RSI Period Length |
| v_input_2 | 200 | Bollinger Period Length |
| v_input_3 | true | Enable Bar Color? |
| v_input_4 | true | Enable Background Color? |
Source (PineScript)
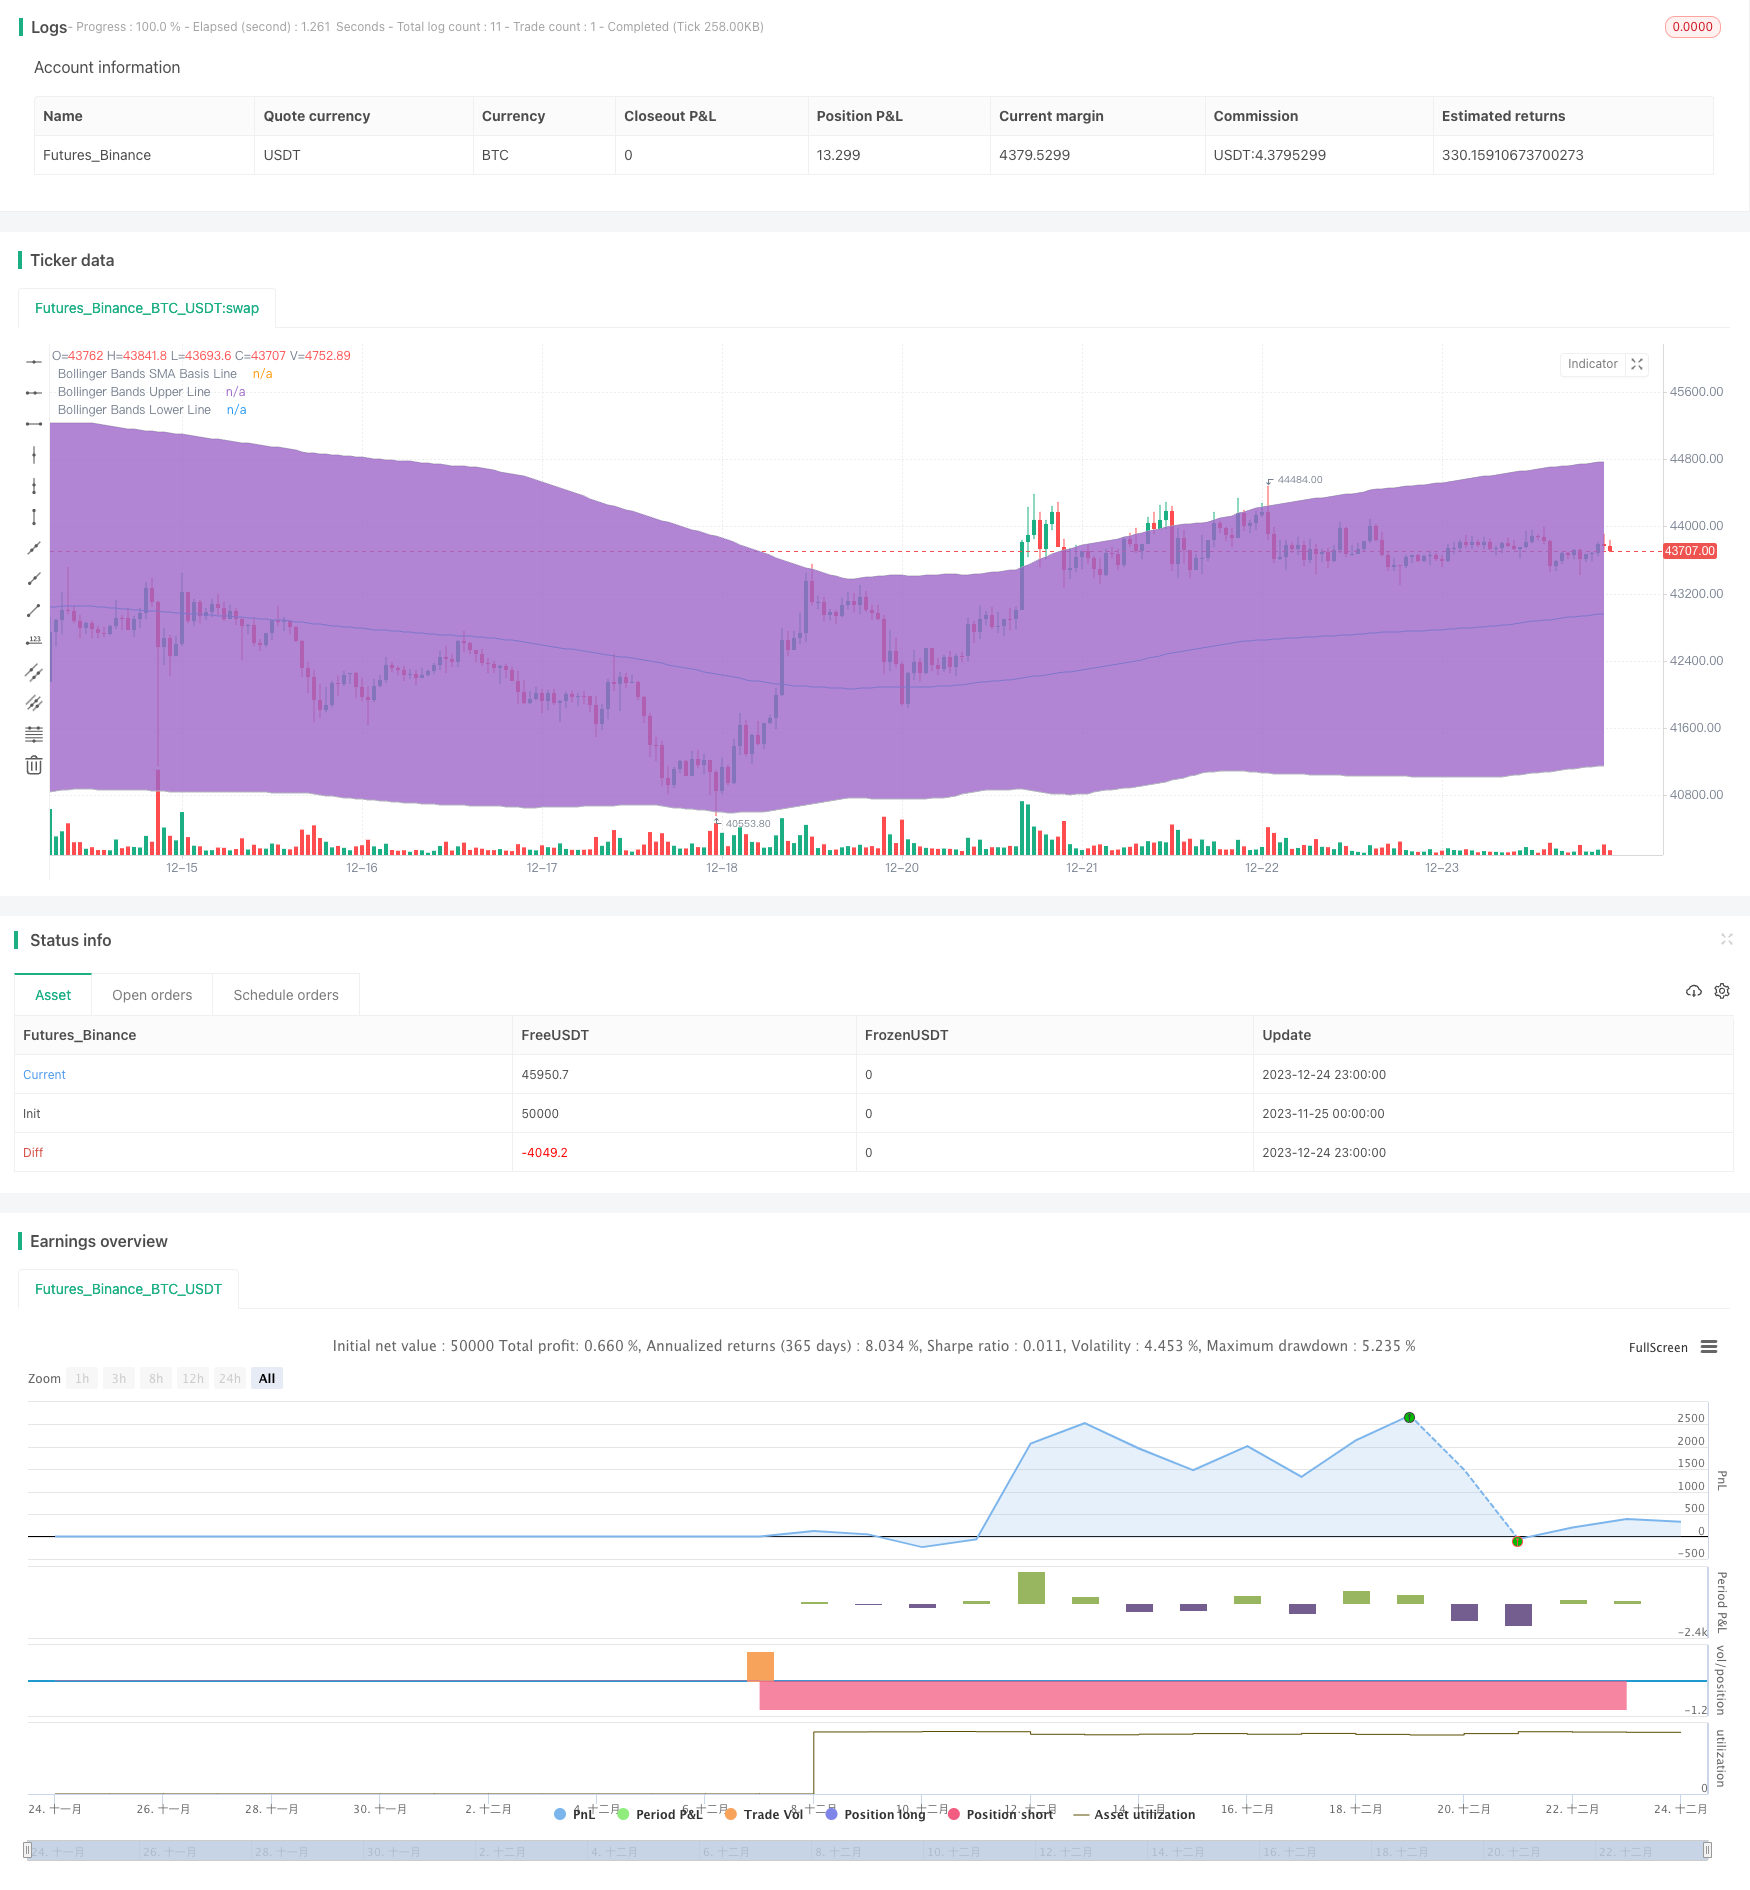
/*backtest
start: 2023-11-25 00:00:00
end: 2023-12-25 00:00:00
period: 1h
basePeriod: 15m
exchanges: [{"eid":"Futures_Binance","currency":"BTC_USDT"}]
*/

//@version=2
strategy("Bollinger + RSI, Double Strategy (by ChartArt) v1.1", shorttitle="CA_-_RSI_Bol_Strat_1.1", overlay=true)

// ChartArt's RSI + Bollinger Bands, Double Strategy - Update
//
// Version 1.1
// Idea by ChartArt on January 18, 2015.
//
// This strategy uses the RSI indicator
// together with the Bollinger Bands
// to sell when the price is above the
// upper Bollinger Band (and to buy when
// this value is below the lower band).
//
// This simple strategy only triggers when
// both the RSI and the Bollinger Bands
// indicators are at the same time in
// a overbought or oversold condition.
//
// In this version 1.1 the strategy was
// both simplified for the user and
// made more successful in backtesting.
//
// List of my work:
// https://www.tradingview.com/u/ChartArt/
//
//  __             __  ___       __  ___
// /  ` |__|  /\  |__)  |   /\  |__)  |
// \__, |  | /~~\ |  \  |  /~~\ |  \  |
//
//


///////////// RSI
RSIlength = input(6,title="RSI Period Length")
RSIoverSold = 50
RSIoverBought = 50
price = close
vrsi = rsi(price, RSIlength)


///////////// Bollinger Bands
BBlength = input(200, minval=1,title="Bollinger Period Length")
BBmult = 2 // input(2.0, minval=0.001, maxval=50,title="Bollinger Bands Standard Deviation")
BBbasis = sma(price, BBlength)
BBdev = BBmult * stdev(price, BBlength)
BBupper = BBbasis + BBdev
BBlower = BBbasis - BBdev
source = close
buyEntry = crossover(source, BBlower)
sellEntry = crossunder(source, BBupper)
plot(BBbasis, color=aqua,title="Bollinger Bands SMA Basis Line")
p1 = plot(BBupper, color=silver,title="Bollinger Bands Upper Line")
p2 = plot(BBlower, color=silver,title="Bollinger Bands Lower Line")
fill(p1, p2)


///////////// Colors
switch1=input(true, title="Enable Bar Color?")
switch2=input(true, title="Enable Background Color?")
TrendColor = RSIoverBought and (price[1] > BBupper and price < BBupper) and BBbasis < BBbasis[1] ? red : RSIoverSold and (price[1] < BBlower and price > BBlower) and BBbasis > BBbasis[1] ? green : na
barcolor(switch1?TrendColor:na)
bgcolor(switch2?TrendColor:na,transp=50)


///////////// RSI + Bollinger Bands Strategy
if (not na(vrsi))

    if (crossover(vrsi, RSIoverSold) and crossover(source, BBlower))
        strategy.entry("RSI_BB_L", strategy.long, stop=BBlower,  comment="RSI_BB_L")
    else
        strategy.cancel(id="RSI_BB_L")

    if (crossunder(vrsi, RSIoverBought) and crossunder(source, BBupper))
        strategy.entry("RSI_BB_S", strategy.short, stop=BBupper,  comment="RSI_BB_S")
    else
        strategy.cancel(id="RSI_BB_S")

//plot(strategy.equity, title="equity", color=red, linewidth=2, style=areabr)
Detail
https://www.fmz.com/strategy/436643
Last Modified
2023-12-26 15:30:26