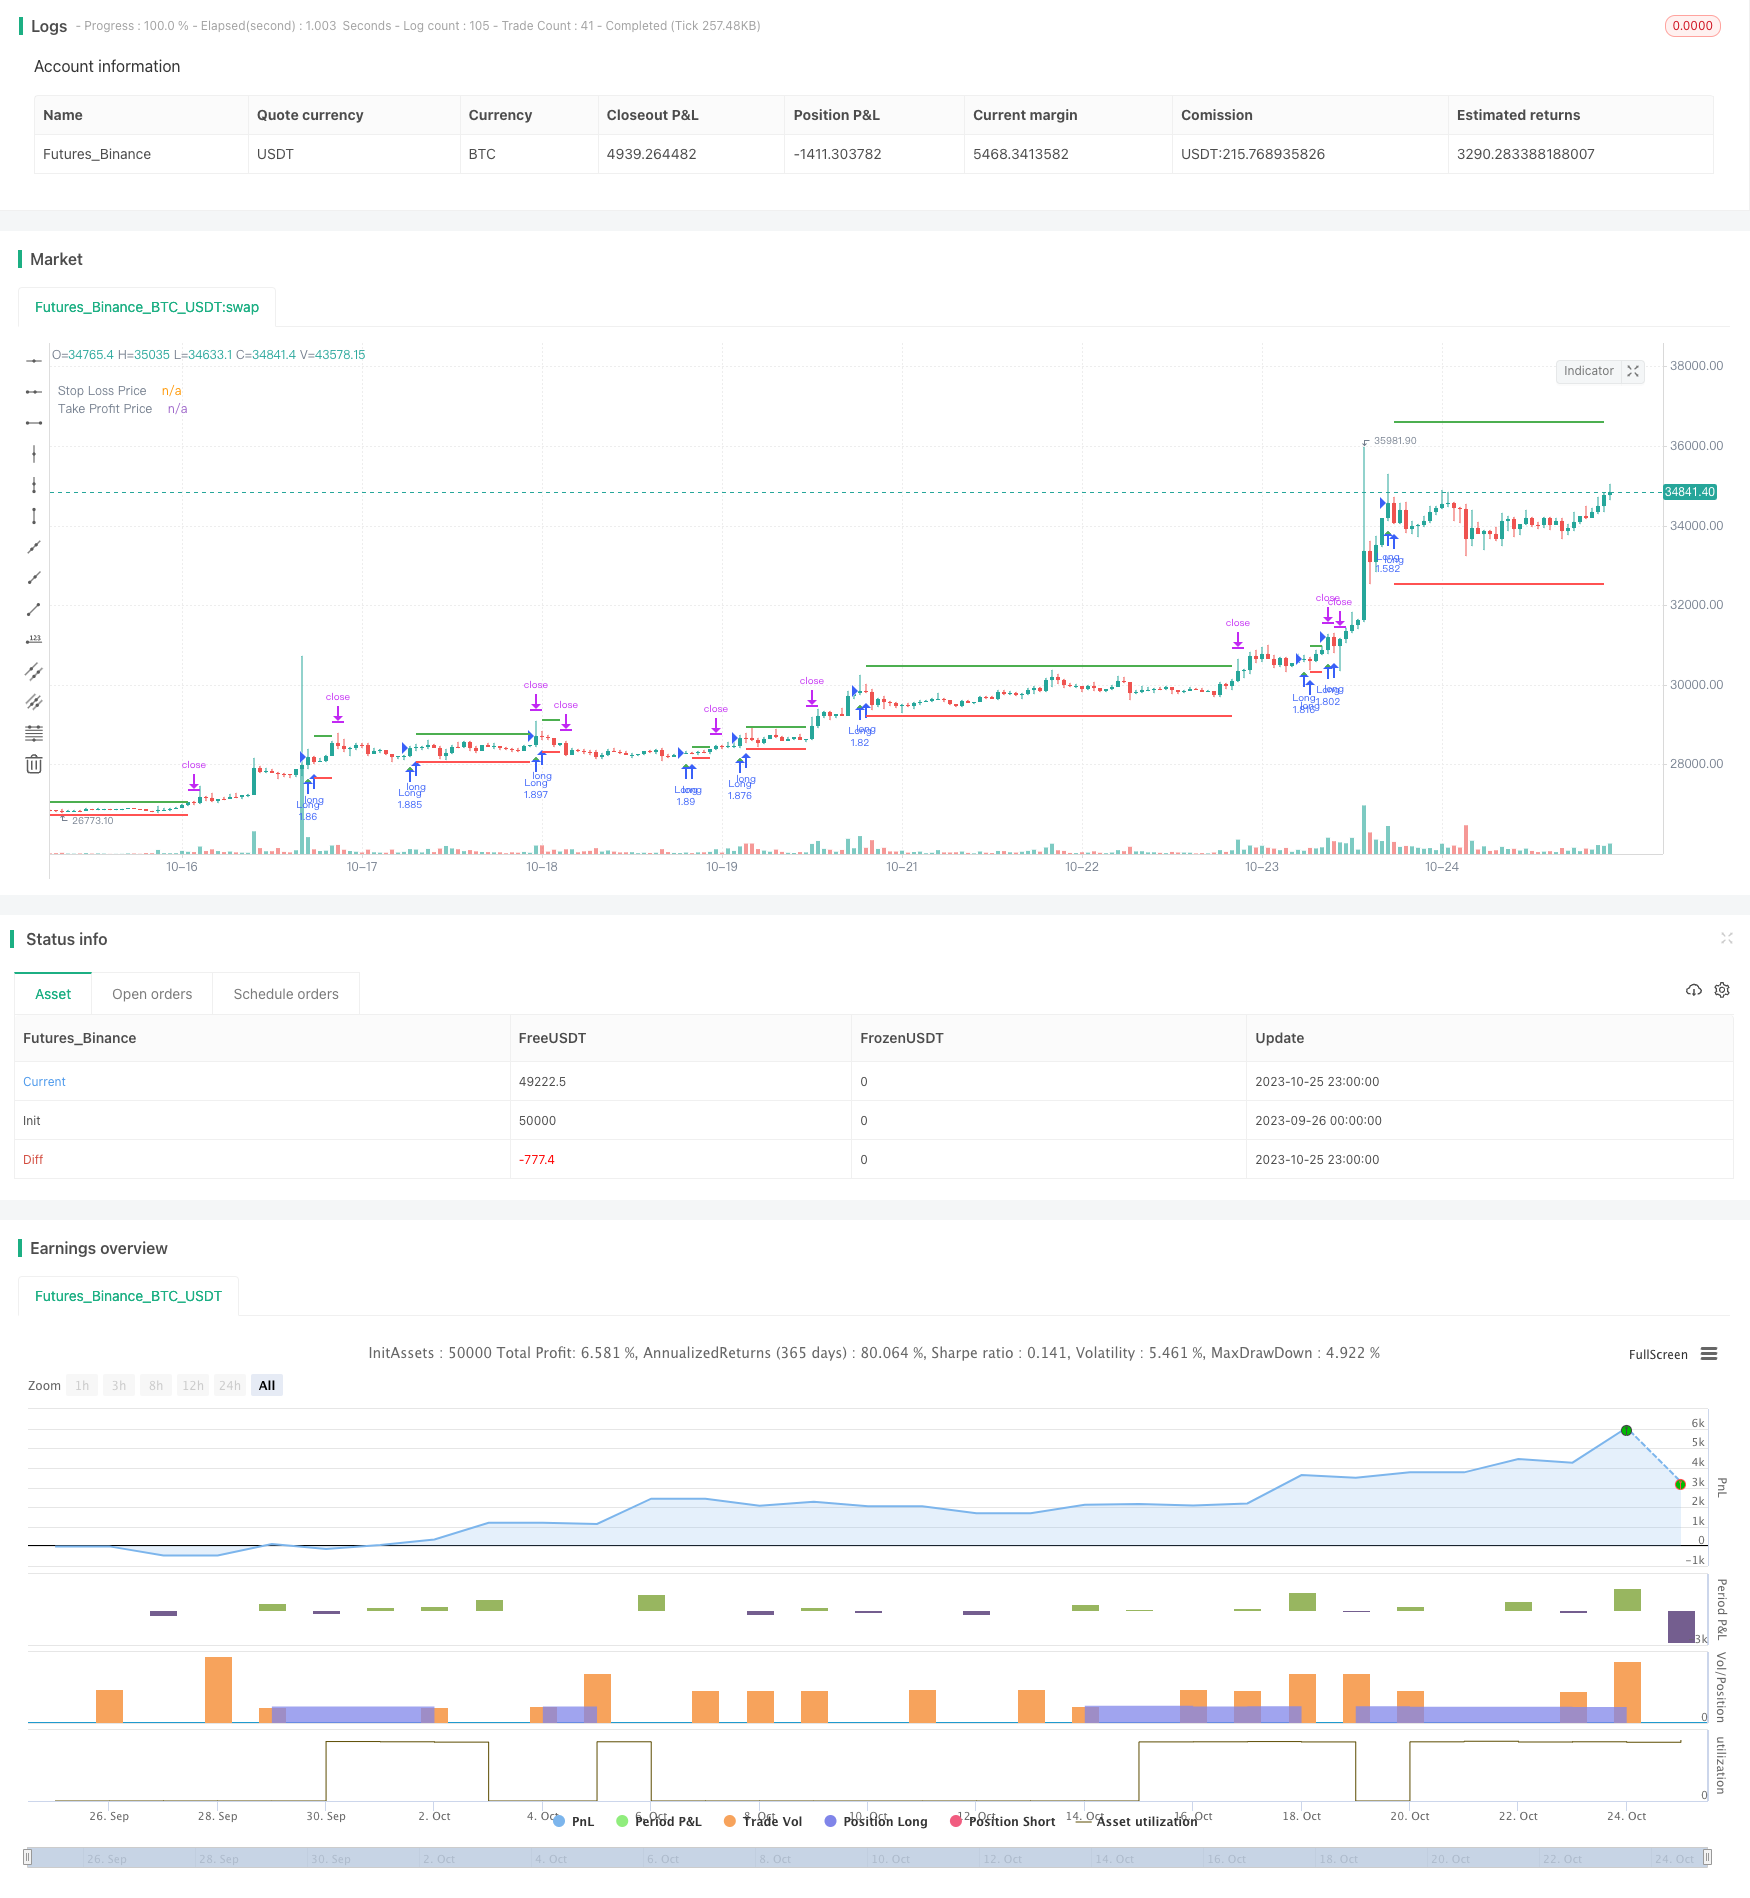
Name
1-3-1-红绿K线反转策略1-3-1-Red-Green-Candlestick-Reversal-Strategy
Author
ChaoZhang
Strategy Description
[trans]
1-3-1 红绿K线反转策略是一种根据K线形态进行买卖信号判断的策略。该策略通过观察1根红色K线是否被3根绿色K线反转来寻找买入机会。
该策略的核心逻辑是:
- 判断当前K线是否为红色K线,即收盘价低于开盘价
- 判断之前3根K线是否都是绿色K线,即收盘价高于开盘价
- 判断最后1根绿色K线的收盘价是否高于前2根绿色K线
- 如果满足上述条件,则在红色K线收盘时以市价买入
- 止损价设为红色K线的最低价
- 止盈价设为入场价加上入场价到止损价的距离
通过这个策略,我们可以在红色K线被反转的情况下买入,因为之后的趋势很可能是上涨的。同时设置止损和止盈来控制风险和锁定盈利。
1-3-1 红绿K线反转策略具有以下优势:
- 策略逻辑简单清晰,容易理解和实现
- 利用K线形态特征,不依赖任何指标,避免因过度优化产生的问题
- 有明确的入场和出场规则,可以客观执行
- 设置止损和止盈,可以控制每单交易的风险收益比
- 回测结果良好,具有较强的实盘调整可能性
该策略也存在一些风险需要注意:
- K线形态无法百分百预测未来趋势,存在一定的不确定性
- 只买入一次,容易因个股特殊性导致胜率不高
- 没有考虑大盘走势,在大盘持续下跌时持有风险较大
- 没有设置交易费用和滑点,实盘效果可能会差一些
对策:
- 可以考虑结合均线等指标过滤信号,提高买入的成功率
- 调整仓位管理,分批建仓
- 根据大盘情况动态调整止损位置或暂停交易
- 测试不同的止损止盈比例设置
- 测试加入交易成本后的实盘效果
该策略可以从以下几个方面进行优化:
-
基于大盘指数的过滤。可以根据大盘的短期和中期趋势来过滤交易信号,在大盘上涨时买入,大盘下跌时停止交易。
-
考虑成交量的确认。增加对绿色K线成交量的判断,仅在成交量有所放大时才买入。
-
优化止损止盈比例。可以测试不同的止损止盈比例,找到最优参数组合。也可以设置动态止损或移动止损。
-
仓位管理优化。可以分批建仓,后续在条件满足时加仓,降低单次交易的风险。
-
加入更多过滤条件。比如考虑均线、波动率等指标,确保在趋势更加明确时买入。
-
大数据训练寻找最优参数。收集大量历史数据,使用机器学习等技术训练最优的参数阈值。
1-3-1 红绿K线反转策略整体来说是一个简单实用的短线交易策略。它有明确的入场退出规则,回测效果良好。我们可以通过一些优化措施来提高它的实盘效果,使之成为一个可靠的量化交易策略。同时也需要注意风险控制,妥善管理资金。
||
The 1-3-1 red green candlestick reversal strategy is a strategy that generates buy and sell signals based on candlestick patterns. It looks for buying opportunities when 1 red candlestick is reversed by 3 subsequent green candlesticks.
The core logic of this strategy is:
- Check if the current candlestick is a red candle, i.e. the close price is lower than the open price
- Check if the previous 3 candlesticks are green candles, i.e. close price is higher than open price
- Check if the last green candle's close price is higher than the previous 2 green candles
- If the above conditions are met, go long at the close of the red candle
- Set stop loss at the lowest price of the red candle
- Set take profit at entry price plus the distance from entry to stop loss
With this strategy, we can buy when the red candle is reversed, because the subsequent trend is likely to be upwards. Stop loss and take profit are set to control risk and lock in profits.
The 1-3-1 red green reversal strategy has the following advantages:
- Simple and clear logic, easy to understand and implement
- Utilizes candlestick pattern features without reliance on indicators, avoiding overoptimization problems
- Has clear entry and exit rules for objective execution
- Sets stop loss and take profit to control risk/reward of each trade
- Good backtest results, likely to translate well to live trading
Some risks to note for this strategy:
- Candlestick patterns cannot perfectly predict future moves, some uncertainty exists
- Only one entry, may have lower win rate due to stock specifics
- No consideration of market trend, risk holding during sustained downtrend
- Does not account for trading costs and slippage, actual performance may be worse
Solutions:
- Consider combining with MA etc to filter signals and improve entry success rate
- Adjust position sizing, scale in across multiple entries
- Dynamically adjust stop loss based on market conditions or pause trading
- Test different stop loss/take profit ratios
- Test actual performance including trading costs
Some ways this strategy can be optimized:
-
Market index filtering - filter signals based on short/medium term market trend, go long in uptrend and stop trading in downtrend
-
Volume confirmation - only go long if green candle volumes increase
-
Optimize stop loss/take profit ratios - test different ratios to find optimal parameters
-
Position sizing optimization - scale in across multiple entries to reduce single trade risk
-
Add more filters - e.g. MA, volatility etc to ensure high probability entry
-
Machine learning on big data - collect lots of historical data and train optimal parameter thresholds via ML
The 1-3-1 red green reversal strategy is overall a simple and practical short term trading strategy. It has clear entry and exit rules and good backtest results. With some optimization measures, it can become a reliable quant trading strategy. Risk management is also important to manage capital properly.
[/trans]
Source (PineScript)
/*backtest
start: 2023-09-26 00:00:00
end: 2023-10-26 00:00:00
period: 1h
basePeriod: 15m
exchanges: [{"eid":"Futures_Binance","currency":"BTC_USDT"}]
*/

//@version=5
//by Genma01
strategy("Stratégie tradosaure 1 Bougie Rouge suivi de 3 Bougies Vertes", overlay=true, default_qty_type = strategy.percent_of_equity,  default_qty_value = 100)

// Définir les paramètres
var float stopLossPrice = na
var float takeProfitPrice = na
var float stopLossPriceD = na
var float takeProfitPriceD = na

// Vérifier les conditions
redCandle = close[3] < open[3] and low[3] < low[2] and low[3] < low[1] and low[3] < low[0]
greenCandles = close > open and close[1] > open[1] and close[2] > open[2]
higherClose = close > close[1] and close[1] > close[2]

// Calcul du stop-loss
if (redCandle and greenCandles and higherClose) and strategy.position_size == 0
    stopLossPrice := low[3]

// Calcul du take-profit
if (not na(stopLossPrice))  and strategy.position_size == 0
    takeProfitPrice := close + (close - stopLossPrice)

// Entrée en position long
if (redCandle and greenCandles and higherClose)  and strategy.position_size == 0
    strategy.entry("Long", strategy.long)

// Sortie de la position
if (not na(stopLossPrice))  and strategy.position_size > 0
    strategy.exit("Take Profit/Stop Loss", stop=stopLossPrice, limit=takeProfitPrice)

if strategy.position_size == 0
    stopLossPriceD := na
    takeProfitPriceD := na
else
    stopLossPriceD := stopLossPrice
    takeProfitPriceD := takeProfitPrice


// Tracer le stop-loss et le take-profit sur le graphique
plotshape(series=redCandle and greenCandles and higherClose and strategy.position_size == 0, title="Conditions Remplies", location=location.belowbar, color=color.green, style=shape.triangleup, size=size.small)
plotshape(series=redCandle and greenCandles and higherClose and strategy.position_size == 0, title="Conditions Remplies", location=location.belowbar, color=color.green, style=shape.triangleup, size=size.small)


// Afficher les prix du stop-loss et du take-profit
plot(stopLossPriceD, color=color.red, title="Stop Loss Price", linewidth=2, style = plot.style_linebr)
plot(takeProfitPriceD, color=color.green, title="Take Profit Price", linewidth=2, style = plot.style_linebr)
Detail
https://www.fmz.com/strategy/430364
Last Modified
2023-10-27 16:00:41
