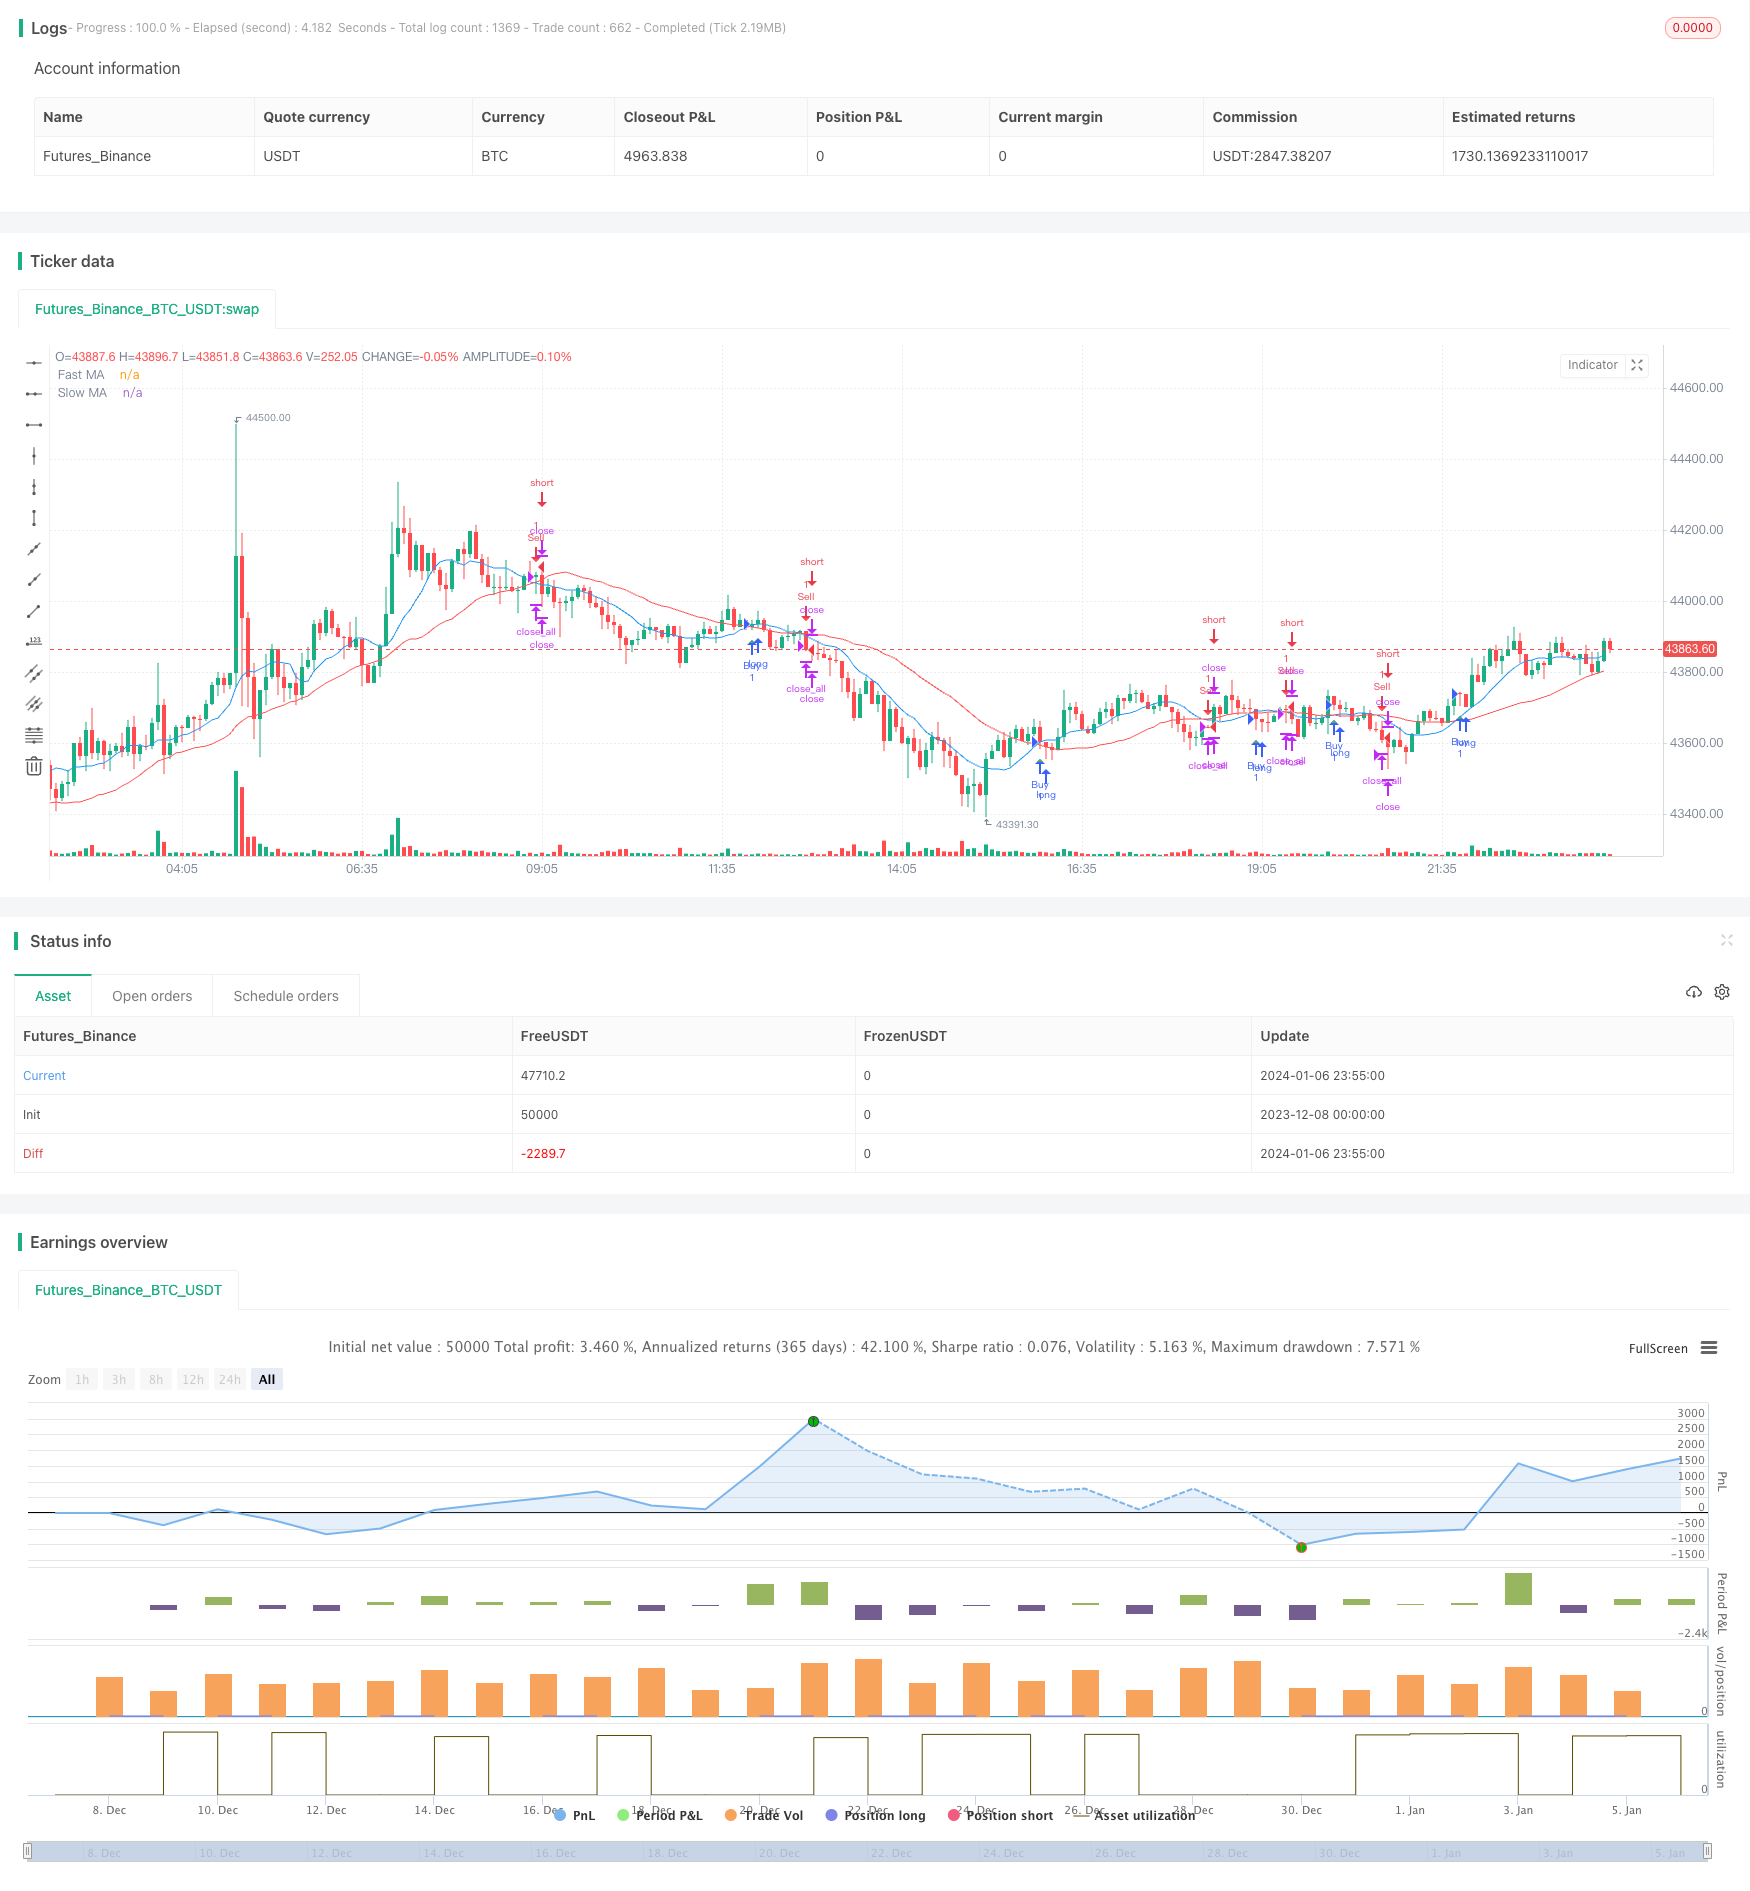
Name
黄金交叉均线突破策略Crude-Oil-Moving-Average-Crossover-Strategy
Author
ChaoZhang
Strategy Description
该策略运用两个不同参数的移动平均线,快速移动平均线和慢速移动平均线。当快速移动平均线从下方上穿慢速移动平均线时,产生买入信号;当快速移动平均线从上方下穿慢速移动平均线时,产生卖出信号。同时,如果慢速移动平均线从下方上穿快速移动平均线,也会产生卖出信号,平仓所有头寸。
该策略的核心逻辑基于移动平均线的黄金交叉原理。所谓的黄金交叉是指短期移动平均线上穿长期移动平均线,被视为市场行情反转的信号,通常预示着股价上涨。而死亡交叉则是短期移动平均线下穿长期移动平均线,预示着股价下跌。
具体来说,该策略定义了两个移动平均线,快速移动平均线长度为10天,慢速移动平均线长度为30天。在每根K线结束的时候,计算这两个移动平均线的值。如果发生快速移动平均线上穿慢速移动平均线的情况,就生成买入信号;如果发生快速移动平均线下穿慢速移动平均线的情况,就生成卖出信号。
为了及时止损,如果发生慢速移动平均线上穿快速移动平均线的情况,也会生成卖出信号,直接平仓所有头寸。
该策略具有以下优势:
-
使用了移动平均线的黄金交叉理论,这是一种简单有效的技术指标交易策略。
-
快速移动平均线参数为10天,能够快速响应价格变动;慢速移动平均线参数为30天,能够有效过滤市场噪音。
-
策略加入了止损机制,如果发生不利形态,会快速止损,有效控制风险。
-
该策略逻辑简单,容易理解和实现,适合量化交易的自动执行。
-
指标参数可以灵活调整,用于适应不同品种的交易。
尽管该策略具有明显的优势,但也存在一定的风险需要注意:
-
如果行情出现长期趋势市场,该策略可能会产生频繁的错误信号。可以通过调整移动平均线参数来优化。
-
移动平均线本身具有滞后的特点,可能导致信号产生有些滞后。
-
单一指标策略容易受到误导,应该结合其他因素来决定最终的入场。
-
停损点设置得不当可能造成不必要的损失。应该针对不同品种设置合理的止损位置。
该策略还有进一步优化的空间:
-
可以测试更多组合的参数,找到最佳的快速移动平均线和慢速移动平均线的长度。
-
可以加入其它指标的确认,例如交易量,布林带等,以提高信号的准确性。
-
可以根据市场行情的不同状态使用自适应移动平均线,实时优化参数。
-
可以设立滑点控制,避免高波动时的不必要滑点损失。
-
可以加入自动止损策略,根据ATR动态设置止损位。
本策略运用简单的双移动平均线黄金交叉理论,为量化交易提供了一套简单实用的技术指标交易策略。该策略易于理解和实现,经过参数优化可以适用于不同品种和行情环境,值得量化投资者关注和测试。
总的来说,移动平均线策略具有概率优势,配合严格的风险控制,具有长期盈利的可能。但交易者也需要意识到其局限性,在使用时应该灵活应用,并辅以其他分析工具。
||
This strategy utilizes two moving averages with different parameters, a faster moving average and a slower moving average. When the faster moving average crosses above the slower moving average, a buy signal is generated. When the faster moving average crosses below the slower moving average, a sell signal is generated. Additionally, a sell signal is generated if the slower moving average crosses above the faster moving average.
The core logic of this strategy is based on the golden cross theory of moving averages. The so-called golden cross refers to the fast moving average crossing above the slow moving average, which is regarded as a signal of market reversal and usually indicates upward movement in price. The death cross, on the other hand, refers to the fast moving average crossing below the slow moving average, indicating downward price movement.
Specifically, this strategy defines two moving averages - a fast moving average with length 10 days and a slow moving average with length 30 days. At the end of each candlestick bar, the values of these two moving averages are calculated. If the fast moving average crosses above the slow moving average, a buy signal is generated. If the fast moving average crosses below the slow moving average, a sell signal is generated.
To cut losses in a timely manner, if the slow moving average crosses above the fast moving average, a sell signal is also generated to close all positions directly.
This strategy has the following advantages:
-
It utilizes the golden cross theory of moving averages, which is a simple and effective technical indicator trading strategy.
-
The fast moving average has a parameter of 10 days, which can respond quickly to price changes. The slow moving average has a parameter of 30 days which can filter out market noise effectively.
-
The strategy incorporates a stop loss mechanism which cuts losses fast when unfavorable patterns emerge, effectively controlling risks.
-
The strategy logic is simple to understand and implement, suitable for automated execution in quantitative trading.
-
Indicator parameters can be adjusted flexibly for trading different products.
While the strategy has obvious advantages, there are also certain risks to be aware of:
-
If prolonged trending occurs in the market, it may generate frequent false signals. This can be optimized by adjusting moving average parameters.
-
Moving averages themselves have a lagging nature, which may cause some lag in signal generation.
-
Single indicator strategies are easily misguided and should be combined with other factors to determine final entry.
-
Improper stop loss positioning may lead to unnecessary losses. Reasonable stop loss levels should be set for different products.
There is room for further optimization of this strategy:
-
More parameter combinations can be tested to find the optimal lengths for fast and slow moving averages.
-
Confirmation from other indicators like volume, Bollinger bands etc. can be added to improve signal accuracy.
-
Adaptive moving averages can be used to optimize parameters dynamically based on varying market conditions.
-
Slippage control can be implemented to avoid unnecessary slippage loss in times of high volatility.
-
A dynamic stop loss strategy can be added based on ATR to set stops.
This strategy utilizes the simple double moving average golden cross theory to provide a simple and practical technical indicator trading strategy for quantitative trading. It is easy to understand and implement, and can be applied to different products and market environments after parameter optimization, making it worthwhile for quantitative investors to pay attention to and test.
Overall, moving average strategies have a probability edge, and with strict risk control, can be profitable in the long run. But traders also need to be aware of its limitations, apply it flexibly, and complement it with other analysis tools.
[/trans]
Strategy Arguments
| Argument | Default | Description |
|---|---|---|
| v_input_1 | 10 | Fast Length |
| v_input_2 | 30 | Slow Length |
Source (PineScript)
/*backtest
start: 2023-12-08 00:00:00
end: 2024-01-07 00:00:00
period: 5m
basePeriod: 1m
exchanges: [{"eid":"Futures_Binance","currency":"BTC_USDT"}]
*/

//@version=5
strategy("Crude Oil Moving Average Crossover", overlay=true)

// Define inputs
fastLength = input(10, "Fast Length")
slowLength = input(30, "Slow Length")

// Calculate moving averages
fastMA = ta.sma(close, fastLength)
slowMA = ta.sma(close, slowLength)

// Plot moving averages
plot(fastMA, color=color.blue, title="Fast MA")
plot(slowMA, color=color.red, title="Slow MA")

// Entry conditions
longCondition = ta.crossover(fastMA, slowMA)
shortCondition = ta.crossunder(fastMA, slowMA)

// Exit conditions
exitCondition = ta.crossover(slowMA, fastMA)

// Execute strategy
if longCondition
    strategy.entry("Buy", strategy.long)
if shortCondition
    strategy.entry("Sell", strategy.short)
if exitCondition
    strategy.close_all()

// Plot buy and sell signals
plotshape(longCondition, title="Buy Signal", location=location.belowbar, color=color.green, style=shape.triangleup, size=size.small)
plotshape(shortCondition, title="Sell Signal", location=location.abovebar, color=color.red, style=shape.triangledown, size=size.small)
Detail
https://www.fmz.com/strategy/438010
Last Modified
2024-01-08 10:25:00
