Name
随机Fisher变换临时停止反转STOCH指标量化策略Random-Fisher-Transform-Temporary-Stop-Reverse-STOCH-Indicator-Quantitative-Strategy
Author
ChaoZhang
Strategy Description
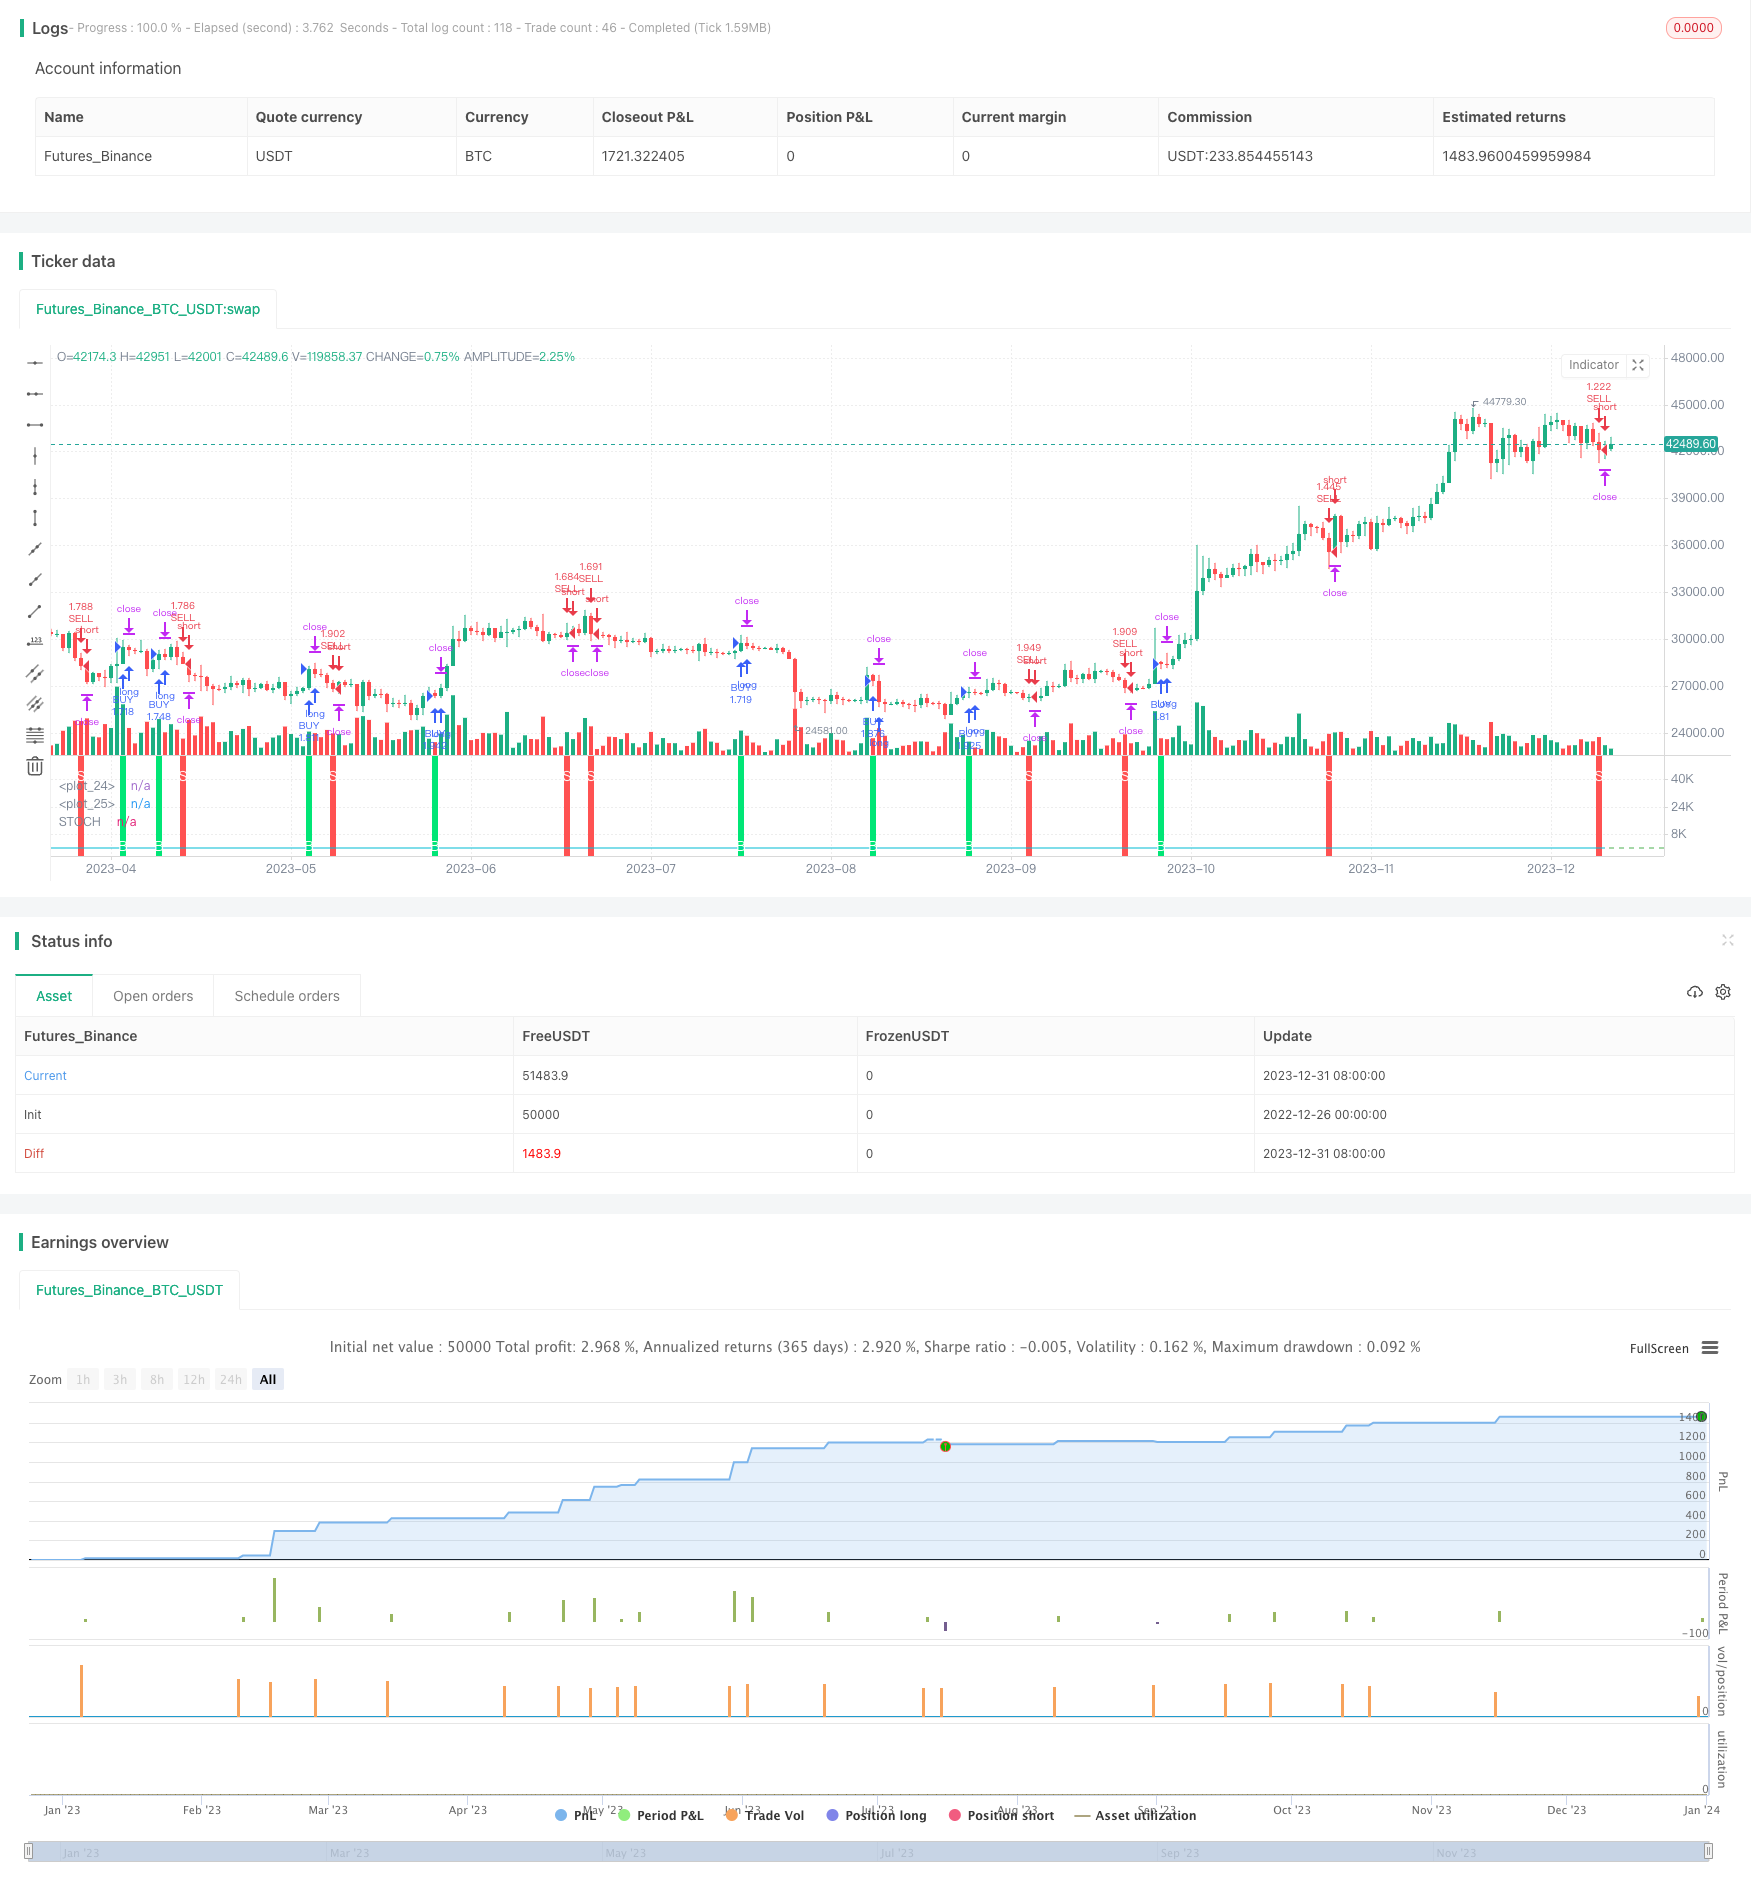
本策略的核心思想是结合随机Fisher变换和临时停止反转STOCH指标来做出买卖决策。该策略适用于中短期操作,能在平稳行情中获得不错的收益。
本策略首先计算标准的STOCH指标,然后对其进行Fisher变换得到INVLine。当INVLine上穿过下行阈值线dl时,产生买入信号;当INVLine下穿过上行阈值线ul时,产生卖出信号。同时,该策略还设置了追踪止损机制,以锁定利润和减少损失。
具体来说,该策略的核心逻辑是:
- 计算STOCH指标:采用标准公式,计算stock的快速STOCH值
- Fisher变换:对STOCH值进行Fisher变换,得到INVLine
- 产生交易信号:INVLine上穿dl线时买入,下穿ul线时卖出
- 追踪止损:启用临时停止追踪机制,以便及时止损
本策略主要具有以下优势:
- Fisher变换有效提高了STOCH指标的灵敏度,能更早发现趋势反转机会
- 临时停止追踪机制能够有效控制风险,锁定利润
- 适合中短期操作,特别是最近比较流行的快速量化交易
- 在平稳行情中表现较好,收益稳定
本策略也存在一些风险:
- STOCH指标容易产生假信号,可能导致不必要的交易
- Fisher变换也会放大STOCH指标的噪音,带来更多假信号
- 在震荡行情中容易止损退出,无法持续盈利
- 需要较短的持仓期才能获得Alpha,不适合持仓太久
为降低这些风险,可以考虑优化以下几个方面:
- 调整STOCH参数,平滑曲线,减少噪音
- 优化阈值线的位置,降低误交易概率
- 增加过滤条件,避免在震荡行情中交易
- 调整持仓的时间长度,与操作周期相匹配
本策略主要可以从以下几个方向进行优化:
- 优化Fisher变换的参数,平滑INVLine曲线
- 优化STOCH指标的长度period,寻找最佳参数组合
- 优化阈值线的参数,降低误交易概率
- 增加量价确认,避免不必要的追踪止损
- 增加日内突破过滤,减少震荡市假信号
- 结合趋势指标,避免逆势交易
本策略综合运用随机Fisher变换和STOCH指标,实现了一个简单实用的短线量化策略。其优势在于操作频率高,适合最近比较流行的高频量化交易。同时,该策略也存在一些普遍的技术指标策略风险,需要对参数和过滤条件进行优化,降低风险,提高稳定性。总的来说,本策略为简单的量化交易提供了一个不错的思路,值得进一步深入研究。
||
The core idea of this strategy is to combine the Random Fisher Transform and the Temporary Stop Reverse STOCH indicator to make buy and sell decisions. This strategy is suitable for medium-term operations and can generate decent returns in stable market conditions.
This strategy first calculates the standard STOCH indicator, then performs a Fisher transform on it to obtain INVLine. When INVLine crosses above the lower threshold dl, a buy signal is generated. When INVLine crosses below the upper threshold ul, a sell signal is generated. At the same time, this strategy also sets a trailing stop mechanism to lock in profits and reduce losses.
Specifically, the core logic of this strategy is:
- Calculate the STOCH indicator: Use the standard formula to calculate the fast STOCH value of stock
- Fisher transform: Perform a Fisher transform on the STOCH value to obtain INVLine
- Generate trading signals: Buy when INVLine crosses above dl, sell when crossing below ul
- Trailing stop: Enable a temporary stop tracking mechanism for timely stop loss
The main advantages of this strategy are:
- The Fisher transform effectively improves the sensitivity of the STOCH indicator and can detect trend reversal opportunities earlier
- The temporary trailing stop mechanism can effectively control risks and lock in profits
- It is suitable for medium-term operations, especially the currently popular high-frequency quantitative trading
- It performs well in stable market conditions with steady returns
This strategy also has some risks:
- The STOCH indicator is prone to generating false signals, which may cause unnecessary trading
- The Fisher transform also amplifies the noise of the STOCH indicator, resulting in more false signals
- It is easy to stop loss in oscillating markets and fail to make sustainable profits
- Relatively short holding periods are required to obtain Alpha. Long holdings are not suitable
To mitigate these risks, consider optimizing the following aspects:
- Adjust STOCH parameters to smooth the curve and reduce noise
- Optimize threshold line positions to reduce false trading probabilities
- Add filter conditions to avoid trading in oscillating markets
- Adjust holding time length to match operating cycle
The main directions for optimizing this strategy include:
- Optimize parameters of Fisher transform to smooth INVLine curve
- Optimize STOCH period length to find optimal parameter combinations
- Optimize threshold line parameters to reduce false trading probabilities
- Add volume price confirmation to avoid unnecessary trailing stop
- Add intraday breakout filters to reduce false signals in oscillating markets
- Incorporate trend indicators to avoid counter trend trading
This strategy combines the Random Fisher Transform and the STOCH indicator to implement a simple and practical short-term quantitative strategy. Its advantage lies in the high operation frequency, which is suitable for the currently popular high-frequency quantitative trading. At the same time, this strategy also has some common technical indicator strategy risks. Parameters and filter conditions need to be optimized to reduce risks and improve stability. In general, this strategy provides a good idea for simple quantitative trading and is worth further in-depth research.
[/trans]
Strategy Arguments
| Argument | Default | Description |
|---|---|---|
| v_input_1 | 19 | STOCH Length |
| v_input_2 | 4 | Smooth |
| v_input_3 | 0.64 | UP line |
| v_input_4 | -0.62 | DOWN line |
| v_input_5 | true | Use trailing stop |
| v_input_6 | 245 | trailing stop actiation pips |
| v_input_7 | 20 | trailing stop offset pips |
Source (PineScript)
/*backtest
start: 2022-12-26 00:00:00
end: 2024-01-01 00:00:00
period: 1d
basePeriod: 1h
exchanges: [{"eid":"Futures_Binance","currency":"BTC_USDT"}]
*/

//@version=3
strategy("IFT Stochastic + Trailing Stop", overlay=false, pyramiding = 0, calc_on_order_fills = false, commission_type =  strategy.commission.percent, commission_value = 0.0454, default_qty_type = strategy.percent_of_equity, default_qty_value = 100)

//INPUTS
stochlength=input(19, "STOCH Length")
wmalength=input(4, title="Smooth")
ul = input(0.64,step=0.01, title="UP line")
dl = input(-0.62,step=0.01, title="DOWN line")
uts = input(true, title="Use trailing stop")
tsi = input(title="trailing stop actiation pips",defval=245)
tso = input(title="trailing stop offset pips",defval=20)

//CALCULATIONS
v1=0.1*(stoch(close, high, low, stochlength)-50)
v2=wma(v1, wmalength)
INVLine=(exp(2*v2)-1)/(exp(2*v2)+1)

//CONDITIONS
sell = crossunder(INVLine,ul)? 1 : 0
buy = crossover(INVLine,dl)? 1 : 0

//PLOTS
plot(INVLine, color=aqua, linewidth=1, title="STOCH")
hline(ul, color=red)
hline(dl, color=green)
bgcolor(sell==1? red : na, transp=30, title = "sell signal")
bgcolor(buy==1? lime : na, transp=30, title = "buy signal")
plotchar(buy==1, title="Buy Signal", char='B', location=location.bottom, color=white, transp=0, offset=0)
plotchar(sell==1, title="Sell Signal", char='S', location=location.top, color=white, transp=0, offset=0)

//STRATEGY
strategy.entry("BUY", strategy.long, when = buy==1)
strategy.entry("SELL", strategy.short, when = sell==1)

if  (uts)
    strategy.entry("BUY", strategy.long, when = buy)
    strategy.entry("SELL", strategy.short, when = sell)
    strategy.exit("Close BUY with TS","BUY", trail_points = tsi, trail_offset = tso)
    strategy.exit("Close SELL with TS","SELL", trail_points = tsi, trail_offset = tso)
Detail
https://www.fmz.com/strategy/437390
Last Modified
2024-01-02 11:14:12
