Name
阴阳吊颈线策略Yin-Yang-Hanging-Man-Strategy
Author
ChaoZhang
Strategy Description
阴阳吊颈线策略是一种基于吊颈线形态的量化交易策略。该策略通过识别蜡烛线图中的阴阳吊颈线形态来产生交易信号。当识别到吊颈线形态时,如果是阳线吊颈,则产生买入信号;如果是阴线吊颈,则产生卖出信号。
阴阳吊颈线策略的核心识别条件是蜡烛线体较小而上下影线较长的吊颈线形态。具体来说,识别吊颈线的条件如下:
- 蜡烛线体大小(opening price与closing price之差)要小于阈值(dojiThreshold)
- 上影线大小要大于蜡烛线体的两倍
- 下影线大小也要大于蜡烛线体的两倍
满足上述条件即可认定为吊颈线形态。此外,根据上下影线的大小关系,还可以区分出更加具体的吊颈线类别,如阳线吊颈、阴线吊颈、长脚吊颈等。在识别出吊颈线形态后,策略会在下一根K线产生交易信号,即阳线吊颈产生买入信号,阴线吊颈产生卖出信号。
阴阳吊颈线策略具有以下主要优势:
- 规则简单清晰,容易理解实施
- 吊颈线代表市场力量博弈和趋势转换的信号,捕捉转折点能够获得较好收益
- 可结合趋势、支持阻力等因素过滤交易信号,提高策略稳定性
但是,阴阳吊颈线策略也存在一些局限性,主要体现在以下几个方面:
- 吊颈线形态出现频率较低,容易漏失交易机会
- 单一技术指标容易产生假信号
- 无法有效应对剧烈行情的突发性大幅波动
阴阳吊颈线策略的主要风险来源于以下几个方面:
- 吊颈线形态判断误差风险。由于人为判断形态的主观性,容易出现漏识或误判形态的情况。
- 假阳吊颈和假阴吊颈带来的风险。容易被短期小幅波动误判为重要信号。
- 震荡行情风险。震荡期间,难以通过吊颈线获利。
- 关键参数设定风险。如设定阈值过宽或过窄,都会影响策略收益率。
此外,单一技术指标策略无法有效过滤市场噪音,也容易产生误导性信号。所以阴阳吊颈线策略的风险与波动较大,需要加强风险管理。
为控制风险,可从以下几个方面进一步优化阴阳吊颈线策略:
- 设置交易前条件,比如结合趋势指标过滤;设置突破前高点的条件来确认趋势转折。
- 结合其他技术指标判断力度。例如成交量的放大来验证重要性。
- 通过机器学习等方法自动优化关键参数设定。
- 采用止损来控制单笔损失。
通过以上几点改进,可以大幅降低吊颈线策略的风险,提高策略稳定性。
阴阳吊颈线策略通过识别蜡烛线图中的吊颈线形态来产生交易信号。它具有规则简单、捕捉转折点的优势,但是也存在产生误信号的风险。此策略可通过参数优化、加入过滤条件等方法来控制风险,提高稳定性和实战效果。但即便如此,作为单一技术指标策略,它对市场噪音的敏感性仍然较高,风险也较大,所以需要谨慎对待。
||
The Yin Yang Hanging Man strategy is a quantitative trading strategy based on the hanging man candlestick pattern. This strategy generates trading signals by identifying hanging man patterns in candlestick charts. When a hanging man pattern is identified, a buy signal is generated for a bullish hanging man, while a sell signal is generated for a bearish hanging man.
The core identification condition of the Yin Yang Hanging Man strategy is the hanging man candlestick pattern with a small real body and long upper/lower shadows. Specifically, the identification conditions for a hanging man are:
- The real body size (difference between opening price and closing price) is smaller than the threshold (dojiThreshold)
- The upper shadow size is more than twice the real body size
- The lower shadow size is also more than twice the real body size
When the above conditions are met, the pattern can be identified as a hanging man. Moreover, more specific types of hanging mans like bullish/bearish or long-legged can be distinguished based on the relative sizes of the upper and lower shadows. After identifying the pattern, the strategy generates trading signals on the next candlestick, i.e. buy on bullish hanging man, sell on bearish hanging man.
The Yin Yang Hanging Man strategy has the following main advantages:
- Simple and clear rules that are easy to understand and implement
- Hanging mans represent tussles in market force and trend reversals, capturing turning points can yield good returns
- Can combine with factors like trend, support/resistance to filter signals and improve stability
However, there are some limitations to the strategy as well:
- Low frequency of hanging man patterns, tends to miss trading opportunities
- Single indicator prone to false signals
- Ineffective in extreme volatility and violent trend swings
The main risks of this strategy stem from:
- Risk of errors in pattern identification due to subjectivity
- Risk from false bullish/bearish hanging signal on minor fluctuations
- Risk in range-bound markets with difficulty profiting from patterns
- Risk from suboptimal parameter settings like threshold levels
Also, single indicator strategies cannot filter market noise effectively and can generate misleading signals. So the Yin Yang strategy has relatively large risks and fluctuations that necessitate robust risk management.
To control risks, the strategy can be improved in the following ways:
- Adding trade prerequisites like filters based on trend indicators or breakthrough of previous peak to confirm trend reversal
- Incorporating other indicators like trading volumes to gauge signal importance
- Automated optimization of key parameters via machine learning etc
- Mitigating losses through stop loss
With these enhancements, the risks can be reduced significantly while improving stability of the Yin Yang hanging man strategy.
To summarize, the Yin Yang Hanging Man strategy generates trade signals by identifying hanging man patterns in candlestick charts. It has the advantage of simple rules and catching reversals but also risks of false signals. The risks can be controlled through parameter tuning, adding filters etc but sensitivity to noise and fluctuations remains high. So the strategy warrants prudent application despite enhancements.
[/trans]
Source (PineScript)
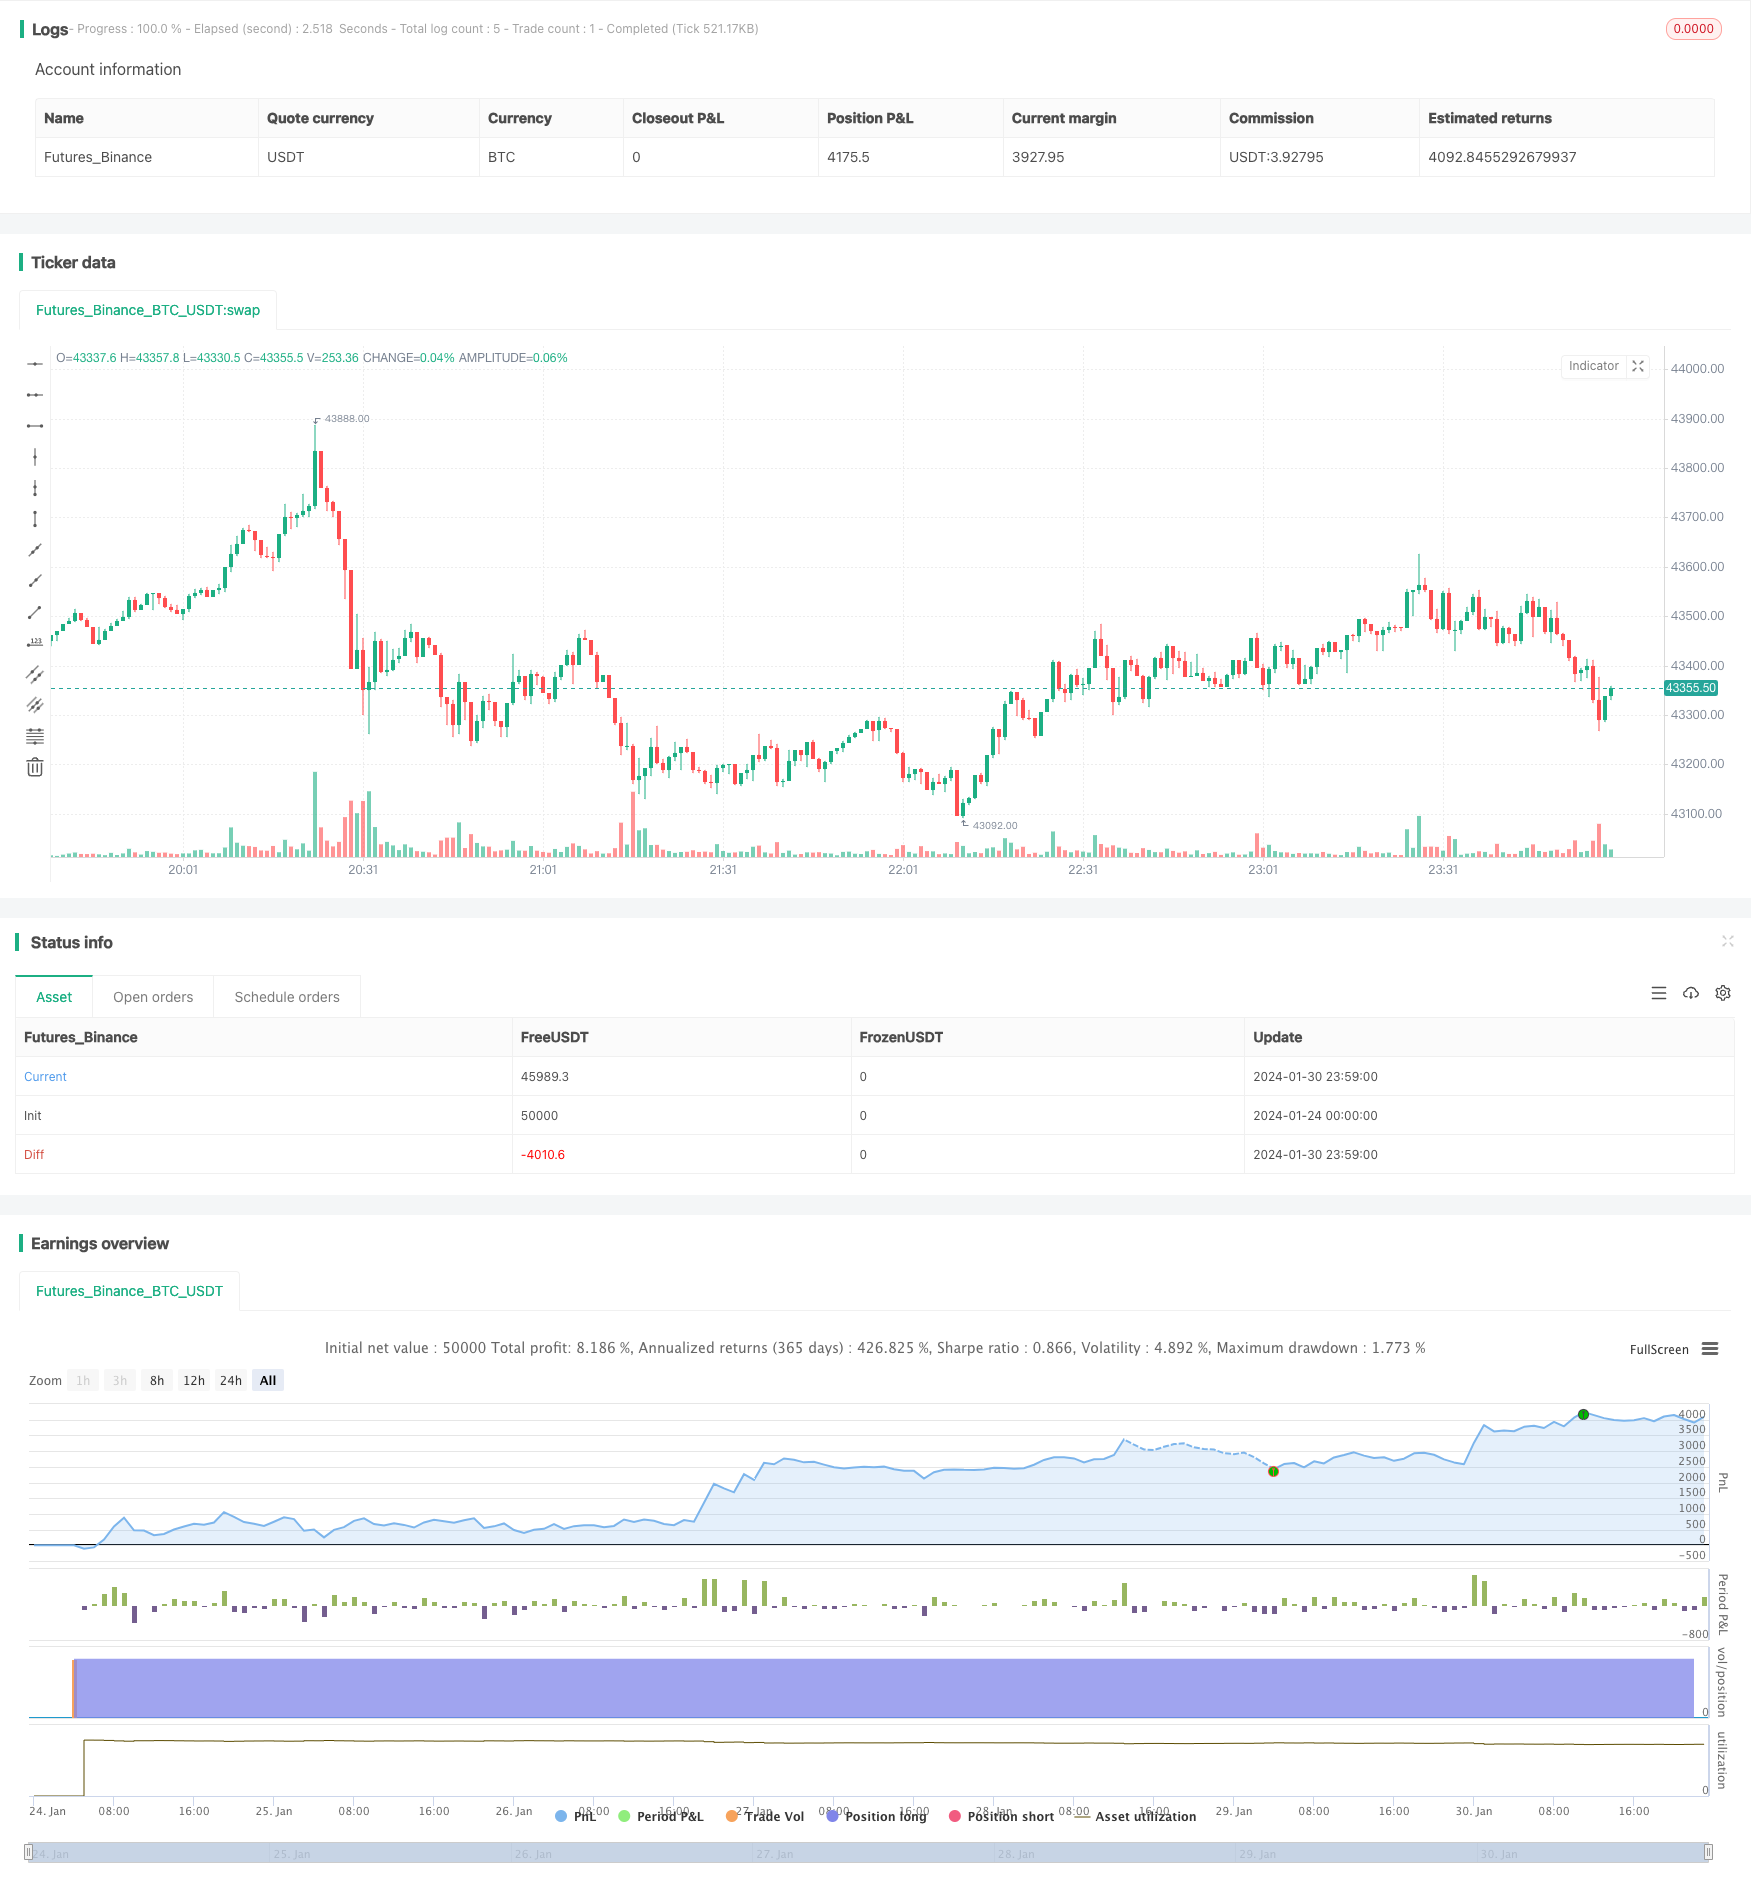
/*backtest
start: 2024-01-24 00:00:00
end: 2024-01-31 00:00:00
period: 1m
basePeriod: 1m
exchanges: [{"eid":"Futures_Binance","currency":"BTC_USDT"}]
*/

//@version=5
strategy("Doji Candlestick Strategy", shorttitle="Doji", overlay=true)

// Calculate body and shadow sizes
bodySize = close > open ? close - open : open - close
upperShadow = high - (open > close ? open : close)
lowerShadow = (open > close ? close : open) - low

// Define thresholds for identifying different Doji types
dojiThreshold = 0.05
longLeggedDojiThreshold = 0.02

// Buy conditions for different Doji types
dojiCondition = bodySize <= dojiThreshold and upperShadow > bodySize * 2 and lowerShadow > bodySize * 2
dragonflyDojiCondition = bodySize <= dojiThreshold and upperShadow > bodySize * 2 and lowerShadow <= bodySize * 0.5
gravestoneDojiCondition = bodySize <= dojiThreshold and upperShadow <= bodySize * 0.5 and lowerShadow > bodySize * 2
longLeggedDojiCondition = bodySize <= longLeggedDojiThreshold and upperShadow > bodySize * 2 and lowerShadow > bodySize * 2

// Buy signal
buyCondition = dojiCondition or dragonflyDojiCondition or gravestoneDojiCondition or longLeggedDojiCondition

// Strategy orders
strategy.entry("Buy", strategy.long, when=buyCondition)

// Plotting
plotshape(series=buyCondition, title="Buy Signal", color=color.green, style=shape.triangleup, location=location.belowbar, size=size.small)
Detail
https://www.fmz.com/strategy/440692
Last Modified
2024-02-01 11:09:15