Name
金森一分钟震荡策略Gem-Forest-One-Minute-Scalping-Strategy
Author
ChaoZhang
Strategy Description
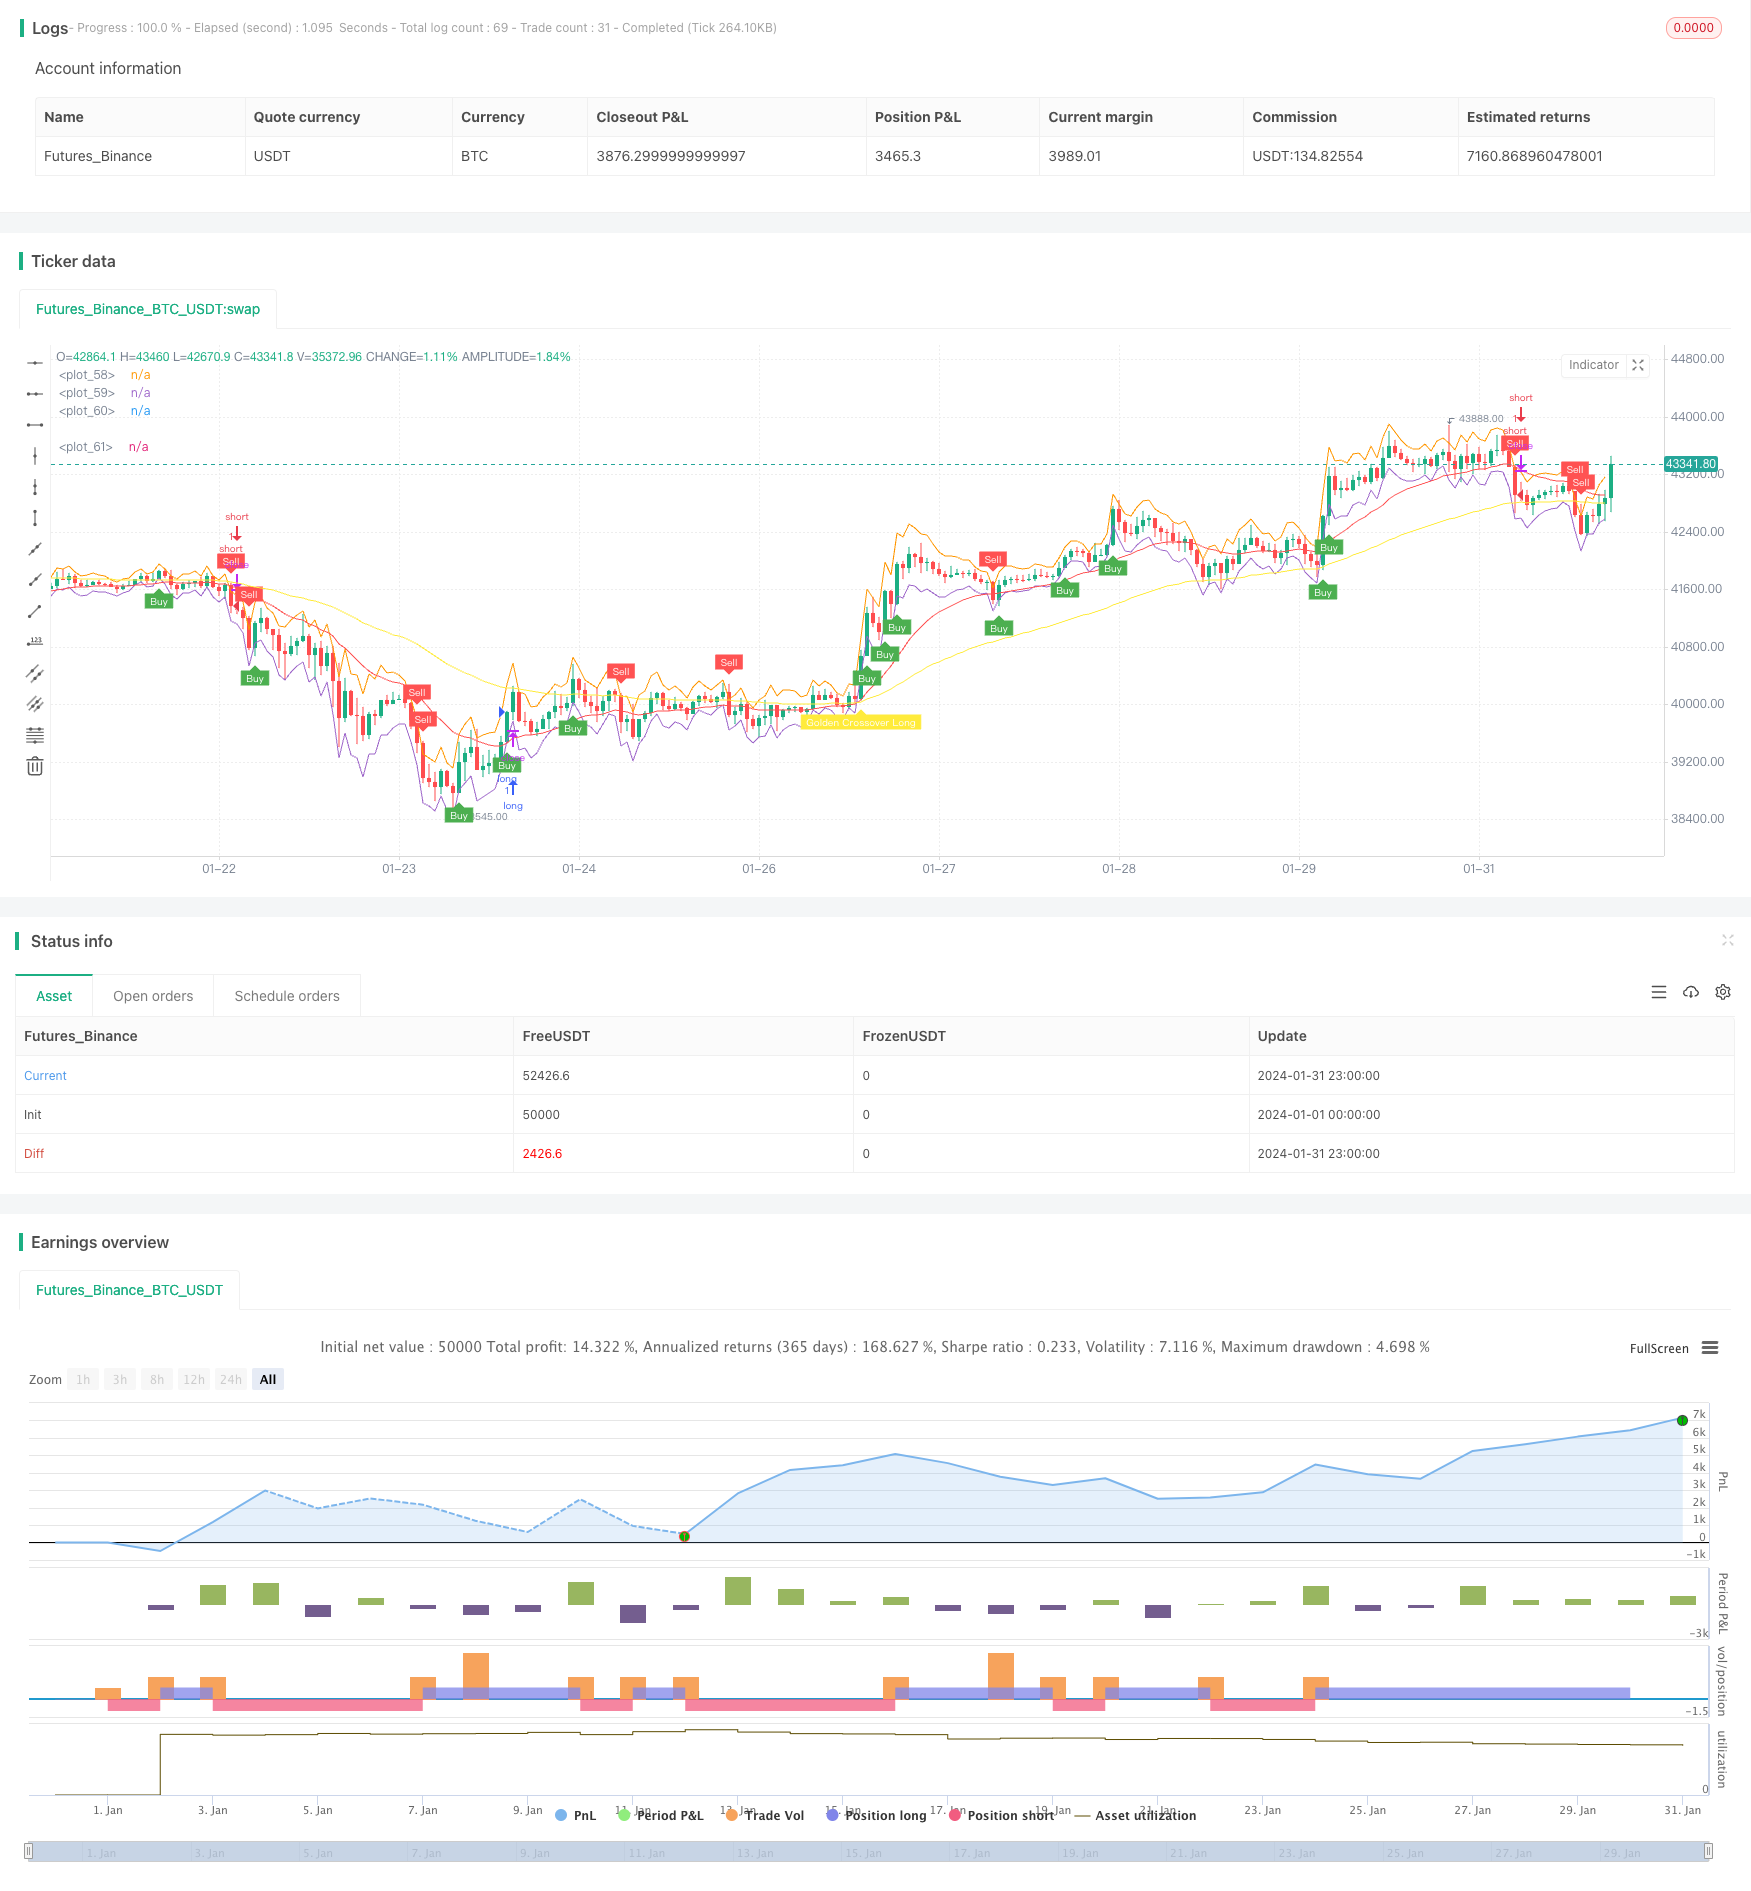
金森一分钟震荡策略(Gem Forest One Minute Scalping Strategy)是一个短线量化交易策略。该策略综合运用多个指标,识别市场在1分钟时间框架下的震荡特征,据此进行长短仓位切换,实现超短线套利。
- ATR指标构建上下轨,判断价格震荡范围
- 快慢EMA指标构建金叉死叉交易信号
- 双RSI指标确认金叉死叉信号
- 结合指标信号和价格位置,确定具体的入场点和出场点
当价格低于下轨时,快慢EMA形成金叉,快线RSI上穿慢线RSI,产生买入信号;当价格高于上轨时,快慢EMA形成死叉,快线RSI下穿慢线RSI,产生卖出信号。入场后设置止损和止盈退出。
- 多指标组合,综合判断,可靠性较高
- 策略操作频率高,具有较强的盈利空间
- 策略回撤 pequeño 稳定性好
- 可在1分钟或更短周期内进行超短线套利
- 超短线操作,对网络和硬件要求较高
- 超短线容易造成过度交易和资金分散
- 指标设置不当可能造成虚假信号
- 依赖特定市场环境,行情剧烈波动时容易止损
针对这些风险,可以优化指标参数,调整止损止盈方式,适当限制单日最大交易次数,选择流动性好、波动率适中的交易品种等。
- 测试不同ATR周期参数对结果的影响
- 尝试不同类型的EMA,或将其中一个EMA改为其他指标
- 调整RSI周期参数,或尝试其他震荡指标如KDJ、Stochastics等
- 优化入场点选择方法,如结合更多因素判定趋势性等
- 调整止损止盈点以优化收益风险比
金森一分钟震荡策略充分考量了超短线量化交易的特点,指标参数设置合理,采用多指标确认和组合使用,可靠性较高,在严格控制风险的前提下,具有较强的盈利潜力,非常适合有足够运算能力和心理素质的投资者实盘验证。
||
The Gem Forest One Minute Scalping Strategy is a quantitative trading strategy for short-term trading. It combines multiple indicators to identify market oscillation characteristics within a 1-minute timeframe and switch between long and short positions for ultra-short scalping.
- ATR indicator builds upper and lower bands to determine price oscillation range
- Fast and slow EMA crossovers generate trading signals
- Dual RSI indicators confirm crossover signals
- Entry and exit points are determined by combining indicator signals and price levels
When price is below the lower band, fast and slow EMA golden cross happens, fast RSI crosses above slow RSI, a buy signal is generated; When price is above upper band, fast and slow EMA dead cross happens, fast RSI crosses below slow RSI, a sell signal is generated. After entry, stop loss and take profit are used for exit.
- Multiple indicators combined improves reliability
- High operation frequency provides greater profit potential
- Smaller drawdowns, better stability
- Capable of ultra-short scalping within 1-min or shorter timeframe
- Higher requirements for network and hardware due to high frequency
- Over-trading and capital scattering risks
- False signals from poor indicator configuration
- Vulnerable to stop loss in volatile market conditions
These risks can be managed by optimizing parameters, adjusting stops, limiting max daily trades, choosing proper products etc.
- Test impact of different ATR periods
- Try different EMA types or replace one EMA
- Adjust RSI periods or test other oscillators like KDJ, Stochastics etc
- Improve entry logic with more factors like trends
- Optimize stops for better risk-reward ratio
This strategy fully considers the characteristics of ultra-short quantitative trading. Reasonable indicator settings, multiple confirmations and combinations ensure high reliability. With strict risk control, it has considerable profit potential and suits investors with sufficient computing power and psychological quality.
[/trans]
Strategy Arguments
| Argument | Default | Description |
|---|---|---|
| v_input_int_1 | 14 | ATR Period |
| v_input_float_1 | true | ATR Multi |
| v_input_string_1 | 0 | ATR Smoothing: WMA |
| v_input_int_2 | 21 | Fast EMA |
| v_input_int_3 | 65 | Slow EMA |
| v_input_int_4 | 25 | Fast RSI Length |
| v_input_int_5 | 100 | Slow RSI Length |
Source (PineScript)
/*backtest
start: 2024-01-01 00:00:00
end: 2024-01-31 23:59:59
period: 1h
basePeriod: 15m
exchanges: [{"eid":"Futures_Binance","currency":"BTC_USDT"}]
*/

//@version=5
strategy("Gem Forest 1 Dakika Scalp", overlay=true)

source = close
atrlen = input.int(14, "ATR Period")
mult = input.float(1, "ATR Multi", step=0.1)
smoothing = input.string(title="ATR Smoothing", defval="WMA", options=["RMA", "SMA", "EMA", "WMA"])

ma_function(source, atrlen) =>
    if smoothing == "RMA"
        ta.rma(source, atrlen)
    else
        if smoothing == "SMA"
            ta.sma(source, atrlen)
        else
            if smoothing == "EMA"
                ta.ema(source, atrlen)
            else
                ta.wma(source, atrlen)

atr_slen = ma_function(ta.tr(true), atrlen)
upper_band = atr_slen * mult + close
lower_band = close - atr_slen * mult

ShortEMAlen = input.int(21, "Fast EMA")
LongEMAlen = input.int(65, "Slow EMA")
shortSMA = ta.ema(close, ShortEMAlen)
longSMA = ta.ema(close, LongEMAlen)
RSILen1 = input.int(25, "Fast RSI Length")
RSILen2 = input.int(100, "Slow RSI Length")
rsi1 = ta.rsi(close, RSILen1)
rsi2 = ta.rsi(close, RSILen2)
atr = ta.atr(atrlen)

RSILong = rsi1 > rsi2
RSIShort = rsi1 < rsi2

longCondition = open < lower_band
shortCondition = open > upper_band
GoldenLong = ta.crossover(shortSMA,longSMA)
Goldenshort = ta.crossover(longSMA,shortSMA)

plotshape(shortCondition, title="Sell Label", text="Sell", location=location.abovebar, style=shape.labeldown, size=size.tiny, color=color.red, textcolor=color.white, transp=0)
plotshape(longCondition, title="Buy Label", text="Buy", location=location.belowbar, style=shape.labelup, size=size.tiny, color=color.green, textcolor=color.white, transp=0)
plotshape(Goldenshort, title="Golden Sell Label", text="Golden Crossover Short", location=location.abovebar, style=shape.labeldown, size=size.tiny, color=color.blue, textcolor=color.white, transp=0)
plotshape(GoldenLong, title="Golden Buy Label", text="Golden Crossover Long", location=location.belowbar, style=shape.labelup, size=size.tiny, color=color.yellow, textcolor=color.white, transp=0)

if (longCondition)
    stopLoss = low - atr * 2
    takeProfit = high + atr * 5
    strategy.entry("long", strategy.long, when = RSILong)

if (shortCondition)
    stopLoss = high + atr * 2
    takeProfit = low - atr * 5
    strategy.entry("short", strategy.short, when = RSIShort)

plot(upper_band)
plot(lower_band)
plot(shortSMA, color = color.red)
plot(longSMA, color = color.yellow)
Detail
https://www.fmz.com/strategy/442079
Last Modified
2024-02-19 10:45:18
