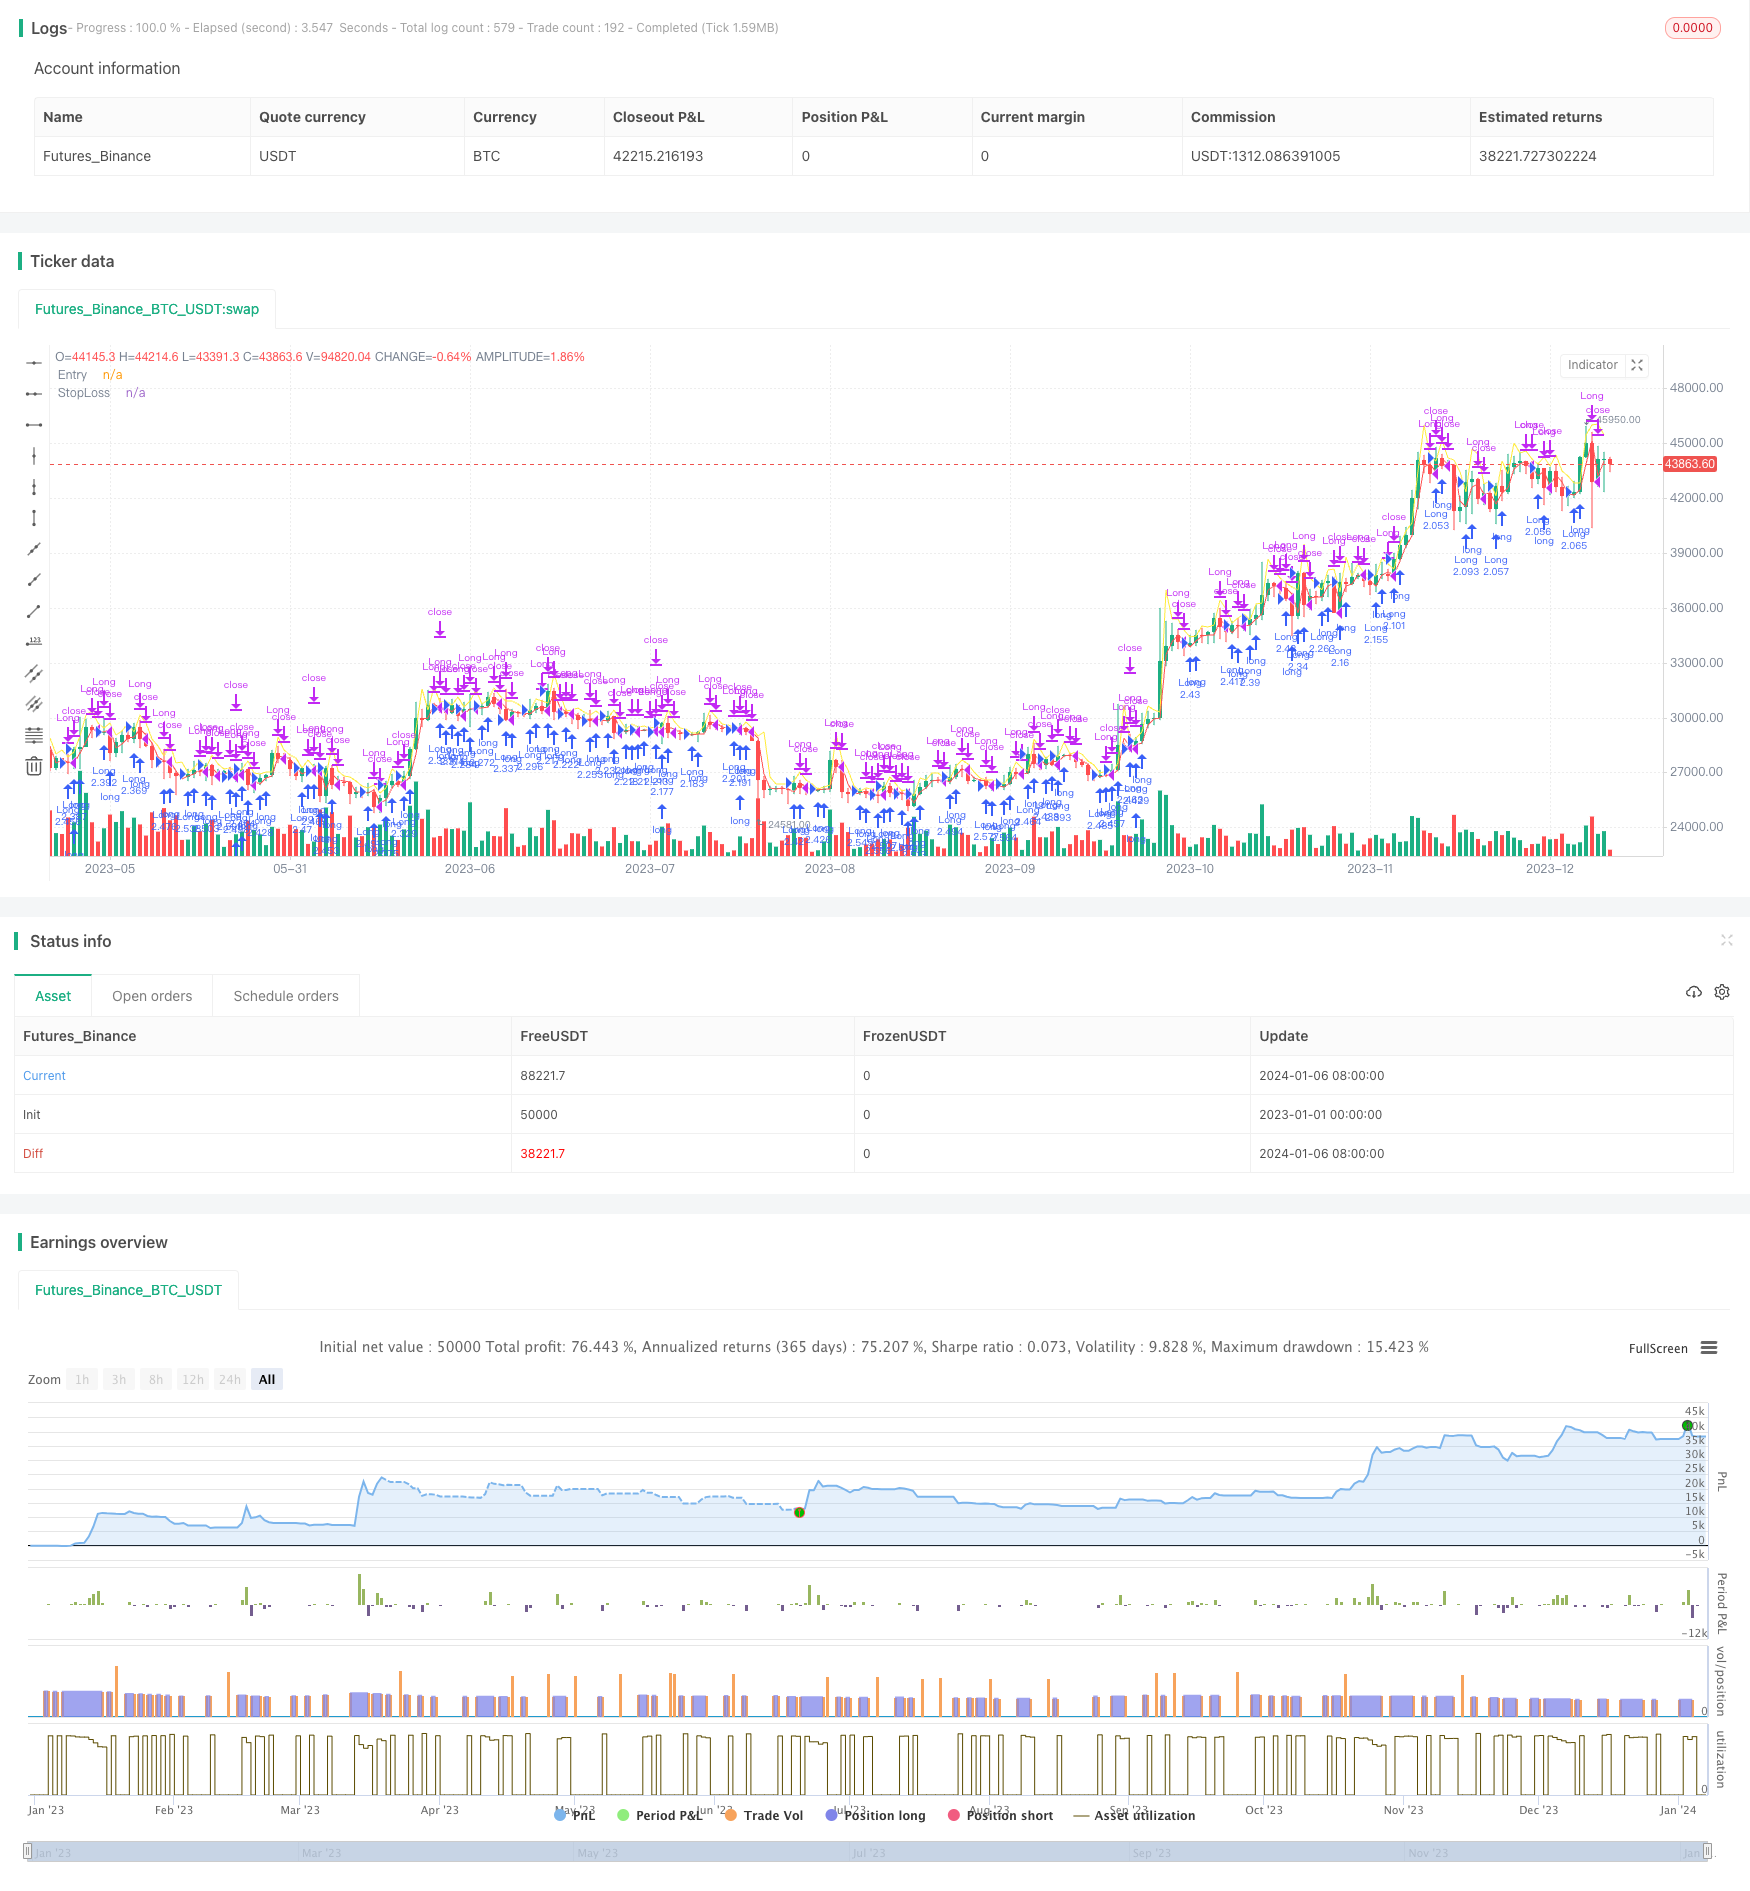
Name
适应性变动性突破策略Adaptive-Volatility-Breakout-Strategy
Author
ChaoZhang
Strategy Description
适应性变动性突破策略是一种趋势跟踪策略。它通过识别强势上涨超过“一定水平”的突破信号,建立多头仓位,持续跟踪上涨趋势,在次日开盘时获利了结。
该策略由Larry R. Williams提出,他是一位著名的期货和股票交易者。该策略试图捕捉价格的突破点,这些点往往预示着行情的转折。通过及时识别这些信号并建仓,可以跟踪新的行情趋势获得收益。
该策略的核心指标是“一定水平”,它由以下公式计算:
一定水平 = 收盘价 + k * (最高价 - 最低价)
其中k是经验系数,值为0.6。该公式加入了最高价和最低价的变动性成分,使得突破点更具灵活性,可以适应市场的反复。
当天的最高价超过计算出的“一定水平”时,表明价格出现突破,此时策略会建立多头仓位。次日开盘时会全部了结仓位获利。
止损水平设定为前一日的最低价和入场价的一半,防止亏损扩大。
该策略具有以下优势:
-
捕捉变动性,顺势而为:策略加入了最高价和最低价计算突破点,使得突破信号更具灵活性,能够捕捉价格变化的节奏。
-
及时入场,跟踪趋势:通过每日计算突破信号,可以及时识别新的行情,跟上价格上涨的步伐。
-
风险控制到位:设置了合理的止损位置,可以有效控制单笔亏损。
该策略也存在以下风险:
-
突破失败风险:价格突破不一定持续上涨,可能是短期的假突破。这时会产生亏损。
-
极端行情风险:在股灾、突发事件等极端行情下,价格可能出现断层和跳空,导致止损被触发产生大量亏损。
-
过度交易风险:每日建仓和平仓,会增加交易频率和手续费的负担。
该策略可以从以下角度进行优化:
-
加入乘数:在突破计算公式中加入一个乘数,当市场波动加大时适当调小,当市场稳定时适当调大,使策略更具弹性。
-
延长持仓时间:将持仓时间延长至2天或3天,过滤掉短期的假突破。
-
优化止损位置:将止损位置设置为更深度的支撑位置,如布林带下限、前日收盘价等。
适应性变动性突破策略通过实时跟踪价格的变动性和节奏,实现了趋势跟踪。相对于传统突破策略,它更具有弹性和捕捉能力。但也需要注意风险,在极端行情下止损可能会被突破。通过持仓时间和止损位优化可以获得更优结果。
||
The Adaptive Volatility Breakout Strategy is a trend-following strategy. It identifies breakout signals when prices rise strongly above a "certain level", establishes long positions, and continues to track the uptrend to profit at the next day's open.
The strategy was proposed by Larry R. Williams, a famous futures and stock trader. It tries to capture price breakout points, which often signify turns in the market. By timely identifying these signals and establishing positions, profits can be obtained by following new trend directions.
The core metric of this strategy is the "certain level", calculated by:
Certain level = Close + k * (High - Low)
Where k is an empirical coefficient, valued at 0.6. This formula incorporates the volatility of highest and lowest prices, making the breakout points more flexible to adapt to market fluctuations.
When the day's highest price breaks through the calculated "certain level", it indicates a price breakout. The strategy will then establish a long position. The position will be entirely closed at the next day's open for profit.
The stop loss is set to half of the previous day's lowest price and entry price, preventing the loss from expanding.
The advantages of this strategy include:
-
Capturing volatility, trend-following: The strategy incorporates highest and lowest prices to calculate flexible breakout points that capture price fluctuation rhythms.
-
Timely entry, trend tracking: Daily calculation of breakout signals allows timely identification of new trends to follow up price uptrend steps.
-
Proper risk control: Reasonable stop loss setting effectively controls single loss.
Risks of this strategy include:
-
Failed breakout risk: Price breakouts do not necessarily sustain an uptrend and may be short-term false breakouts, causing losses.
-
Extreme market risk: In extreme market events like market crashes, prices may gap up/down causing stop loss triggers and huge losses.
-
Excessive trading risk: Daily opening and closing of positions increases trading frequency and commission fees.
The strategy can be optimized from the following aspects:
-
Adding a multiplier: Adding a multiplier to the breakout formula, properly reducing it when market volatility rises and increasing it when the market stabilizes, making the strategy more elastic.
-
Extending holding period: Extending the holding period to 2 or 3 days to filter out short-term false breakouts.
-
Optimizing stop loss: Setting stop loss to deeper support levels like Bollinger lower band or previous day's close.
The Adaptive Volatility Breakout Strategy tracks trends by dynamically tracking price volatility and rhythms. Compared to traditional breakout strategies, it is more flexible and capable in capturing price movements. But risks should be noted that stops can be hit in extreme markets. Further optimizations on holding period and stop loss can lead to better results.
[/trans]
Strategy Arguments
| Argument | Default | Description |
|---|---|---|
| v_input_float_1 | 0.6 | k |
Source (PineScript)
/*backtest
start: 2023-01-01 00:00:00
end: 2024-01-07 00:00:00
period: 1d
basePeriod: 1h
exchanges: [{"eid":"Futures_Binance","currency":"BTC_USDT"}]
*/

// This source code is subject to the terms of the Mozilla Public License 2.0 at https://mozilla.org/MPL/2.0/
// © Dicargo_Beam

//@version=5
strategy("Volatility Breakout Strategy", overlay=true, default_qty_type= strategy.percent_of_equity, default_qty_value=100,process_orders_on_close=false)

k = input.float(0.6)


[o,h,l,c] = request.security(syminfo.tickerid,"D",[open,high,low,close])

lp = math.log(c[1])+(math.log(h[1])-math.log(l[1]))*k
_lp = math.pow(2.718,lp)

longcond = _lp < high
exit = hour==0 or  math.log(close) < (math.log(l[1])+lp)/2


plot(_lp,"Entry",color=color.yellow)
//plot(l,"Yesterday's Low")
plot((_lp+l[1])/2,"StopLoss",color=color.red)


strategy.entry("Long", strategy.long,comment = "Long", when = longcond and strategy.opentrades == 0)

strategy.close("Long", comment="Exit", when = exit)


var bg = 0
bg := if hour == 0
    bg + 1
else
    bg[1]

bgcolor(bg/2== math.floor(bg/2) ? color.new(color.blue,95):na)
Detail
https://www.fmz.com/strategy/438036
Last Modified
2024-01-08 14:38:31
