Name
运用布林带突破整合策略Consolidation-Breakout-Strategy
Author
ChaoZhang
Strategy Description
该策略运用布林带指标判断价格是否处于整合期,以及使用突破判断入场和出场。整体来说,该策略主要利用价格整合带来的剧烈行情进行获利。
该策略首先计算20日内的收盘价的简单移动平均线作为布林带的中轨,并计算标准差的2倍作为布林带的带宽。当价格高于上轨时判定为突破上轨,当价格低于下轨时判定为突破下轨。
当价格位于布林带中轨上下时,判断为整合期。当检测到突破信号时,做多头入场。当再次突破下轨时,平仓。做空同理。
止损设定为ATR指标的2倍。
该策略主要依赖布林带的整合与突破属性,具有以下优势:
- 利用价格整合带来的剧烈行情,潜在获利空间大
- 布林带指标直观,参数优化简单
- 随大趋势运行,避免追顶杀跌
该策略也存在一些风险:
- 突破信号可能出现假突破,造成亏损
- 止损设置过大,单笔亏损扩大
- 布林带参数设置不当,失去指标效用
对策:
- 结合价量指标过滤假突破
- 优化止损区间,降低单笔亏损
- 测试不同布林带参数,选择最优参数
该策略可以从以下几个方向进行优化:
- 整合判定规则可以引入更多指标,避免错误信号
- 增加趋势过滤,根据趋势方向决定做多做空
- 增加止损方式,如追踪止损等,更好控制风险
该策略整体较为简单直接,通过捕捉价格整合带来的能量聚集实现较大盈利。优化空间较大,可从入场规则、止损方式等方面进行调整,在控制风险的前提下获得更稳定收益。
||
This strategy uses the Bollinger Bands indicator to determine if prices are in a consolidation period, and breakouts to determine entries and exits. Overall, this strategy mainly takes advantage of the violent moves brought by price consolidations to make profits.
The strategy first calculates the 20-day simple moving average of the closing price as the middle band of the Bollinger Bands, and 2 times the standard deviation as the band width. A close above the upper band indicates an upper band breakout, while a close below the lower band indicates a lower band breakout.
When prices are between the upper and lower Bollinger Bands, it is considered a consolidation period. When a breakout signal is detected, go long. When prices break below the lower band again, close the position. Going short works similarly.
The stop loss is set at 2 times the ATR indicator.
The main advantages of this strategy are:
- Taking advantage of violent moves brought by price consolidations for potentially huge profits
- Bollinger Bands indicator is intuitive and easy to optimize parameters
- Following major trends, avoiding buying tops and selling bottoms
There are also some risks:
- Breakout signals may turn out to be false breaks, causing losses
- Stop loss set too wide, leading to large losses
- Bollinger Bands parameters set improperly, losing effectiveness
Counter measures:
- Add volume filters to detect false breaks
- Optimize stop loss range to limit losses
- Test different BB parameters to find optimum
Some ways to improve the strategy:
- Add more indicators to consolidate detection rules to avoid false signals
- Add trend filter to determine long/short based on trend direction
- Enhance stop loss methods like trailing stop to better control risks
The strategy is simple and straight forward, profiting from energy buildup during consolidations. Huge optimization space exists around entry rules, stop loss methods etc to obtain more steady profits while controlling risks.
[/trans]
Strategy Arguments
| Argument | Default | Description |
|---|---|---|
| v_input_1 | 20 | Bollinger Bands Length |
| v_input_2 | 2 | Bollinger Bands Multiplier |
| v_input_float_1 | true | Risk per Trade (%) |
| v_input_float_2 | 2 | Stop Loss Multiplier |
Source (PineScript)
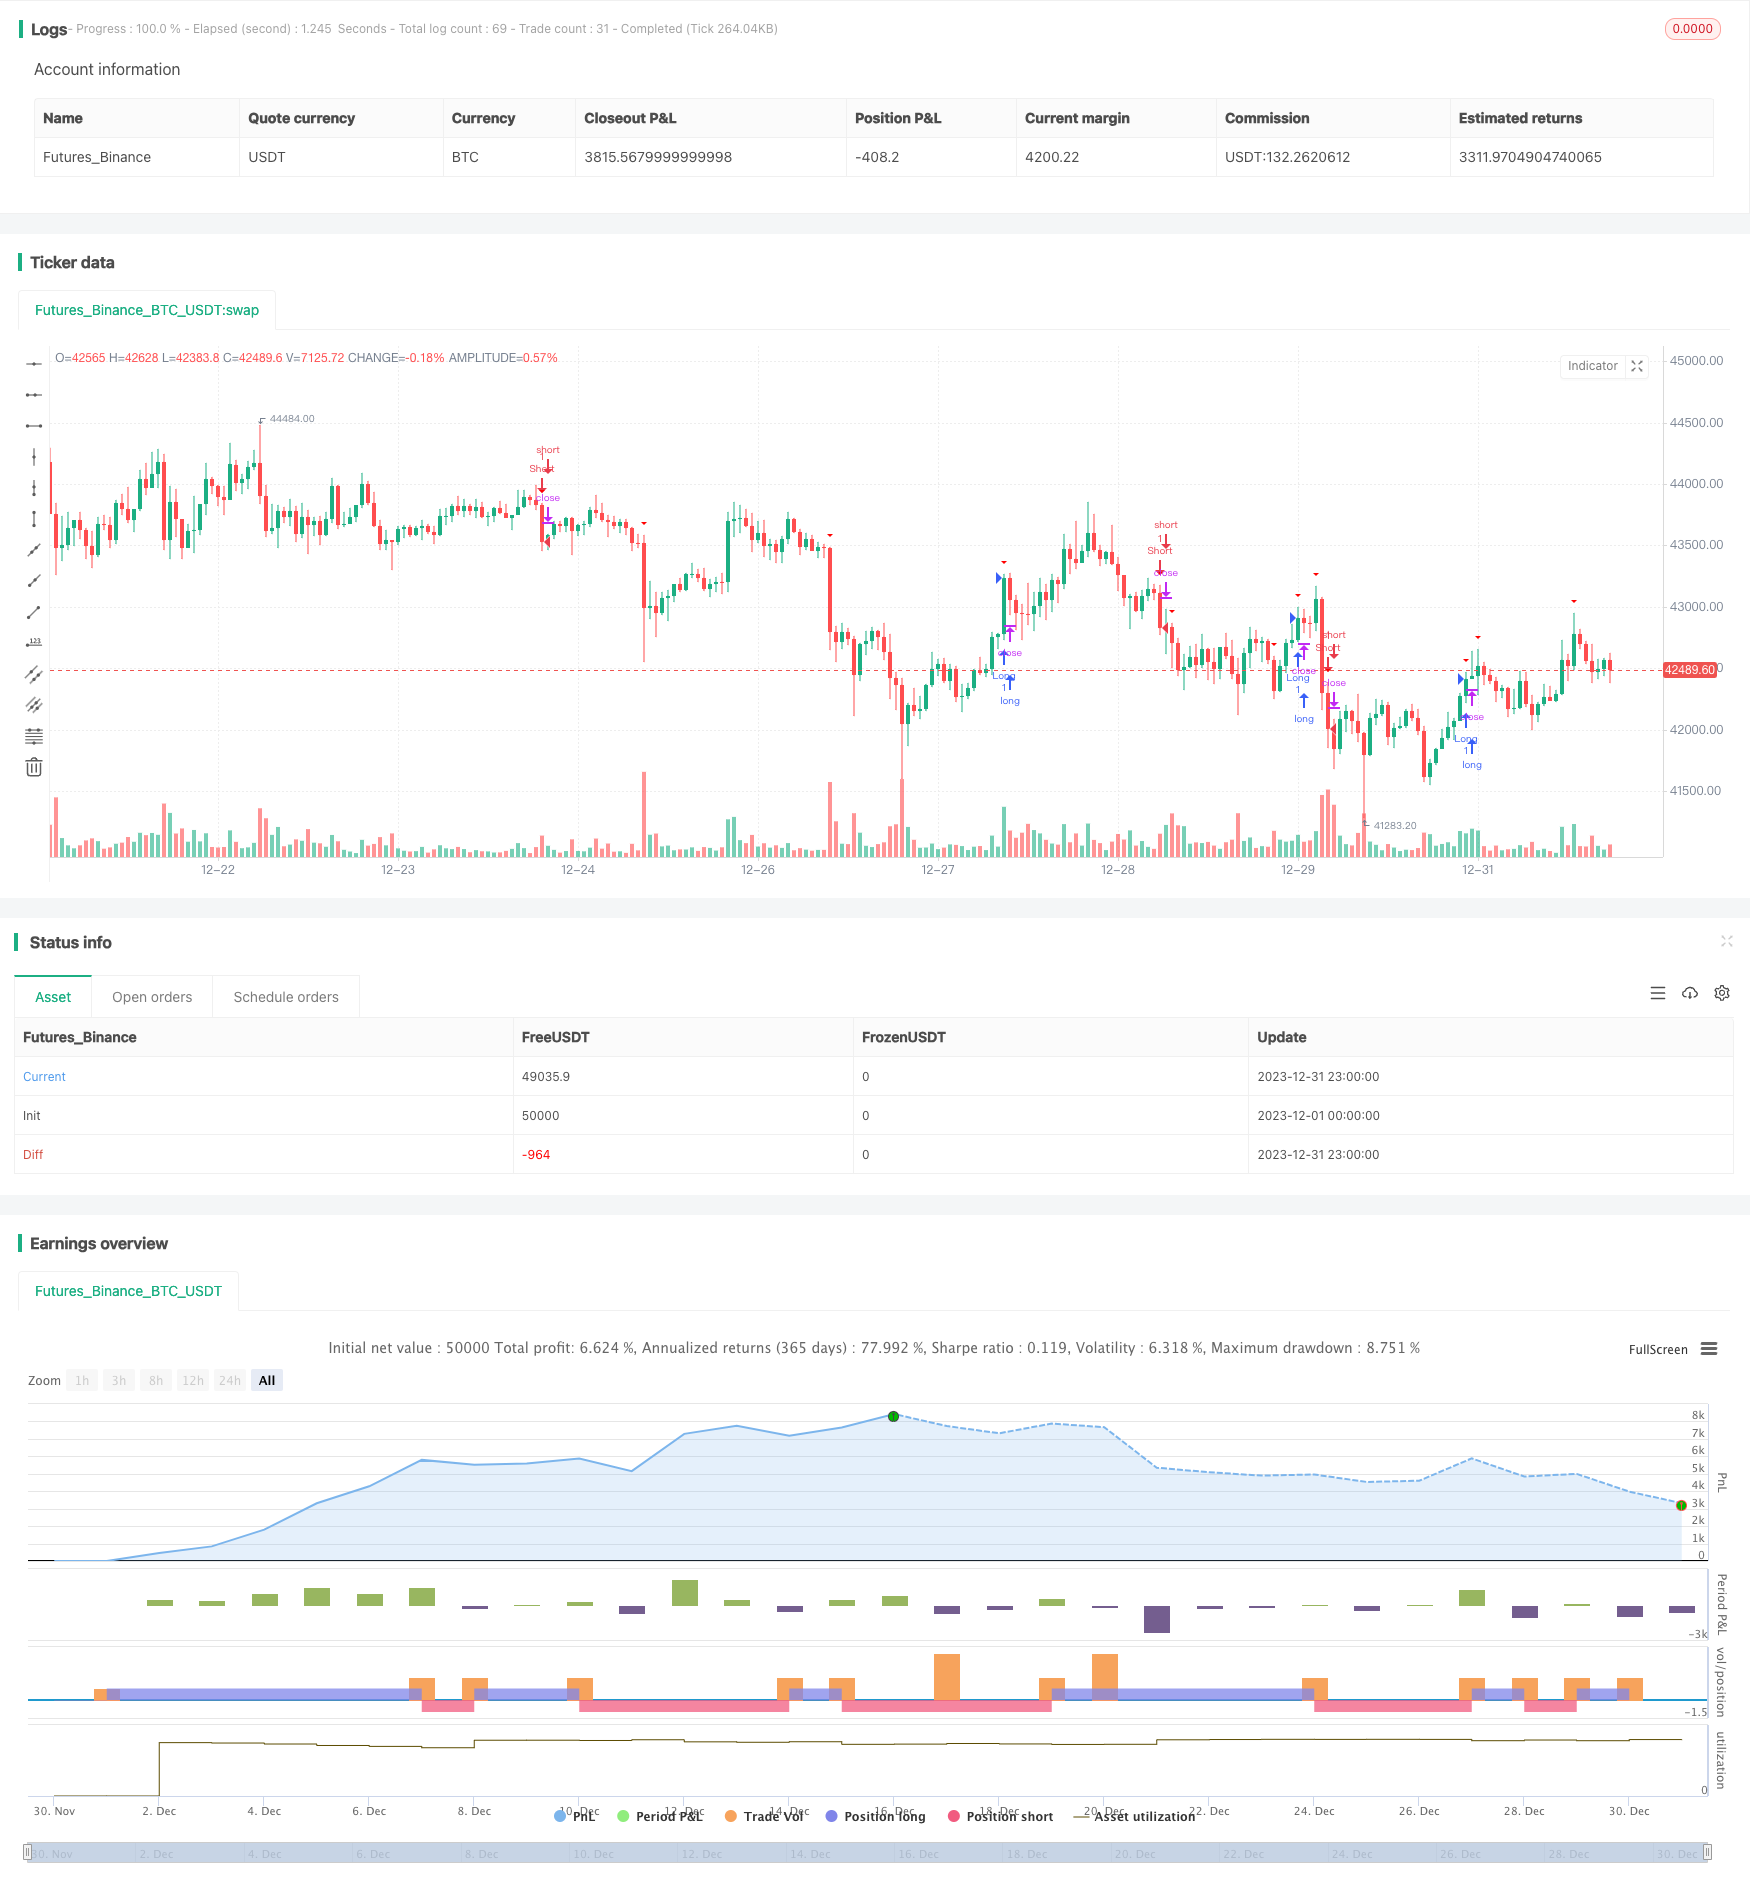
/*backtest
start: 2023-12-01 00:00:00
end: 2023-12-31 23:59:59
period: 1h
basePeriod: 15m
exchanges: [{"eid":"Futures_Binance","currency":"BTC_USDT"}]
*/

//@version=5
strategy("Consolidation Breakout Strategy", shorttitle="CBS", overlay=true)

// Parameters
length = input(20, title="Bollinger Bands Length")
mult = input(2.0, title="Bollinger Bands Multiplier")
risk = input.float(1, title="Risk per Trade (%)") / 100

// Calculate Bollinger Bands
basis = ta.sma(close, length)
dev = mult * ta.stdev(close, length)
upper = basis + dev
lower = basis - dev

// Entry Conditions
consolidating = ta.crossover(close, upper) and ta.crossunder(close, lower)

// Exit Conditions
breakout = ta.crossover(close, upper) or ta.crossunder(close, lower)

// Risk Management
atrVal = ta.atr(14)
stopLoss = atrVal * input.float(2, title="Stop Loss Multiplier", minval=0.1, maxval=5)

// Entry and Exit Conditions
longEntry = breakout and close > upper
shortEntry = breakout and close < lower

if (longEntry)
    strategy.entry("Long", strategy.long)

if (shortEntry)
    strategy.entry("Short", strategy.short)

if (longEntry and close < basis - stopLoss)
    strategy.close("Long Exit")

if (shortEntry and close > basis + stopLoss)
    strategy.close("Short Exit")

// Plot Entry and Exit Points
plotshape(consolidating, style=shape.triangleup, location=location.belowbar, color=color.rgb(30, 255, 0), title="Entry Signal")
plotshape(breakout, style=shape.triangledown, location=location.abovebar, color=color.rgb(255, 0, 0), title="Exit Signal")
Detail
https://www.fmz.com/strategy/440542
Last Modified
2024-01-31 15:08:46