Name
趋势跟踪移动平均指标策略Moving-Average-Trend-Tracking-Strategy
Author
ChaoZhang
Strategy Description
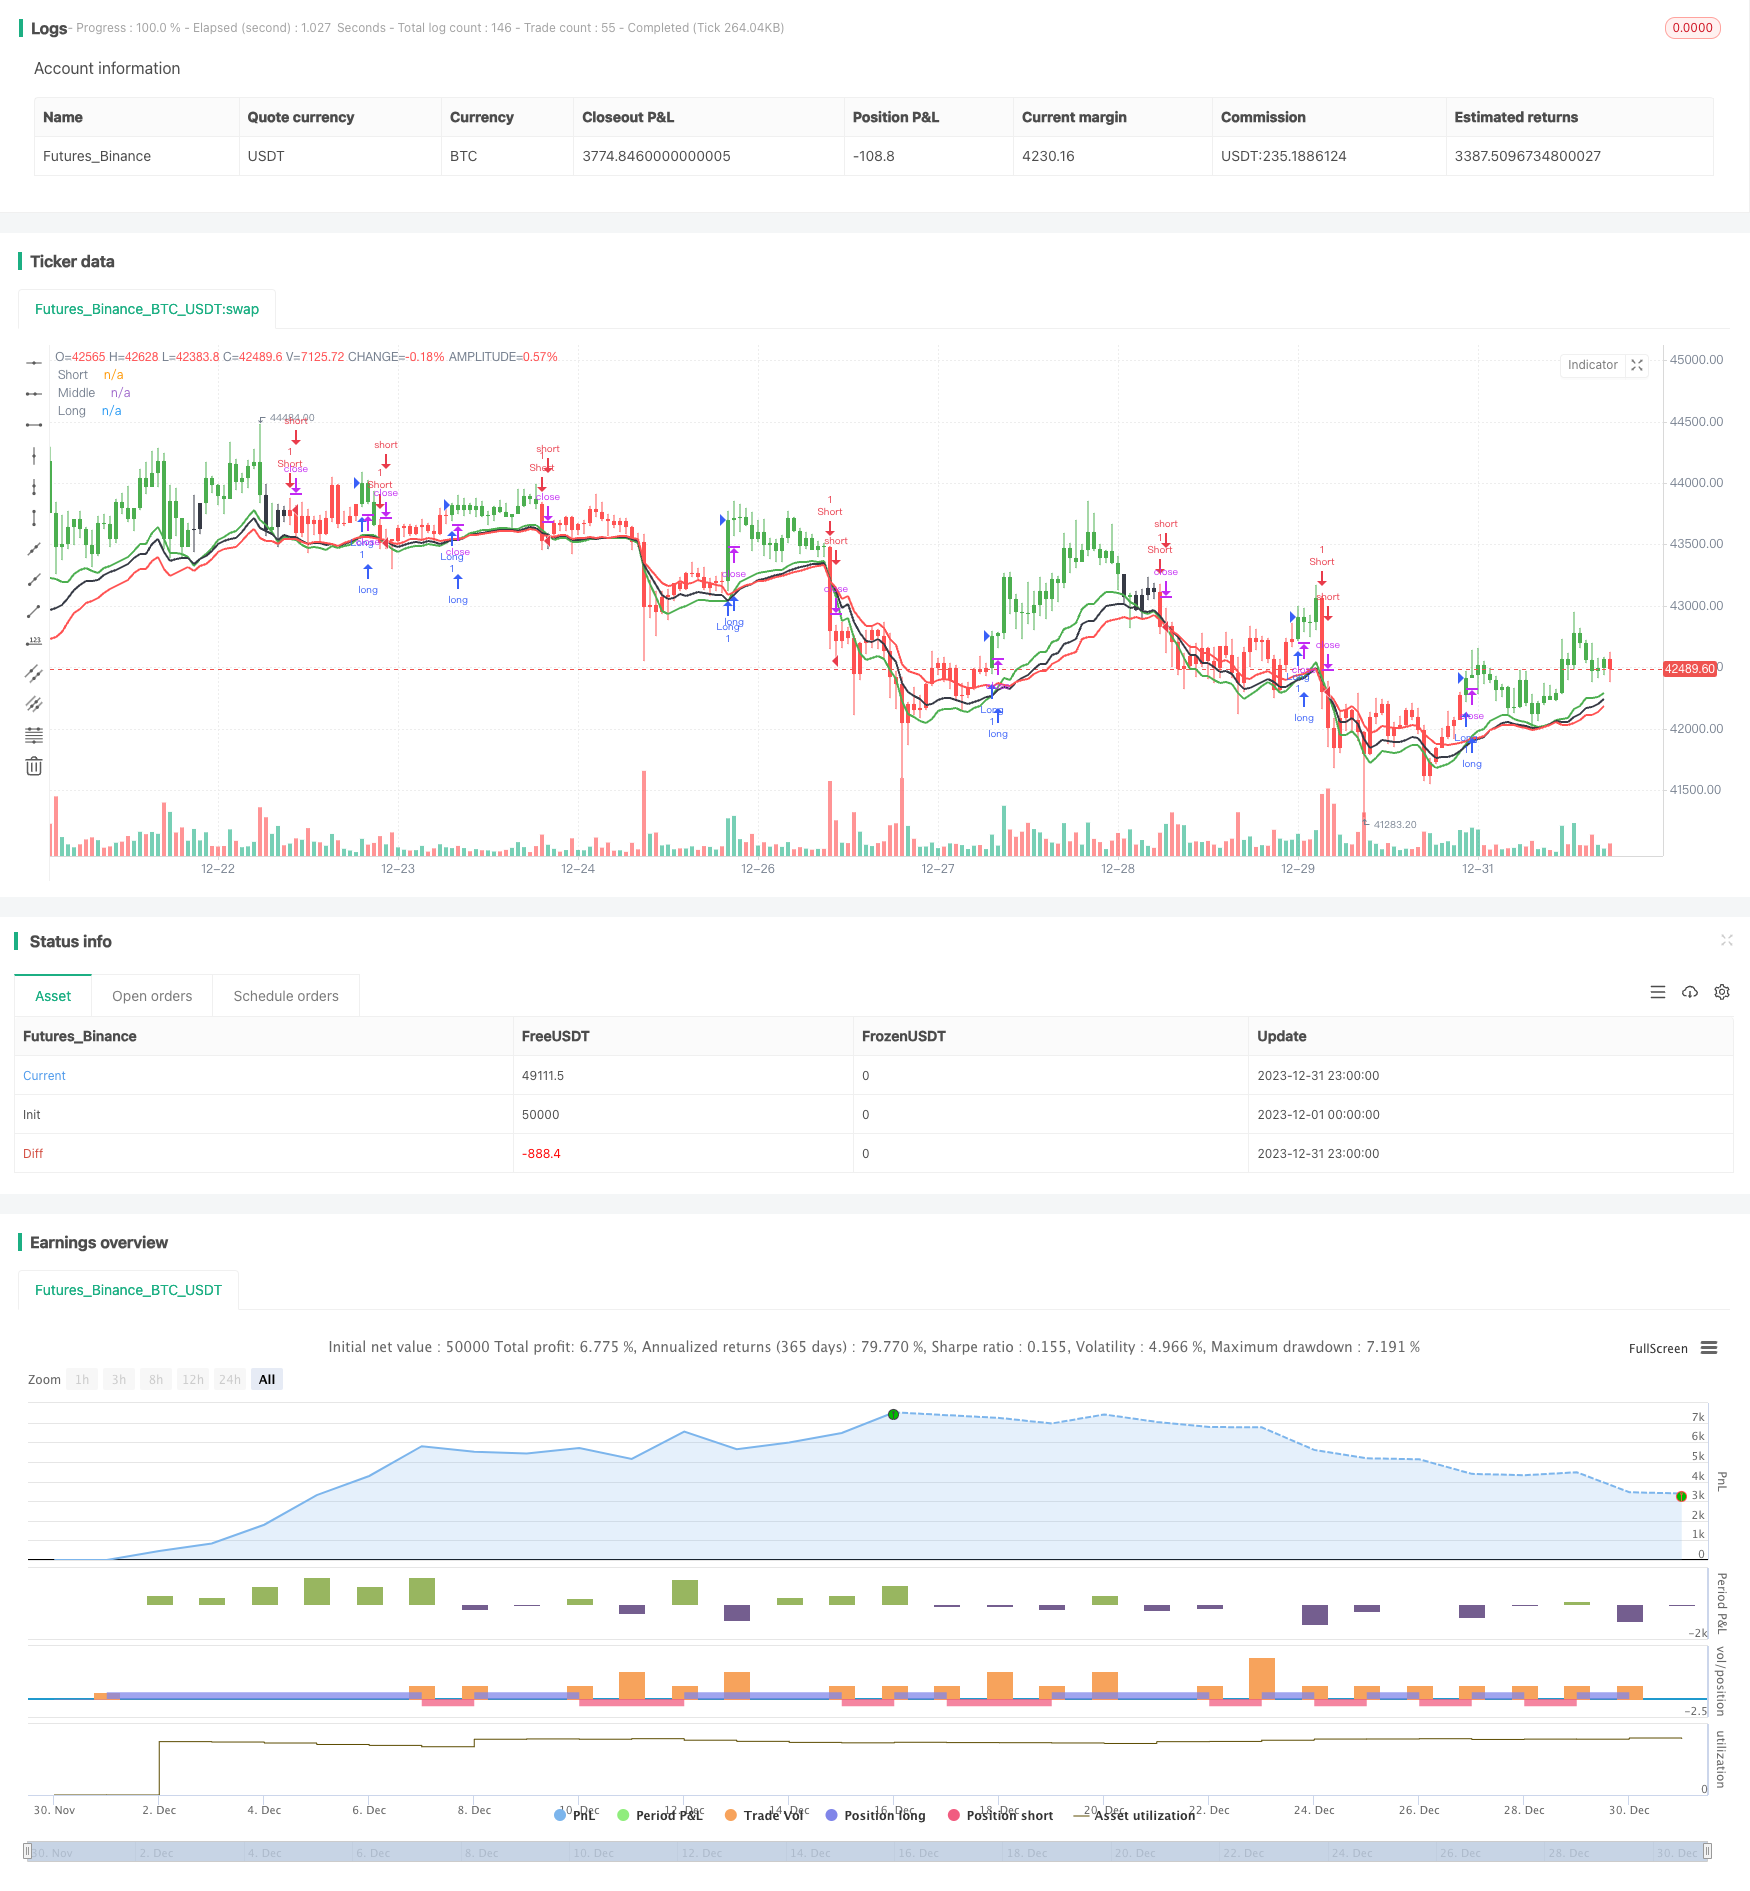
该策略是一个基于趋势指标的量化交易策略。它主要利用三条不同周期的移动平均线,结合ATR指标来跟踪市场趋势,辅助判断入市出市时机。
该策略使用了9日(短期)、15日(中期)和24日(长期)三条移动平均线。其中,9日线和15日线用于判断趋势方向和入市时机,24日线用于判断止盈和止损。同时,该策略还结合了ATR指标来动态调整移动平均线,以更好地适应市场波动。
具体来说,当短期移动平均线上穿中期移动平均线,并且收盘价大于短期移动平均线时,表明行情开始进入趋势,此时可以建立多头头寸。当短期移动平均线下穿长期移动平均线,或收盘价低于长期移动平均线时,表示趋势反转,应当平仓止损或建立空头头寸。
此外,该策略还使用了柱状图颜色来直观地显示趋势方向。当短期线大于中期线时为绿色,小于长期线时为红色。
- 使用三条不同周期的移动平均线组合,可以更准确判断趋势方向
- 应用ATR指标进行移动平均线的动态调整,可以更好地跟踪波动性市场
- 设置长短线止盈止损机制,可以有效控制风险
- 柱状图颜色的视觉效果,形成有效的形态信号,操作更为明确
- 在横盘整理的市场中,容易产生错误信号
- 参数设置(如周期参数)不当可能导致交易频繁或失去良好入场时机
- 可考虑结合其他指标过滤入场信号,例如交易量,MACD等
- 可以测试不同的参数组合,寻找最优参数
该策略整体来说是一个较为稳健的趋势跟踪策略。它可以有效捕捉中长线趋势,同时设置止损止盈机制控制风险。但该策略对参数和市场状态比较敏感,需进一步优化以适应更多市场环境。
||
This is a trend-based quantitative trading strategy. It mainly uses three moving average lines with different periods, combined with the ATR indicator, to track market trends and assist in determining entry and exit timing.
The strategy uses three moving average lines of 9 days (short-term), 15 days (medium-term), and 24 days (long-term). Among them, the 9-day and 15-day lines are used to determine the trend direction and entry timing, while the 24-day line is used to determine profit-taking and stop-loss. At the same time, the strategy also incorporates the ATR indicator to dynamically adjust the moving average lines to better adapt to market fluctuations.
Specifically, when the short-term moving average line crosses above the medium-term moving average line, and the closing price is greater than the short-term moving average line, it indicates that the trend is starting to emerge, and long positions can be established at this point. When the short-term moving average line crosses below the long-term moving average line, or the closing price is below the long-term moving average line, it signifies a trend reversal, so existing positions should be closed for stop loss or short positions can be initiated.
In addition, the strategy also uses the bar color to intuitively display the trend direction. The bars are colored green when the short-term line is above the medium-term line, and red when below the long-term line.
- Using a combination of three moving average lines with different periods can judge the trend direction more accurately
- Applying ATR-based dynamic adjustment of moving average lines adapts better to volatile markets
- Setting long and short stop-loss/profit-taking mechanisms effectively manages risks
- Visual effects of the bar colors form effective pattern signals, making trading actions clearer
- Prone to generating false signals in range-bound markets
- Improper parameter settings (e.g. period parameters) may lead to over-trading or missing good entry opportunities
- Consider incorporating other filters for entry signals, such as volume, MACD etc.
- Different parameter combinations can be tested to find the optimal parameters
Overall this is a relatively robust trend-following strategy. It can effectively capture medium to long term trends, while setting stop loss/profit taking mechanisms to control risks. But the strategy is sensitive to parameters and market conditions, requiring further optimization to adapt to more market environments.
[/trans]
Strategy Arguments
| Argument | Default | Description |
|---|---|---|
| v_input_1 | 9 | ShortTerm Period |
| v_input_2 | 15 | MidTerm Period |
| v_input_3 | 24 | LongTerm Period |
| v_input_4 | 5 | Invesment Term |
| v_input_5 | 5 | ATR Period |
| v_input_6 | true | Barcolor |
Source (PineScript)
/*backtest
start: 2023-12-01 00:00:00
end: 2023-12-31 23:59:59
period: 1h
basePeriod: 15m
exchanges: [{"eid":"Futures_Binance","currency":"BTC_USDT"}]
*/

// This source code is subject to the terms of the Mozilla Public License 2.0 at https://mozilla.org/MPL/2.0/
// © ceyhun

//@version=4
strategy("Chaloke System Strategy",overlay=true)

P1=input(9,title="ShortTerm Period")
P2=input(15,title="MidTerm Period")
P3=input(24,title="LongTerm Period")
P4=input(5,title="Invesment Term")
P5=input(5,title="ATR Period")
Barcolor=input(true,title="Barcolor")

Sm=2*P5/10
ATRX=Sm*atr(P4)
S=ema(close,P1)-ATRX
M=ema(close,P2)-ATRX
Lg=ema(close,P3)-ATRX

Sht=iff(close==highest(close,3),S,ema(close[1],P1)-ATRX)
Mid=iff(close==highest(close,3),M,ema(close[1],P2)-ATRX)
Lng=iff(close==highest(close,3),Lg,ema(close[1],P3)-ATRX)

colors=iff(Sht>Mid and close > Sht ,color.green,iff(close < Lng or Sht<Lng,color.red,color.black))

plot(Sht,"Short",color=color.green,linewidth=2)
plot(Mid,"Middle",color=color.black,linewidth=2)
plot(Lng,"Long",color=color.red,linewidth=2)

barcolor(Barcolor ? colors :na)

long =  crossover(Sht,Mid) and close > Sht
short = crossunder(Sht,Lng) or close < Lng

if long
    strategy.entry("Long", strategy.long, comment="Long")

if short
    strategy.entry("Short", strategy.short, comment="Short")

alertcondition(long, title='Long', message='Chaloke System Alert Long')
alertcondition(short, title='Short', message='Chaloke System Alert Short')
Detail
https://www.fmz.com/strategy/440320
Last Modified
2024-01-29 11:46:15
