Name
计算RSI指标和平滑移动平均线反转策略RSI-Reversal-Strategy
Author
ChaoZhang
Strategy Description
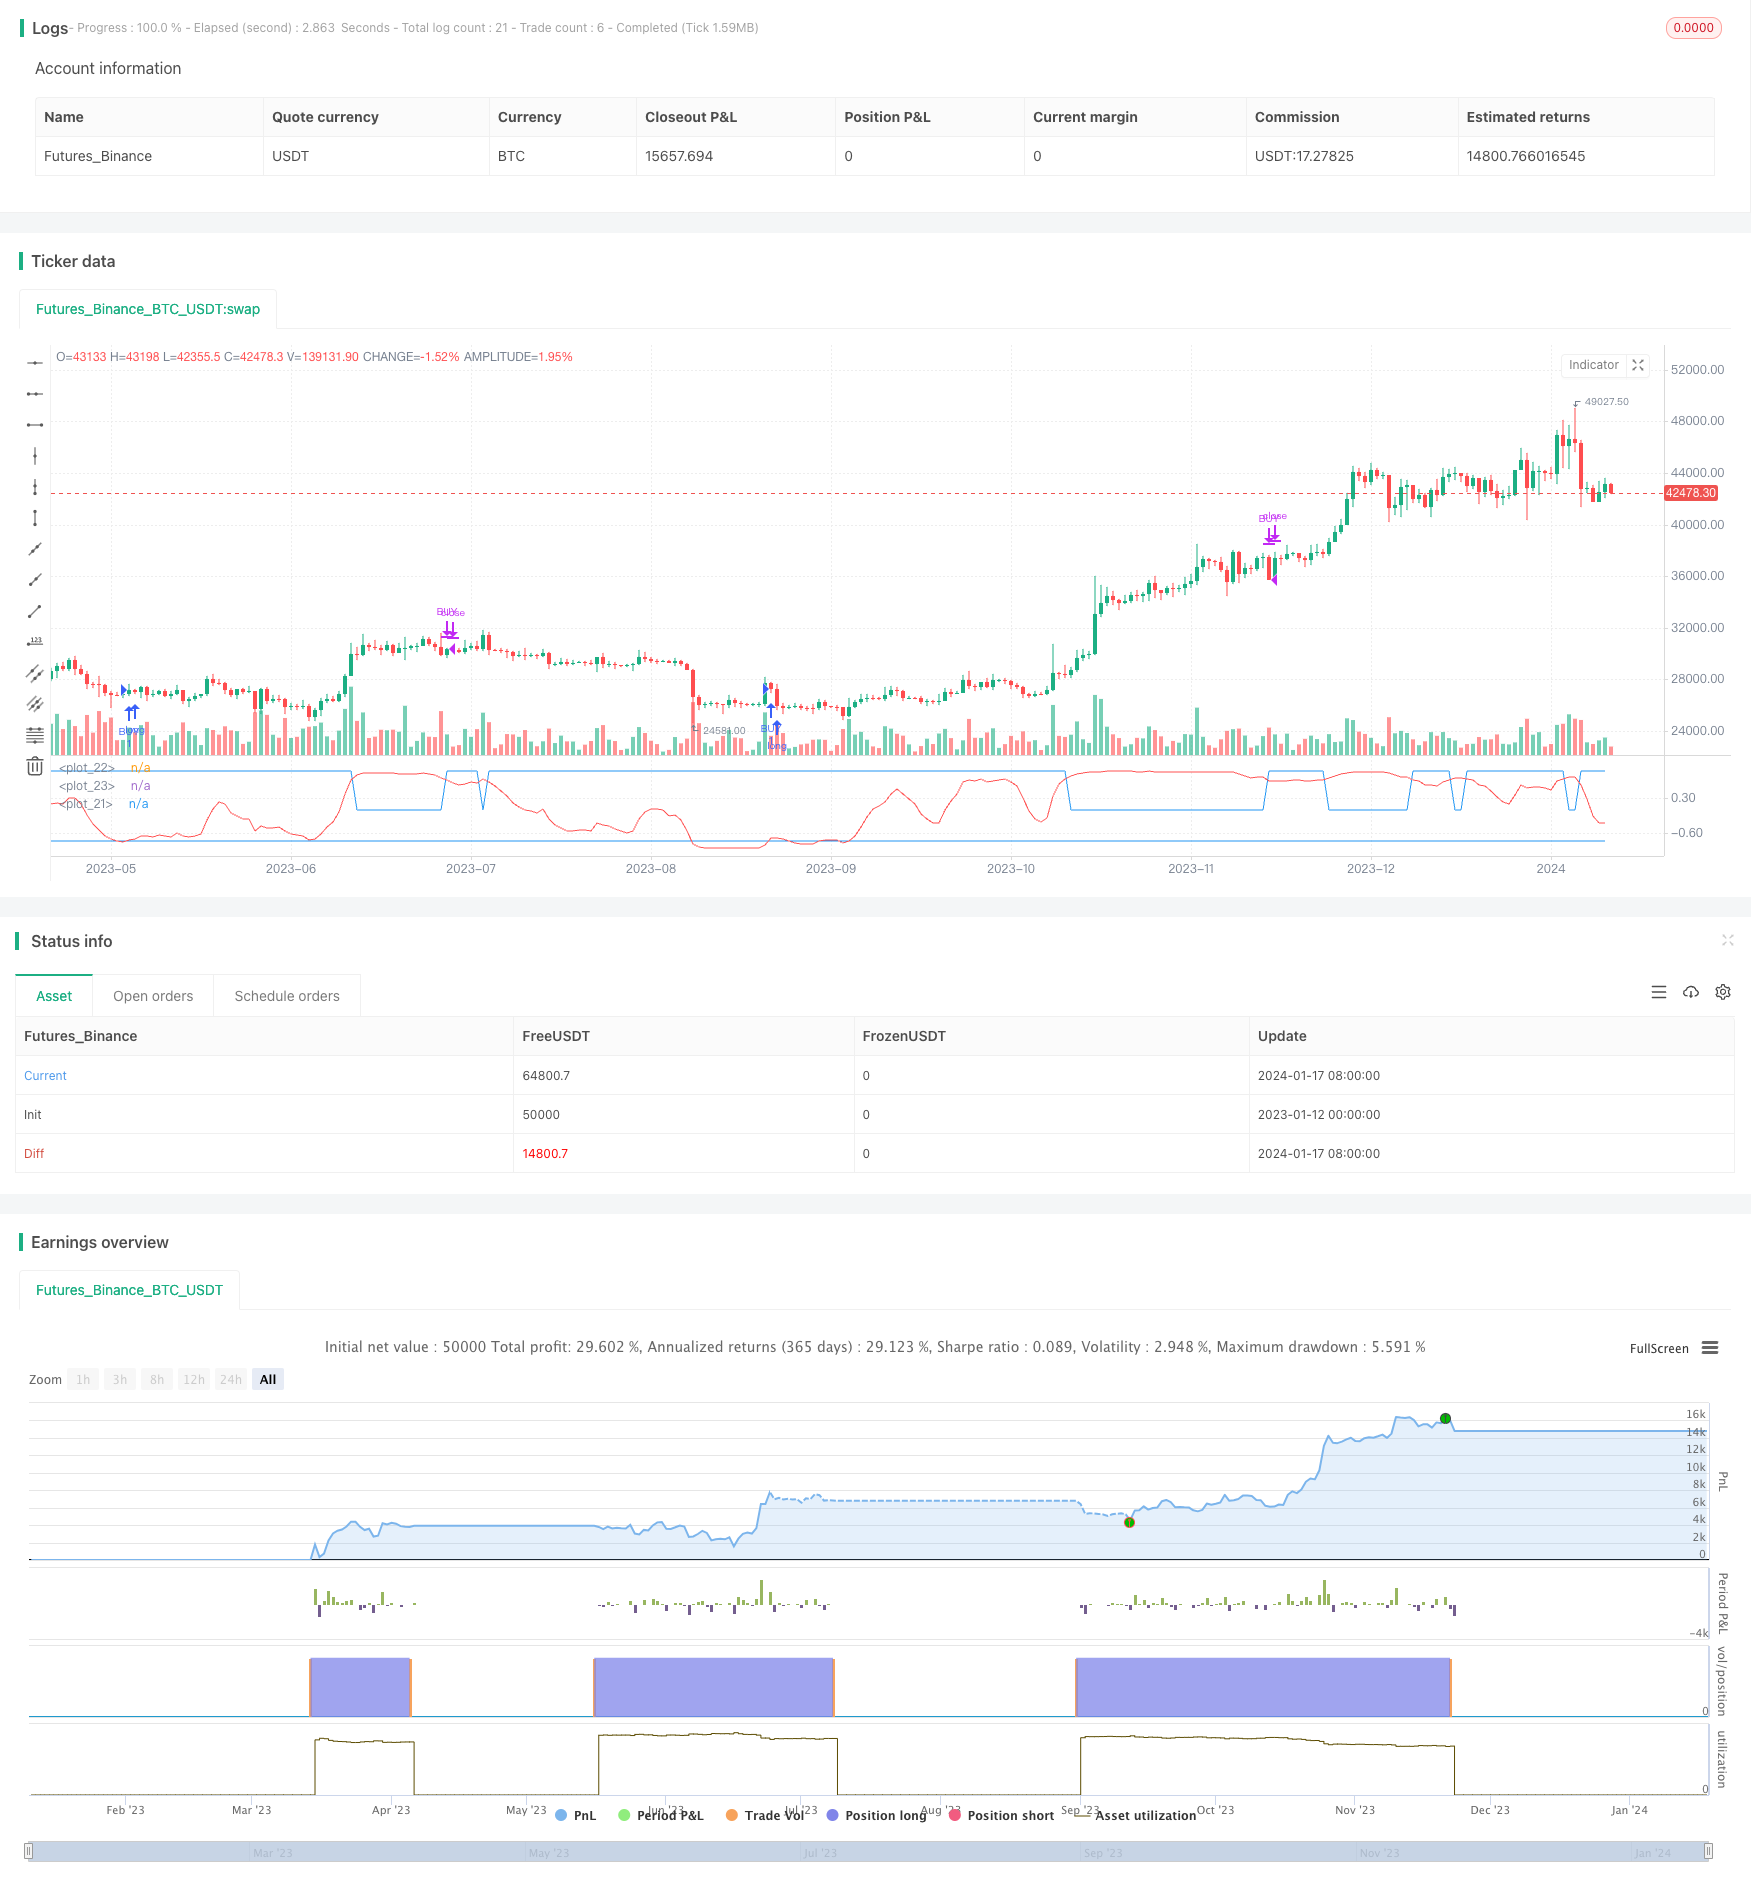
RSI反转策略通过计算RSI指标和平滑移动平均线,判断股票是否处于超买或超卖状态,从而产生买入和卖出信号。该策略借助RSI指标的反转特征,在股票价格反转时获利。
该策略首先计算14周期的RSI值,并进行0-100正规化处理。然后计算5周期RSI的加权移动平均,再通过反正切函数将其映射到-1到1之间。当映射后的RSI上穿-0.8时产生买入信号,下穿1时产生卖出信号。这里通过映射和判断阈值的方法,检测到RSI指标的反转信号。
该策略还设定了运行的月份和日期范围,使其只在指定的月份和日期运行。
- 利用RSI指标的反转特征,在股价反转点产生交易信号,捕捉反转机会。
- 对RSI进行映射和判断阈值,使信号更加明确。
- 可配置运行月份和日期,灵活运用。
- RSI反转信号可能出现误报,从而导致交易信号错误。可通过调整RSI参数或增加其他指标过滤来减少误报。
- 仅依赖RSI单一指标容易墙头信号,可引入其他指标或因子构建机制,提高策略稳定性。
- 固定的月份和日期范围可能错过其他时间段的交易机会,可配置更加灵活的运行时间。
- 测试更多组合的参数,找到RSI和移动平均线周期的最佳匹配。
- 增加成交量或波动率等指标来确认反转信号,减少误报。
- 优化和调整运行月份、日期的范围,覆盖更多交易机会。
- 增加止损机制来控制风险。
RSI反转策略通过构建RSI指标的反转交易规则,简单有效地捕捉价格反转机会。该策略易于实施,但可通过参数优化、风控机制增强等进行优化,使之成为稳定盈利的量化交易策略。
||
The RSI reversal strategy calculates the RSI indicator and smoothed moving average to determine if a stock is overbought or oversold, thereby generating buy and sell signals. This strategy leverages the reversal characteristic of the RSI indicator to profit when stock prices reverse.
The strategy first calculates the 14-period RSI and normalizes it to 0-100. Then it calculates the 5-period weighted moving average of RSI, and maps it to -1 to 1 using the tangent function. When the mapped RSI crosses above -0.8, a buy signal is generated. When it crosses below 1, a sell signal is generated. The mapping and threshold judgement methods are used here to detect the reversal signals of the RSI indicator.
The strategy also sets the running month and date range so that it only runs during specified months and dates.
- Utilizes the reversal characteristic of RSI indicator to generate trading signals at price reversal points and capture reversal opportunities.
- Mapping and threshold judgement on RSI make the signals clearer.
- Configurable running months and dates, flexible to utilize.
- RSI reversal signals may have false signals, resulting in incorrect trading signals. This can be reduced by adjusting RSI parameters or adding other filters.
- Relying solely on a single RSI indicator makes it vulnerable to fake signals. Adding other indicators or factors can improve strategy stability.
- Fixed months and date range may miss trading opportunities during other time periods. More flexible running time can be configured.
- Test more parameter combinations to find optimal matches between RSI and moving average periods.
- Add indicators like volume or volatility to confirm reversal signals and reduce false signals.
- Optimize and adjust the running months and date range to cover more trading opportunities.
- Add stop loss mechanisms to control risks.
The RSI reversal strategy effectively captures price reversal opportunities by constructing simple reversal trading rules based on the RSI indicator. The strategy is easy to implement, but can be enhanced via parameter optimization, risk control mechanisms etc, making it a stable profitable quantitative trading strategy.
[/trans]
Strategy Arguments
| Argument | Default | Description |
|---|---|---|
| v_input_1 | 14 | RSI Main Period |
| v_input_2 | 5 | RSI Smooth Period |
| v_input_3 | 6 | monthfrom |
| v_input_4 | 12 | monthuntil |
| v_input_5 | true | dayfrom |
| v_input_6 | 31 | dayuntil |
Source (PineScript)
/*backtest
start: 2023-01-12 00:00:00
end: 2024-01-18 00:00:00
period: 1d
basePeriod: 1h
exchanges: [{"eid":"Futures_Binance","currency":"BTC_USDT"}]
*/

//@version=3
strategy(title="RSI Reverse", shorttitle="RSI Reverse")


RSI_main = input(14, title="RSI Main Period")
RSI_smooth = input(5, title="RSI Smooth Period")

//Functions
RVS(input) => (exp(2*input)-1) / (exp(2*input)+1)

//RSI Calculation
raw_RSI=0.1*(rsi(close,RSI_main)-50)
wma_RSI=wma(raw_RSI,RSI_smooth)
RVS_RSI = RVS(wma_RSI)


threshold1 = RVS_RSI < 0.8? 1 : 0
threshold2 = -0.8


plot(RVS_RSI,color=red)
plot(threshold1,color=blue)
plot(threshold2,color=blue)

buycon = crossover(RVS_RSI,threshold2)
sellcon = crossunder(RVS_RSI , threshold1)

monthfrom =input(6)
monthuntil =input(12)
dayfrom=input(1)
dayuntil=input(31)


if (  buycon  )
    strategy.entry("BUY", strategy.long, stop=close, oca_name="TREND", comment="BUY")

else
    strategy.cancel(id="BUY")


if ( sellcon)

    strategy.close("BUY")
Detail
https://www.fmz.com/strategy/439347
Last Modified
2024-01-19 14:24:09
