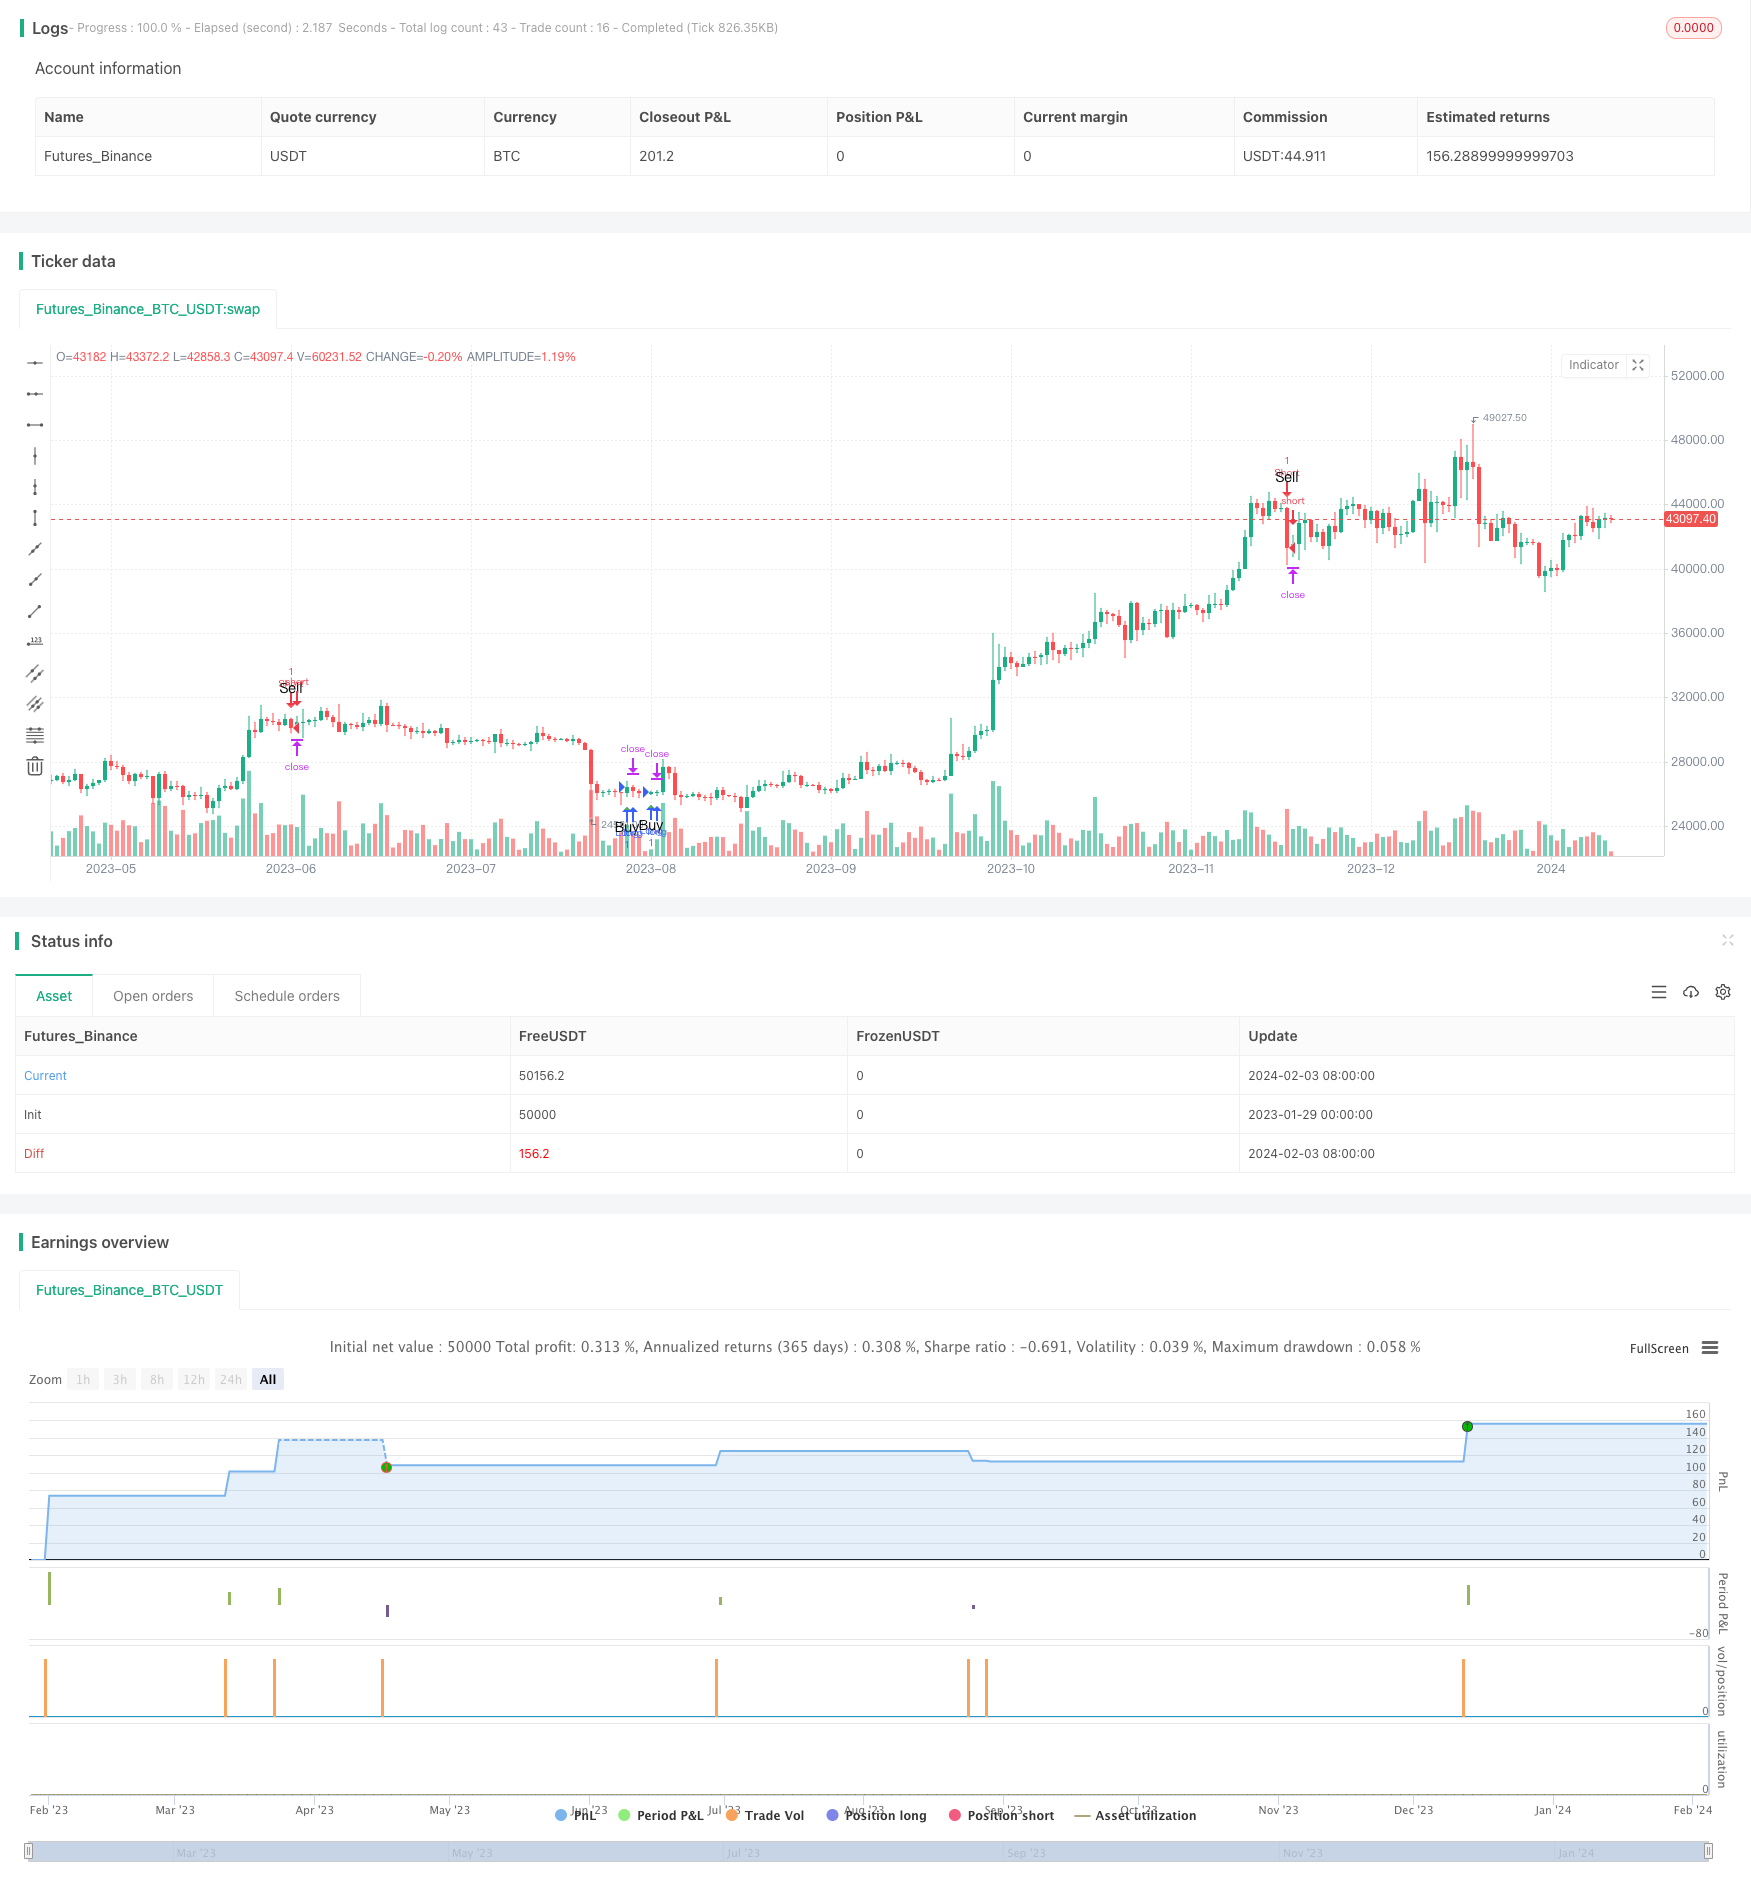
Name
蜡烛包裹RSI交易策略Engulfing-Candle-RSI-Trading-Strategy
Author
ChaoZhang
Strategy Description
蜡烛包裹RSI交易策略是一种试图利用蜡烛形态分析和相对强弱指数(RSI)指标的组合来产生交易信号的策略。它对RSI指标的两端水平,以及多头和空头的蜡烛包裹形态进行检测,并产生交易信号。
该策略的核心思想是结合使用RSI和蜡烛线形态分析。
关于RSI,该策略设置了两端水平,分别是过买水平(默认70)和过卖水平(默认30)。当RSI高于过买水平时产生RSI超买信号,当RSI低于过卖水平时产生RSI超卖信号。这表示价格可能反转。
关于蜡烛形态分析,策略检测是否出现多头或空头的蜡烛包裹形态。多头蜡烛包裹指今日收盘价高于昨日开盘价,且昨日收盘价低于昨日开盘价。空头蜡烛包裹则相反,其中今日收盘价低于昨日开盘价,且昨日收盘价高于昨日开盘价。根据推理,这些蜡烛形态通常标志着价格的反转点。
综合以上,当多头蜡烛包裹发生时,若之前也有RSI超卖信号,则产生买入信号。而当空头蜡烛包裹发生时,若之前也有RSI超买信号,则产生卖出信号。通过这种组合,策略试图在价格反转点捕捉趋势。
该策略有以下几个主要优势:
-
结合使用了RSI指标和蜡烛形态分析,综合利用了两种不同类型的技术分析手段,可以使信号更加可靠。
-
RSI指标常用于判断价格反转点。结合蜡烛形态验证,可以更准确判断反转的时机。
-
蜡烛形态包裹常在价格反转点出现。与RSI指标组合使用,可以使交易信号更加及时。
-
该策略交易机会较多,适合频繁交易。由于仅关注RSI和蜡烛形态,无需其他复杂条件判定,交易机会较多。
-
可以灵活调整RSI参数,适应不同品种和市场环境,提高策略的适应性。
该策略也存在一些风险,主要是:
-
蜡烛形态分析和RSI指标都可能产生假信号,导致不必要的亏损。
-
策略可能因RSI和蜡烛形态分析判断错误而错过主要趋势方向。
-
市场剧烈波动时,止损可能被突破,造成大额亏损。
-
过于频繁交易可能增加交易成本和滑点成本。
为控制这些风险,可以从以下几个方面进行优化:
-
适当调整RSI参数,或增加其他指标过滤,减少假信号。
-
增加趋势判断指标,避免逆势交易。
-
优化止损策略,在市场突破时及时止损。
-
适当缩减交易频率,控制成本。
该策略还可以从以下几个方面进行进一步优化:
-
增加移动止损策略,让止损随价格波动而自动调整,减少止损被突破的概率。
-
增加其他指标或条件来过滤信号,如MACD,布林带等,使信号更加可靠。
-
在高波动产品中,可以设置ATR止损以自动调整止损幅度。
-
对交易品种进行统计分析,优化RSI参数的设置,使其更符合该品种的特点。
-
结合机器学习方法如回归分析,学习哪些RSI和蜡烛形态参数组合对品种交易效果最佳。
-
增加自适应调整RSI参数和止损幅度的功能模块,使策略参数动态优化。
通过这些优化,可以减少交易风险,提高策略稳定性,并使策略对市场的适应性更强。
总之,该策略利用RSI指标和蜡烛形态判定价格反转点,在反转点捕捉趋势。它综合运用两种类型分析方法形成交易信号。该策略具有交易频率高、灵活适应性强等优势。但也存在一些风险如产生假信号和止损被套等。通过参数优化、风险控制等手段可以降低这些风险。该策略有进一步优化的空间,通过持续优化和改进,可以成为一个稳定可靠的交易策略。
||
The Engulfing Candle RSI trading strategy is a strategy that tries to generate trading signals by combining candlestick pattern analysis and the Relative Strength Index (RSI) indicator. It detects RSI overbought/oversold levels and bullish/bearish engulfing candlestick patterns to produce trade signals.
The core idea of this strategy is to use RSI and candlestick pattern analysis together.
For RSI, the strategy sets two levels - overbought level (default 70) and oversold level (default 30). When RSI is above overbought level, it generates an RSI overbought signal. When RSI is below oversold level, it generates an RSI oversold signal. This indicates potential price reversals.
For candlestick pattern analysis, the strategy detects if bullish or bearish engulfing patterns occur. A bullish engulfing is when today's close price is above yesterday's open price, and yesterday's close price is below yesterday's open price. A bearish engulfing is the opposite, where today's close price is below yesterday's open price, and yesterday's close price is above yesterday's open price. These candlestick patterns usually signify turning points in price.
In summary, when a bullish engulfing occurs, if there were also RSI oversold signals before, a buy signal is generated. When a bearish engulfing occurs, if there were also RSI overbought signals before, a sell signal is generated. Through this combination, the strategy tries to catch trends at reversal points.
The main advantages of this strategy are:
-
Combines RSI indicator and candlestick pattern analysis, utilizing two different types of technical analysis tools to make signals more reliable.
-
RSI is commonly used to identify price reversals. Combining with candlestick pattern confirmation can determine reversal timing more precisely.
-
Engulfing candlestick patterns often occur at price reversal points. Using together with RSI can make trade signals more timely.
-
The strategy has abundant trading opportunities, suitable for frequent trading. Due to its simplicity by only considering RSI and candlestick patterns, trade signals are more frequent.
-
RSI parameters can be flexibly tuned for different products and market environments, improving the adaptiveness of the strategy.
There are also some risks with this strategy:
-
Both candlestick patterns and RSI may generate false signals, causing unnecessary losses.
-
The strategy may miss major trend direction if judging RSI and candlestick patterns incorrectly.
-
Stop loss may be penetrated during high market volatility, causing huge losses.
-
Too frequent trading may increase transaction and slippage costs.
To control these risks, some optimization can be done:
-
Fine tune RSI parameters, or add other indicators for filtering to reduce false signals.
-
Add trend detection indicators to avoid counter trend trading.
-
Optimize stop loss strategies to stop out timely during market penetration.
-
Appropriately reduce trading frequency to control costs.
Some other aspects this strategy can be further optimized:
-
Add moving stop loss so that stop loss can adjust automatically based on price fluctuation, reducing the chance of stop loss penetration.
-
Add other indicators or conditions to filter signals, e.g. MACD, Bollinger Bands etc, making signals more reliable.
-
Use ATR stop loss in high volatile products to automatically adjust stop loss size.
-
Statistically analyze products and optimize RSI parameters based on product characteristics.
-
Use machine learning like regression analysis to study optimal RSI and candlestick parameters combination for best strategy performance.
-
Add adaptive adjustment functionality for RSI parameters and stop loss size, enabling dynamic strategy parameter optimization.
Through these optimizations, trading risks can be reduced, strategy robustness improved, and adaptiveness to market enhanced.
In summary, this strategy identifies price reversal points using RSI and candlestick patterns to catch trends at turning points. It combines two types of analysis methods to generate trading signals. The strategy has advantages like high trading frequency and strong flexibility. But there are also risks like false signals and stop loss penetration. By optimizing parameters, controlling risks etc, these weaknesses can be improved. There is room for further enhancing this strategy. Through continuous optimization and refinement, it can become a robust and reliable trading strategy.
[/trans]
Strategy Arguments
| Argument | Default | Description |
|---|---|---|
| v_input_1_close | 0 | rsiSource: close |
| v_input_2 | 14 | rsi length |
| v_input_3 | 70 | rsi overbought level |
| v_input_4 | 30 | rsi over sold level |
| v_input_5 | 20 | Stop Loss (in pips) |
| v_input_6 | 40 | Take Profit (in pips) |
Source (PineScript)
/*backtest
start: 2023-01-29 00:00:00
end: 2024-02-04 00:00:00
period: 1d
basePeriod: 1h
exchanges: [{"eid":"Futures_Binance","currency":"BTC_USDT"}]
*/

//@version=4
strategy("EngulfingCandle Strategy", overlay=true)

// Your existing definitions
bullishCandle=close >= open[1] and close[1] < open[1]
bearishCandle=close <= open[1] and close[1] > open[1]

// RSI Definitions
rsiSource=input(close, title="rsiSource")
rsiLenghth=input(14, title="rsi length", type=input.integer)
rsiOverBought=input(70, title="rsi overbought level", type=input.integer)
rsiOverSold=input(30, title="rsi over sold level", type=input.integer)

rsiValue=rsi(rsiSource, rsiLenghth)
isRSIOB=rsiValue >= rsiOverBought
isRSIOS=rsiValue <= rsiOverSold

// Trade Signal
tradeSignal=((isRSIOS or isRSIOS[1] or isRSIOS[2]) and bullishCandle ) or ((isRSIOB or isRSIOB[1] or isRSIOB[2]) and bearishCandle)

// Stop Loss and Take Profit Inputs
sl_pips = input(20, title="Stop Loss (in pips)")
tp_pips = input(40, title="Take Profit (in pips)")

// Calculating Stop Loss and Take Profit Prices
long_sl = close - syminfo.mintick * sl_pips
long_tp = close + syminfo.mintick * tp_pips
short_sl = close + syminfo.mintick * sl_pips
short_tp = close - syminfo.mintick * tp_pips

// Entering and Exiting Trades
if (tradeSignal and bullishCandle)
    strategy.entry("Long", strategy.long)
    strategy.exit("Exit Long", "Long", stop=long_sl, limit=long_tp)

if (tradeSignal and bearishCandle)
    strategy.entry("Short", strategy.short)
    strategy.exit("Exit Short", "Short", stop=short_sl, limit=short_tp)

// Plotting
plotshape(tradeSignal and bullishCandle, title="Bullish", location=location.belowbar, color=color.green, style=shape.triangleup, text="Buy")
plotshape(tradeSignal and bearishCandle, title="Bearish", location=location.abovebar, color=color.red, style=shape.triangledown, text="Sell")
Detail
https://www.fmz.com/strategy/441057
Last Modified
2024-02-05 11:06:58
