Name
精准捕捉趋势反转的移动均线交叉策略Precise-Trend-Reversal-Moving-Average-Crossover-Strategy
Author
ChaoZhang
Strategy Description
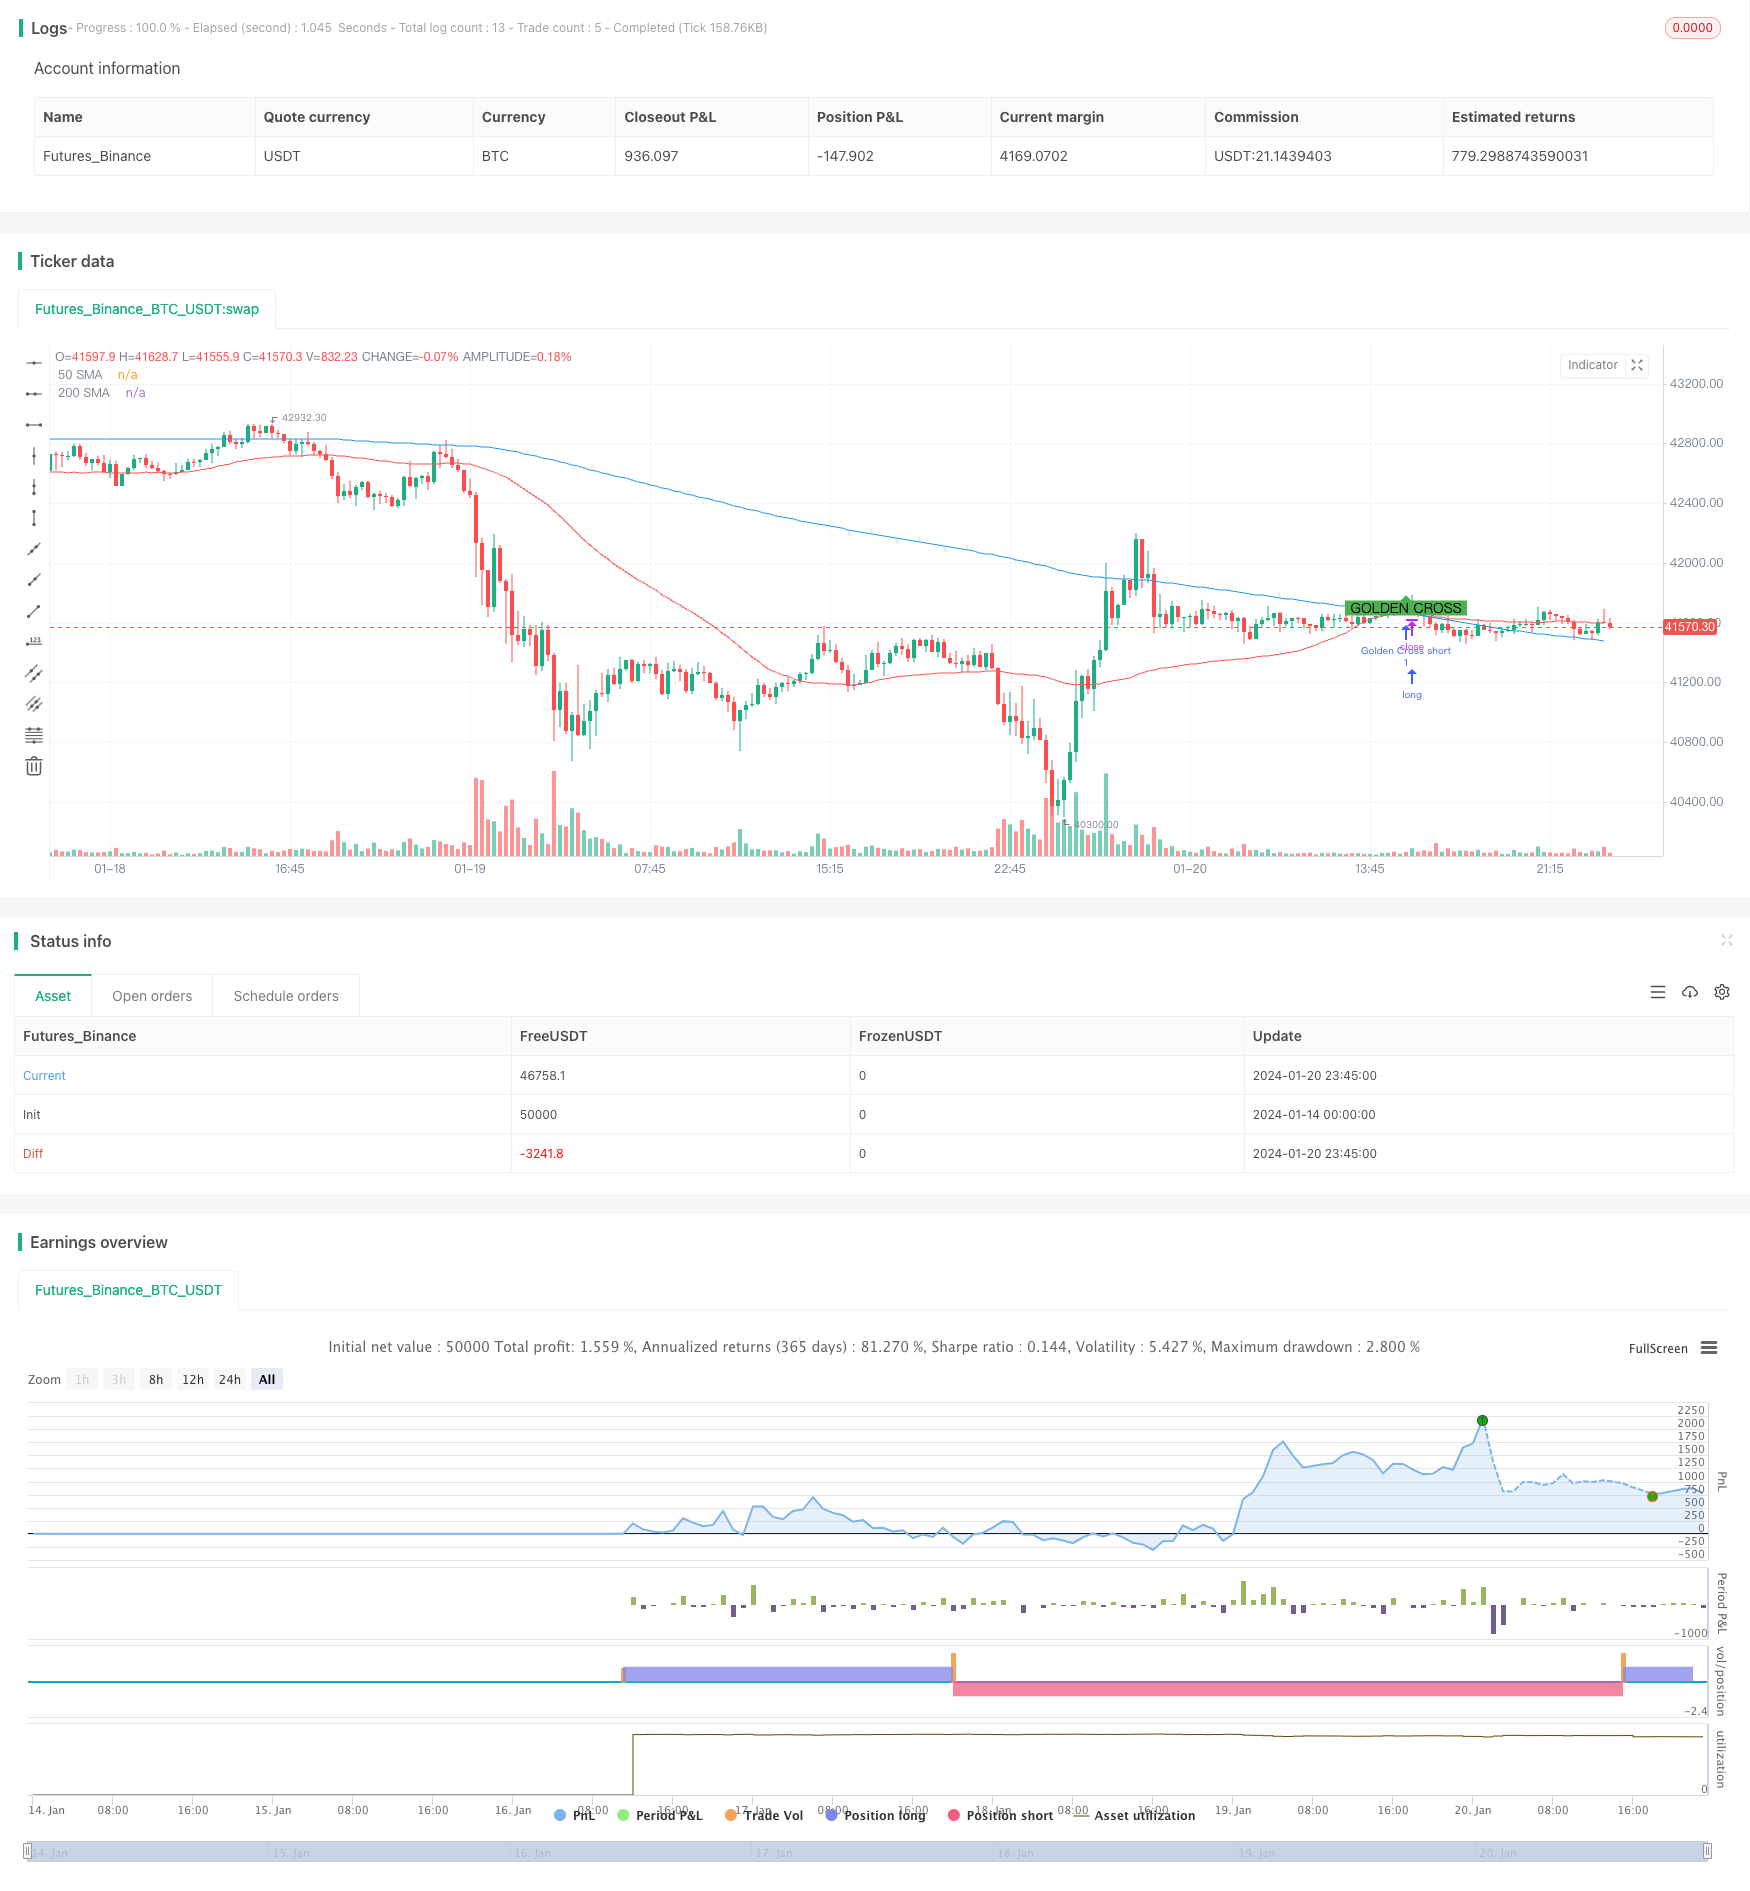
本策略名为“黄金交叉死亡交叉策略”,其主要思想是利用两条不同周期的移动平均线黄金交叉和死亡交叉这两个强大的技术指标信号来捕捉市场趋势的反转,实现低买高卖的效果。
该策略中,我们计算了50周期和200周期的简单移动平均线(SMA)。根据传统理解,当50日线从上方向下跌穿200日线时,称为“死亡交叉”,是迹象看跌的信号。而当50日线从下方向上突破200日线时,称为“黄金交叉”,是迹象看涨的信号。
该策略的交易逻辑就是根据这两个信号的出现来建立头寸。具体来说,策略会在发生“死亡交叉”时做空,在发生“黄金交叉”时做多。这样就可以在市场趋势转折点附近获利了。
此外,策略中还提供了可自定义的回测时间范围功能。这使得我们可以在不同的日期区间内测试策略表现,从中发现这些交叉信号的实际效果。
- 可以有效捕捉市场趋势的反转点,在关键点附近打开仓位获利
- 采用了两个不同周期均线的交叉结合,可以避免错信号
- 提供回测功能来检验策略在不同市况下的实际表现
- 绘图清晰,可以直观看到交叉信号和仓位变化
- 均线交叉信号存在滞后,无法预测极端行情的反转
- 回测数据可能与实盘数据有差异,实际表现会受限于交易成本和滑点
- 策略参数如均线周期的选择会对结果产生很大影响
- 需关注基本面形势和技术形态,不能机械交易
针对风险,我们可以调整均线参数,结合其他指标过滤信号,做好资金管理,实盘验证策略,以减少实际风险。
该策略主要可以从以下几个方面进行优化:
- 测试不同均线周期的组合效果
- 增加成交量或波动率等过滤指标,避免常见套路
- 结合经济数据或者基本面消息作为过滤
- 考虑止损策略,如移动止损或者时间止损
- 评估不同持仓时间的效果
通过测试不同参数对策略表现的影响,我们可以找到更好的均线交叉交易方案。
该策略利用移动平均线交叉这一经典技术指标信号来捕捉市场关键的转折点。策略逻辑简单清晰,同时提供了方便的回测功能。我们可以作为趋势跟踪的组成部分,辅助判断行情。当然实盘中仍需考虑各种外部因素,不能依赖单一指标盲目交易。
||
This strategy is named "Golden Cross Death Cross Strategy". Its core idea is to capitalize on the powerful signals generated by the golden cross and death cross of two moving averages of different timeframes to catch trend reversals in the market and profit from low-buying/high-selling.
In this strategy, we calculate the 50-period and 200-period Simple Moving Average (SMA) lines. Traditionally, when the 50-day SMA crosses below the 200-day SMA, it is called a "death cross" which signals a bearish outlook. And when 50-day SMA crosses above 200-day SMA, it is a "golden cross" indicating bullishness.
The trading logic is simply to take positions based on these signals - shorting at death cross and going long at golden cross. This allows us to profit around inflection points when market trend reverses.
In addition, the strategy provides customizable date ranges for backtests. So we can examine the actual effectiveness of these crossover signals over different periods.
- Effectively catches trend reversal points to open positions near key areas
- Combination of two SMAs of different periods filters out false signals
- Backtesting feature examines actual performance across market regimes
- Clean plots visually display crossover signals and position changes
- SMA crosses lag extreme reversals and cannot predict them
- Backtest data may differ from live performance due to costs and slippage
- Parameter selections like SMA periods greatly affect results
- Need to incorporate fundamentals and technicals, not just mechanical trading
To address the risks, we can optimize parameters, add filters, manage risk, paper trade the strategy etc. to minimize risks.
The main ways to optimize this strategy include:
- Testing SMAs of different period combinations
- Adding filters like volume, volatility to avoid whipsaws
- Incorporating economic data or news for filter
- Implement stop loss mechanisms like moving/time stops
- Evaluating performance over different holding periods
By examining the parameter impacts, we can discover better moving average crossover systems.
This strategy leverages the classic technical indicator of moving average crosses to capture key inflection points in markets. With simple logic and convenient backtest features, it can aid in tracking trends as part of a broader system. But real-world trading still requires considering various external factors, not just relying on signals blindly.
[/trans]
Strategy Arguments
| Argument | Default | Description |
|---|---|---|
| v_input_int_1 | true | (?DATE CONFIG)Start Date |
| v_input_int_2 | true | Start Month |
| v_input_int_3 | 2023 | Start Year |
| v_input_int_4 | 31 | End Date |
| v_input_int_5 | 12 | End Month |
| v_input_int_6 | 2023 | End Year |
| v_input_bool_1 | false | USE SPECIFIC DATE ? |
Source (PineScript)
/*backtest
start: 2024-01-14 00:00:00
end: 2024-01-21 00:00:00
period: 15m
basePeriod: 5m
exchanges: [{"eid":"Futures_Binance","currency":"BTC_USDT"}]
*/

//@version=5
strategy("[S_R__9] - Death and Golden Cross", overlay=true)

// Specific Time Date Range For Backtest
startDate = input.int(title='Start Date', defval=1, minval=1, maxval=31, group='DATE CONFIG')
startMonth = input.int(title='Start Month', defval=1, minval=1, maxval=12, group='DATE CONFIG')
startYear = input.int(title='Start Year', defval=2023, minval=1800, maxval=2100, group='DATE CONFIG')

endDate = input.int(title='End Date', defval=31, minval=1, maxval=31, group='DATE CONFIG')
endMonth = input.int(title='End Month', defval=12, minval=1, maxval=12, group='DATE CONFIG')
endYear = input.int(title='End Year', defval=2023, minval=1800, maxval=2100, group='DATE CONFIG')

SPECIFIC_DATE = input.bool(title='USE SPECIFIC DATE ?', defval=false, group='DATE CONFIG')

inDateRange = SPECIFIC_DATE ? time >= timestamp(syminfo.timezone, startYear, startMonth, startDate, 0, 0) and time < timestamp(syminfo.timezone, endYear, endMonth, endDate, 0, 0) : true

// Calculate 50 SMA and 200 SMA
sma50 = ta.sma(close, 50)
sma200 = ta.sma(close, 200)

// Detect a Death Cross (50 SMA crossing below 200 SMA)
deathCross = ta.crossunder(sma50, sma200)
// Detect a Golden Cross (50 SMA crossing above 200 SMA)
goldenCross = ta.crossover(sma50, sma200)

// Strategy Execution
if (inDateRange)
    if (deathCross)
        strategy.entry("Death Cross long", strategy.short)

    if (goldenCross)
        strategy.entry("Golden Cross short", strategy.long)

// Plot SMAs
plot(sma50, color=color.red, title="50 SMA")
plot(sma200, color=color.blue, title="200 SMA")

// Plotting Death Cross signal
plotshape(series=deathCross and inDateRange, title="Death Cross Signal", location=location.belowbar, color=color.red, style=shape.labeldown, text="DEATH CROSS")

// Plotting Golden Cross signal
plotshape(series=goldenCross and inDateRange, title="Golden Cross Signal", location=location.abovebar, color=color.green, style=shape.labelup, text="GOLDEN CROSS")
Detail
https://www.fmz.com/strategy/439621
Last Modified
2024-01-22 12:14:29
