Name
突破EMA滑动止损三角策略Elevated-Touch-Short-Triangle-Strategy
Author
ChaoZhang
Strategy Description
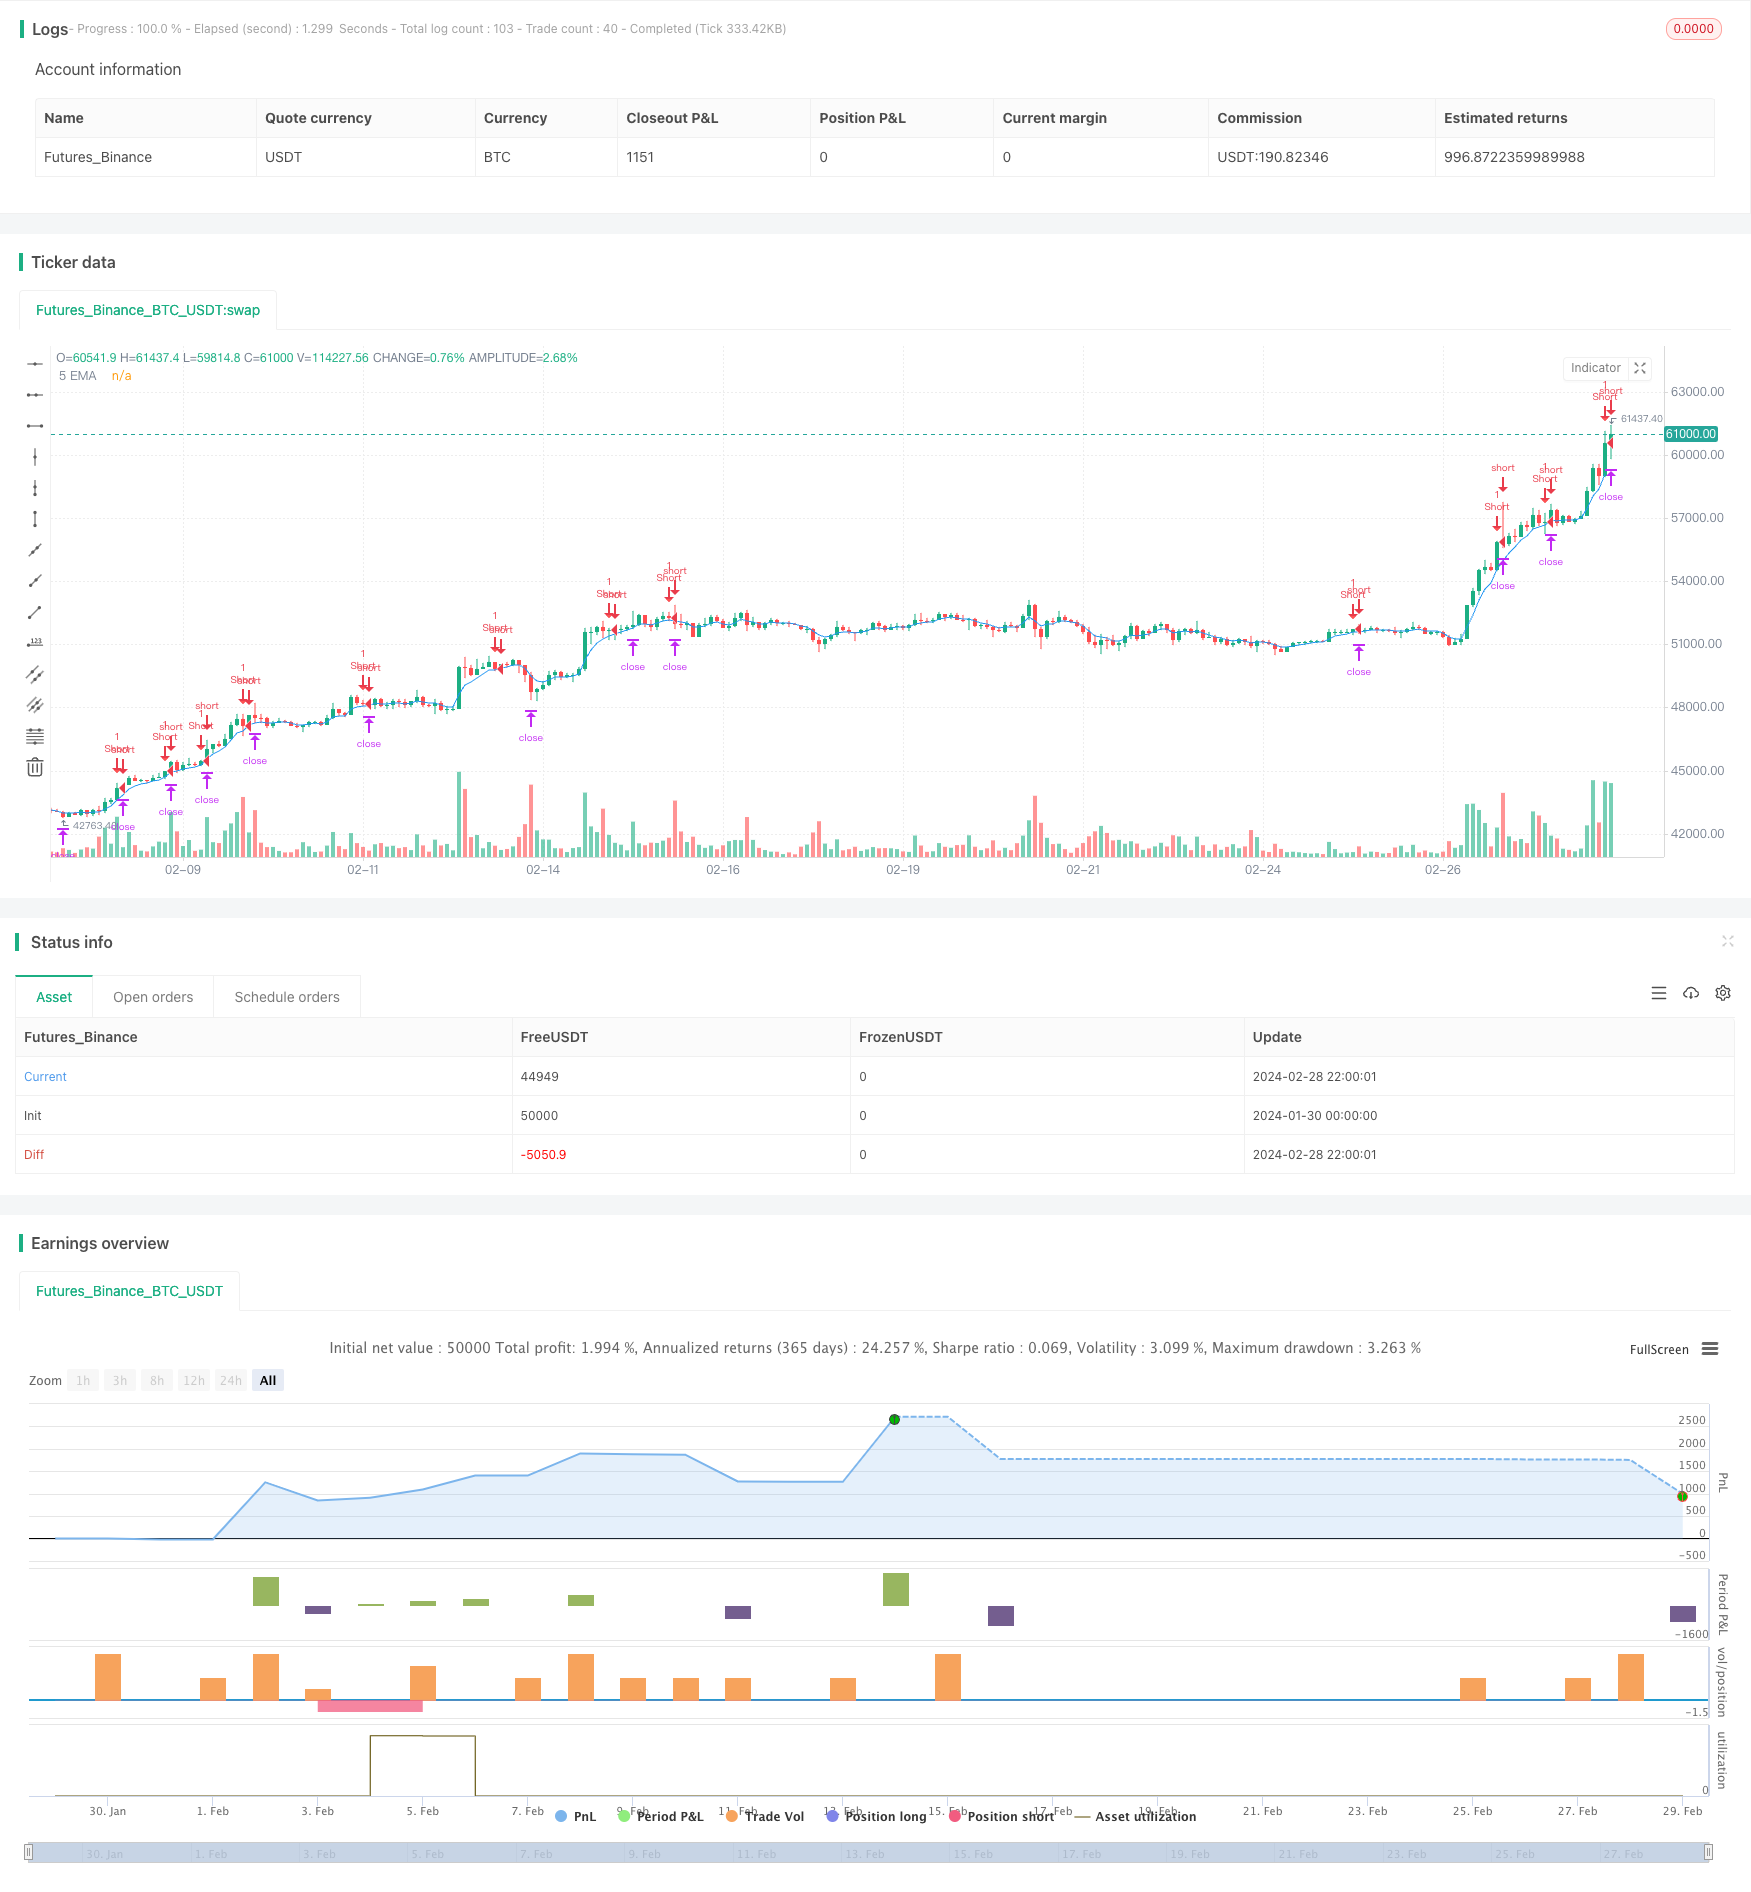
这个策略是基于EMA指标的突破交易策略,当价格突破EMA时看作入场信号,采取三角止损方式设置止损位和止盈位,具有较高的获利可能性。
该策略通过计算5日EMA作为指标,当收盘价从上方触碰5日EMA时,作为做空信号;然后设置入场价格为信号生成柱的高点,止损位为前一根K线的最高点,止盈位为入场价格减去风险值的3倍(假设止盈止损比例为2:1)。这样当价格突破EMA向下时,我们做空;如果价格重新回升,止损点可以将损失控制在一定范围;而三角止盈可以获得较好的风险回报比率。
这是一个较简单的突破EMA的策略,具有如下优势:
- 规则简单清晰,容易实施;
- EMA能很好地描绘价格趋势,利用突破信号易获利;
- 采用三角止盈止损,可以获得较高的盈亏比;
- 可视化的止损止盈位有助于风险控制。
该策略也存在一些风险:
- 市场突然发生巨大变动,止损可能无法起到作用;
- EMA指标滞后,可能错过最佳入场时机;
- 三角套可能被套牢,无法止损。
为控制风险,可以结合其他指标判断大趋势,避免逆势交易;也可以根据市场波动程度调整止损幅度。
这是一个较为简单的策略,后续还可以从以下几个方向进行优化:
- 优化EMA周期参数,适应不同周期;
- 增加其他指标判断,提高策略稳定性;
- 采用动态止损方式,根据市场波动程度调整止损幅度;
- 结合交易量等指标避免假突破。
该策略整体是一个简单实用的短期突破EMA策略。它具有规则清晰、容易实现、止盈止损完备等优势,可以获得较好的风险回报比率。但也存在被套风险等问题。后续可以从调整参数、增加指标、动态止损等方面进行优化,使策略更加稳定可靠。
||
This is a breakout trading strategy based on the EMA indicator. When the price breaks through the EMA, it is considered as an entry signal. It adopts triangle stop loss to set the stop loss and take profit, with high profit potential.
The strategy calculates the 5-day EMA as an indicator. When the close price touches the 5-day EMA from above, it is a signal for going short. Then the entry price is set to the high of the signal bar, the stop loss is set to the highest point of the previous bar, and the take profit is set to the entry price minus 3 times the risk value (assuming a 2:1 risk-reward ratio for TP calculation). So when the price breaks through the EMA downward, we go short; if the price rebounds again, the stop loss point can keep the loss within a certain range; and the triangle take profit can achieve a good risk-reward ratio.
This is a relatively simple breakout EMA strategy with the following strengths:
- Simple and clear rules, easy to implement;
- EMA depicts price trends well, easy to profit from breakout signals;
- Triangle stop loss for better risk-reward ratio;
- Visual SL and TP for better risk control.
The strategy also has some risks:
- Sudden huge market change may make SL invalid;
- EMA lag may miss best entry point;
- Triangle trap.
To control risks, we can combine other indicators to determine the major trend, avoid trading against trends; we can also adjust the stop loss range based on market volatility.
This is a simple strategy, and can be improved in the following aspects:
- Optimize EMA parameters for different cycles;
- Add other indicators to improve stability;
- Adopt dynamic SL based on market volatility;
- Combine trading volumes to avoid false breakout.
In summary, this is a simple and practical short-term EMA breakout strategy. It has advantages like clear rules, easy to implement, complete SL and TP. But it also has risks like being trapped. Going forward it can be improved by adjusting parameters, adding indicators, dynamic stops etc., to make the strategy more stable and reliable.
[/trans]
Strategy Arguments
| Argument | Default | Description |
|---|---|---|
| v_input_int_1 | 5 | EMA Period |
Source (PineScript)
/*backtest
start: 2024-01-30 00:00:00
end: 2024-02-29 00:00:00
period: 2h
basePeriod: 15m
exchanges: [{"eid":"Futures_Binance","currency":"BTC_USDT"}]
*/

//@version=5
strategy("Short Entry EMA Strategy with Visual SL and TP", shorttitle="SE-EMA-SL-TP-Viz", overlay=true)

// Customization Inputs
emaPeriod = input.int(5, title="EMA Period", minval=1)

// EMA Calculation
emaValue = ta.ema(close, emaPeriod)
plot(emaValue, title="5 EMA", color=color.blue)

// Detecting Short Entry Conditions
shortEntryCondition = close > emaValue and low <= emaValue and low[1] > emaValue[1] and close[1] > emaValue[1]

// Entry, SL, and TP Logic
if (shortEntryCondition)
    entryPrice = open[1]
    slLevel = high[1]
    risk = slLevel - entryPrice
    tpLevel = entryPrice - risk * 3  // Assuming a 2:1 risk-reward ratio for TP calculation

    // Execute short trade
    strategy.entry("Short", strategy.short)
    strategy.exit("Exit", "Short", stop=slLevel, limit=tpLevel)

    // Visualizing SL and TP levels
    // line.new(bar_index, slLevel, bar_index + 20, slLevel, color=color.red, width=2)
    // line.new(bar_index, tpLevel, bar_index + 20, tpLevel, color=color.green, width=2)

// Plotting Short Entry Signal
plotshape(series=shortEntryCondition, style=shape.triangledown, location=location.abovebar, color=color.red, title="Short Signal")
Detail
https://www.fmz.com/strategy/443231
Last Modified
2024-03-01 11:02:49
