Name
突破交易系统策略Breakout-Trading-System
Author
ChaoZhang
Strategy Description
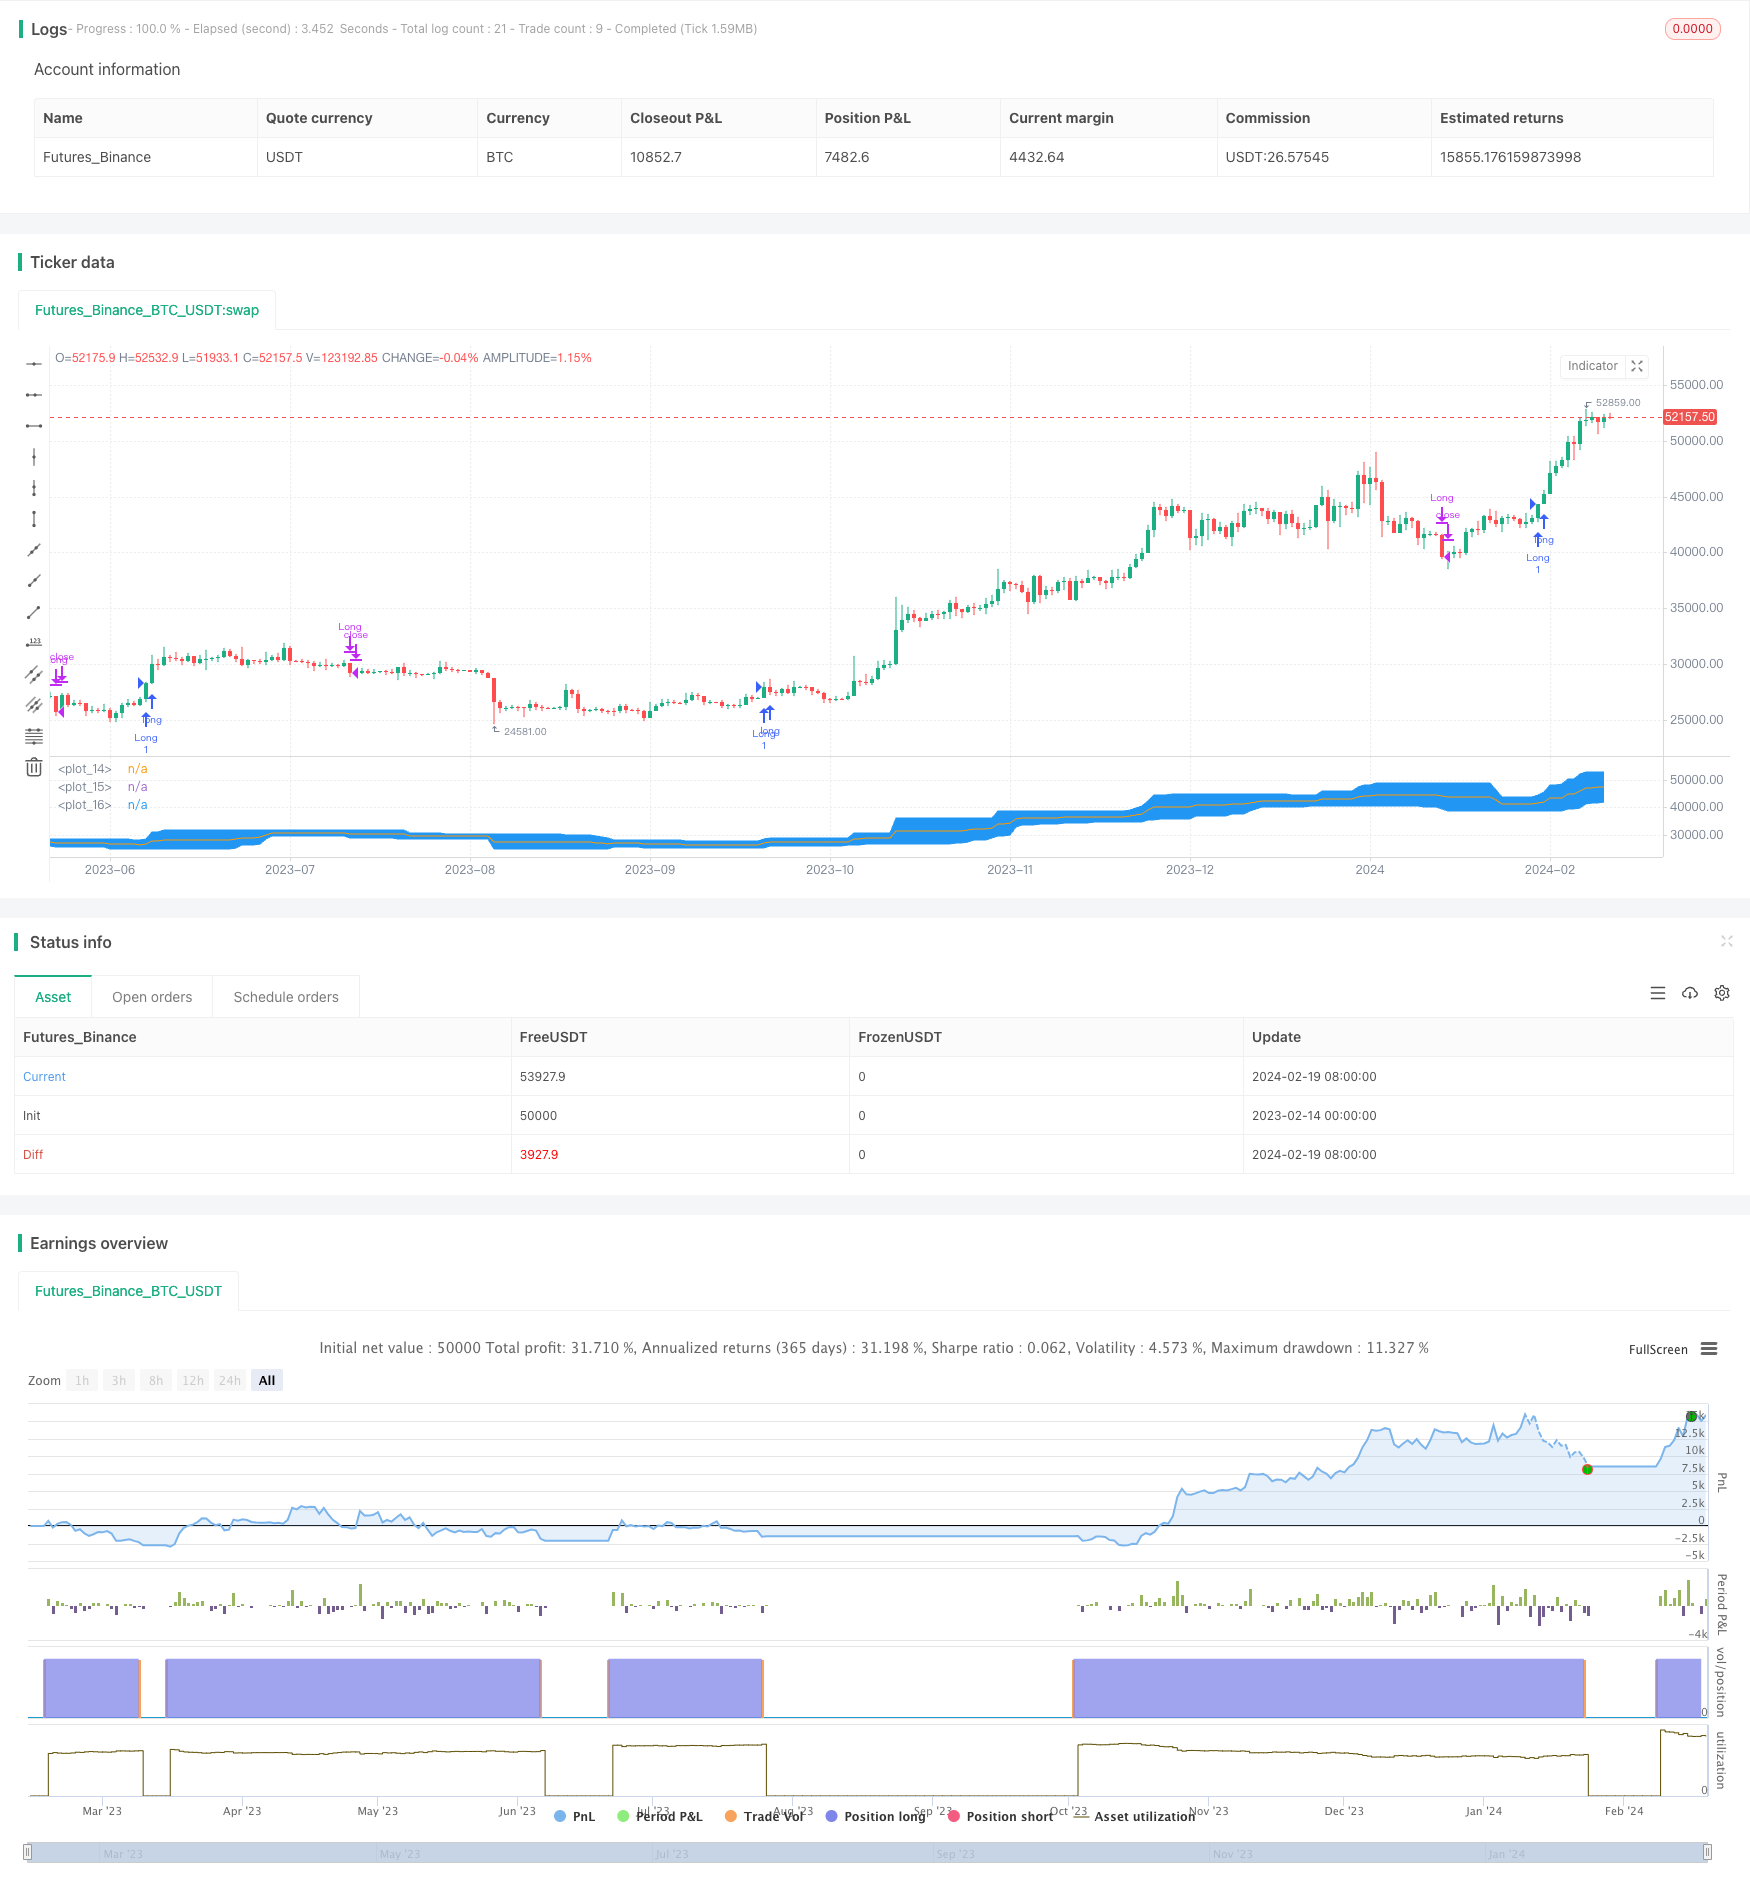
该策略是一个突破交易系统,它主要基于价格的突破来进行买入和卖出操作。该系统使用布林带指标来确定突破的价格区域。当价格从布林带的下轨向上突破时,进行买入操作;当价格从布林带的中轨或下轨向下突破时,进行卖出操作。
该策略使用布林带指标来确定价格的突破区域。布林带由一个n天的简单移动平均线及其标准差的乘数所构成。在这里,我们计算了20天的最高价和最低价的均线来确定布林带的上轨和下轨,以及计算上轨和下轨的平均值作为基线。
当收盘价从下轨向上突破时,表明价格开始进入涨势,这是一个买入信号。当收盘价从中轨或下轨向下突破时,表明涨势结束,需要卖出头寸。该策略利用了价格突破继续向上或向下运行的特性来获利。
- 该策略利用价格的趋势性和惯性来获利,这与市场的本质特征相一致
- 使用布林带指标,可以清晰地看到价格的突破口
- 策略逻辑简单清晰,容易理解和修改
- 可设定止损条件,控制风险
- 布林带并不能完全预测价格行为,价格可能会有剧烈波动
- 突破信号可能是错误的,从而导致交易亏损
- 单纯依靠价格的突破来决定交易时机,容易受到市场噪音的影响
对策:
- 结合其他指标来确认突破信号
- 适当调整参数,确保突破信号有效
- 设置止损来控制单笔亏损
- 可以测试不同参数下的表现,选择最优参数
- 可以结合其他指标来过滤假突破,例如交易量
- 可以结合趋势和反转策略,在不同市场环境中进行交易
- 可以根据不同品种的参数设置进行优化
- 可以结合机器学习算法来预测价格趋势和关键价格点
该策略是一个基于布林带的价格突破交易策略。它利用价格突破的特性来寻找交易机会。优点是简单易懂,容易实现;缺点是可能出现假突破,导致亏损。我们可以通过调整参数、结合其他指标以及设置止损来优化该策略,在回测和实盘中都可以获得不错的效果。总的来说,该策略适用于能充分挖掘价格趋势性的市场环境。
||
This strategy is a breakout trading system that mainly buys and sells based on the breakthrough of prices. The system uses Bollinger Bands to determine the price breakthrough area. When the price breaks through the lower rail of the Bollinger Band upwards, a buy order will be placed. When the price breaks through the middle rail or lower rail of the Bollinger Band downwards, a sell order will be placed.
This strategy uses Bollinger Bands to determine price breakthrough areas. Bollinger Bands consist of a simple moving average line of n days and its standard deviation multiplier. Here we calculate the 20-day moving average of highest price and lowest price to determine the upper and lower rail of Bollinger Bands, as well as the average of upper and lower rail as the baseline.
When the close price breaks through the lower rail upwards, it indicates that the price starts to go up which is a buy signal. When the close price breaks through the middle or lower rail downwards, it indicates that the rising trend ends and positions need to be sold out. This strategy takes advantage of the tendency of prices to continue running up or down after the breakthrough to make profits.
- The strategy makes use of the trending and inertia of prices which is consistent with the essential characteristics of the market
- Bollinger Bands clearly indicate breakthrough prices
- The strategy logic is simple and clear, easy to understand and modify
- Stop loss conditions can be set to control risks
- Bollinger Bands cannot completely predict price behavior, prices may fluctuate dramatically
- Breakthrough signals may be wrong, leading to trading losses
- Relying solely on price breakthroughs to determine trading time can easily be affected by market noise
Solutions:
- Combine other indicators to confirm breakthrough signals
- Adjust parameters appropriately to ensure effective breakthrough signals
- Set stop loss to control single loss
- Test performances under different parameters and select the optimal parameters
- Incorporate other indicators to filter out false breakouts, such as trading volume
- Combine trend and reversal strategies for trading in different market environments
- Optimize based on parameter settings for different varieties
- Incorporate machine learning algorithms to predict price trends and key price points
This is a price breakthrough trading strategy based on Bollinger Bands. It takes advantage of the characteristics of price breakthroughs to identify trading opportunities. The advantages are that it is simple, easy to implement; the disadvantages are that there may be false breakouts leading to losses. We can optimize this strategy by adjusting parameters, incorporating other indicators and setting stop loss to achieve good results in backtesting and live trading. In general, this strategy is suitable for market environments that can fully tap the trending tendency of prices.
[/trans]
Strategy Arguments
| Argument | Default | Description |
|---|---|---|
| v_input_1 | 20 | length |
| v_input_2 | true | Exit Option |
Source (PineScript)
/*backtest
start: 2023-02-14 00:00:00
end: 2024-02-20 00:00:00
period: 1d
basePeriod: 1h
exchanges: [{"eid":"Futures_Binance","currency":"BTC_USDT"}]
*/

// This source code is subject to the terms of the Mozilla Public License 2.0 at https://mozilla.org/MPL/2.0

//Break out trading system works best in a weekly chart and daily chart of Nifty and BankNifty
//@version=4

strategy("Eswar New",shorttitle = "ESW")
length = input(20, minval=1)
exit = input(1, minval=1, maxval=2,title = "Exit Option") // Use Option 1 to exit using lower band; Use Option 2 to exit using basis line

lower = lowest(length)
upper = highest(length)
basis = avg(upper, lower)

l = plot(lower, color=color.blue)
u = plot(upper, color=color.blue)
plot(basis, color=color.orange)
fill(u, l, color=color.blue)

longCondition = crossover(close,upper[1])
if (longCondition)
    strategy.entry("Long", strategy.long)

if(exit==1)
    if (crossunder(close,lower[1]))
        strategy.close("Long")

if(exit==2)
    if (crossunder(close,basis[1]))
        strategy.close("Long")
Detail
https://www.fmz.com/strategy/442363
Last Modified
2024-02-21 14:02:28
