Name
移动平均线回拉策略Moving-Average-Pullback-Strategy
Author
ChaoZhang
Strategy Description
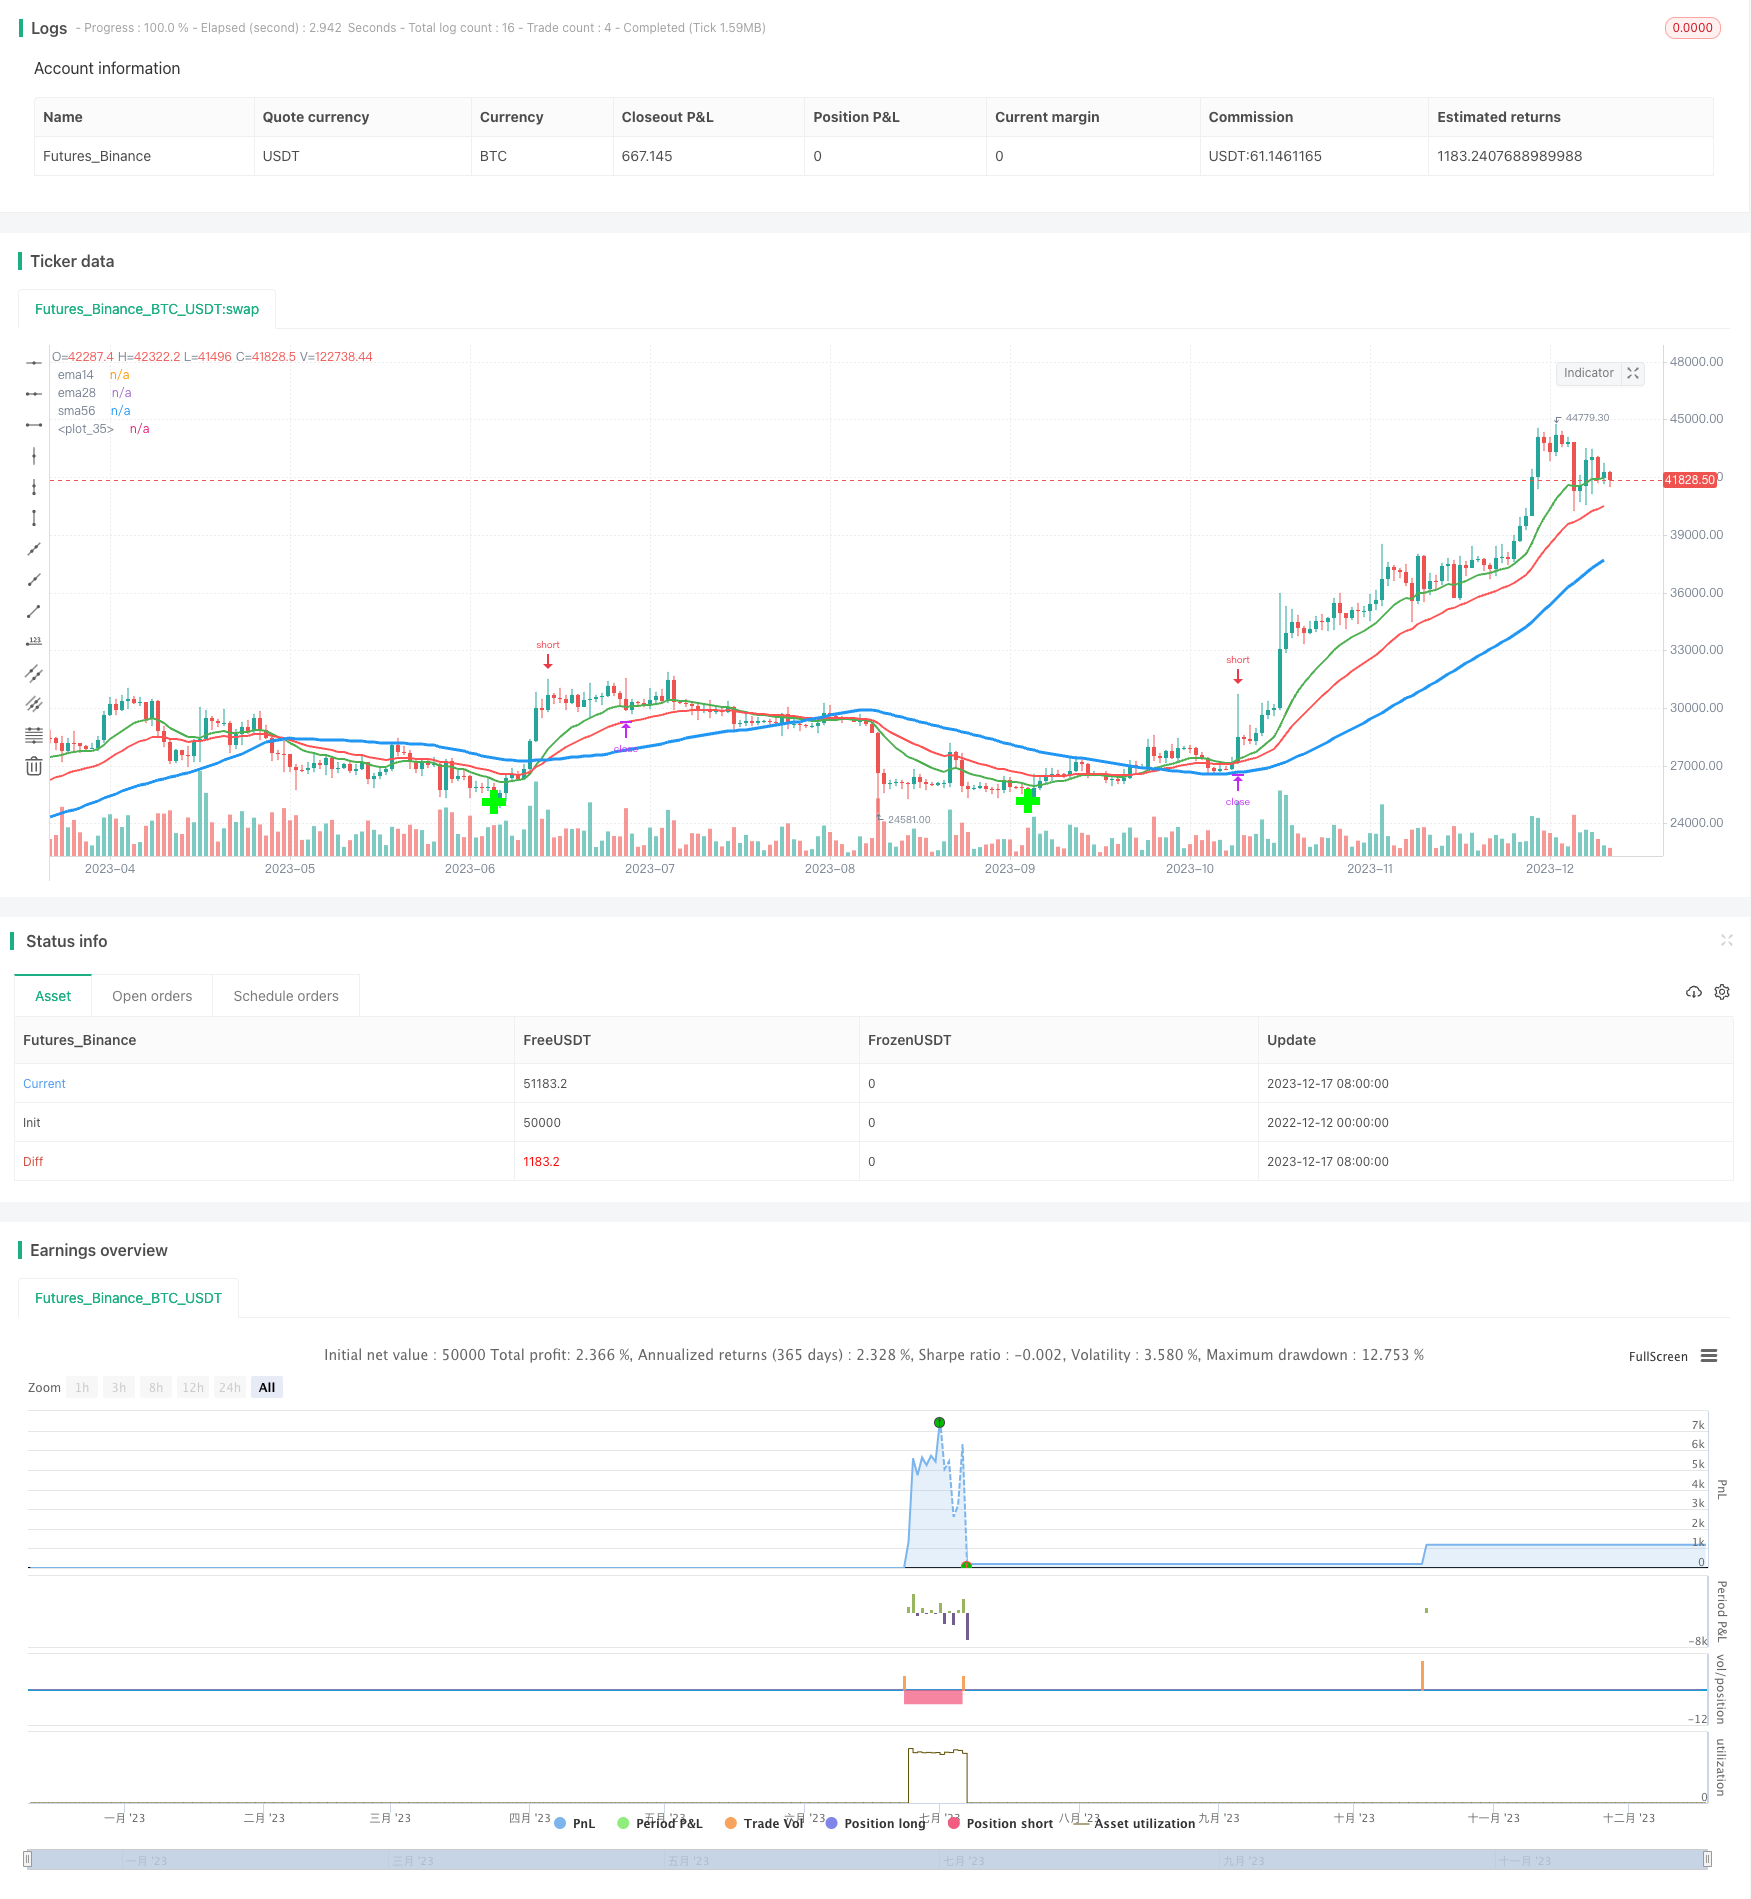
移动平均线回拉策略是一种跟踪股价移动平均线的交叉情况,在发生金叉时判断是否有回拉机会,如果有,则进行逆向操作的量化交易策略。该策略借助Fibonacci回拉线,设定入市点和止损止盈点,实现对短期价格回拉的捕捉。
该策略主要基于两个移动平均线:14日EMA和56日SMA。当14日EMA从下方上穿56日SMA时产生买入信号。此后,代码会回溯20日找到一个低点作为支撑,再结合穿越点的close价格绘制Fibonacci回拉线,以1.272倍回拉线作为 entrance,0.618倍回拉线作为exit。这样,strategy就会在发生金叉后设定一个entry point来做空,如果价格真的出现回拉达到0.618回拉线,则止盈退出。
整个策略主要分为以下几个步骤:
- 计算14日EMA、56日SMA;
- 判断是否发生EMA上穿SMA的金叉信号;
- 回溯找到一个支撑的低点;
- 利用低点与金叉点位置绘制Fibonacci 回拉线;
- 在1.272回拉线设定做空入场点;
- 在0.618回拉线设置止盈点。
以上就是策略的主要流程和工作原理。当价格出现短期的反转回拉时,这套策略可以捕捉这样的机会获利。
这套移动平均线回拉策略主要具有以下几点优势:
- 策略思路清晰简单,容易理解和实现;
- 借助Fibonacci理论设定入场和止损点,风险控制比较好;
- 可以捕捉短期价格反转的机会,获得较好的单笔利润;
- 只需要一个移动平均线金叉信号就可以启动,条件不苛刻。
总的来说,这套策略非常适合用来做短线反转交易,在行情出现一定回调时可以捕捉这样的机会套利。策略实现也比较简单直接。
尽管这套移动平均线回拉策略有它自己的优势,但也存在一定的风险需要注意:
- 长期持有可能造成较大损失。因为我们是逆势做空的,如果行情继续上涨,将面临巨大的损失。
- 回拉幅度过小无法获利。价格回拉幅度太小,无法触及止盈线,无法套现获利。
- 可能出现过高设置风险。回拉线设置过高,无法被触及形成套利机会。需计算合理的回拉区间。
对于上述风险,我们可以设置较短的止损时间,严格控制单笔损失;同时优化回拉线的区间范围,设定合理的目标利润,从而规避部分风险。
这套移动平均线回拉策略还有很多优化的空间,主要可以从以下几个方面入手:
- 测试不同的参数设定,如移动平均线的周期长度、回溯天数、回拉线倍数等,找到最优参数;
2.增加止损机制,可以采用多重止损或移动止损,更好控制风险;
-
结合其他指标 FILTER,避免在不适宜的市场环境中交易;
-
优化资金管理,设定合理的头寸规模和风险敞口。
通过测试和优化参数,这套策略可以进一步改进,从而获得更稳定的交易表现。
移动平均线回拉策略是一个非常实用的短线交易策略。它能捕捉价格在短期内出现的反转机会,通过事先设置的入场点和止损点进行交易。策略思路清晰简单,容易理解和实现。同时也存在一定的交易风险,需要通过参数优化、风险控制等手段进一步完善。总的来说,这是一套值得深入研究和应用的量化策略。
||
The moving average pullback strategy tracks the crossovers of price moving averages, and identifies pullback opportunities to make counter-trend trades when golden crosses occur. This strategy utilizes Fibonacci pullback lines to set entry and stop loss/profit taking levels to capture short-term price pullbacks.
The core of this strategy involves two moving averages - the 14-day EMA and the 56-day SMA. It triggers a buy signal when the 14-day EMA crosses above the 56-day SMA from below. Afterwards, the strategy looks back 20 days to find a swing low as support. Combined with the close price at crossover point, Fibonacci pullback lines are plotted, with 1.272 pullback line as entry and 0.618 as exit. Thus the strategy sets an entry point to go short after golden crosses, and takes profit if prices really pull back to 0.618 line.
The key steps of this strategy are:
- Calculate the 14-day EMA and 56-day SMA;
- Check if the EMA crosses above the SMA golden cross signal;
- Look back to find a swing low for support;
- Plot Fibonacci pullback lines with the low and crossover point;
- Set entry for short at the 1.272 pullback line;
- Set take profit stop at 0.618 pullback line.
The above explains the main workflow and logic behind this pullback strategy. It aims to capture opportunities when prices reverse short-term.
The key advantages of this moving average pullback strategy are:
- The strategy idea is simple and easy to understand;
- Utilize Fibonacci theory to set better risk controls;
- Can capture short-term reversal opportunities for good profits;
- Only requires a moving average golden cross to trigger entries.
In summary, this is very suitable for short-term mean-reversion style trading. It captures pullback chances to profit. The strategy is also simple and straightforward to implement.
Despite the pros, there are also certain risks to note for this strategy:
- Long holding may lead to huge losses, as we are countertrend shorting;
- Pullback magnitude too small to reach take profits;
- Overly aggressive pullback line settings.
To mitigate the risks, we can set a short stop loss timeframe to control losses; also optimize the pullback line ranges to aim for reasonable profit targets.
There is still much room to optimize this moving average pullback strategy:
-
Test different parameter settings on items like moving average periods, lookback days, Fibonacci multiples etc to find optimum;
-
Add stop loss mechanisms like multiple stops or trailing stops to better control risks;
-
Introduce other indicators as FILTERS to avoid unsuitable market conditions;
-
Optimize position sizing and risk management rules.
Through rigorous testing and optimization, significant improvement can be achieved for this trading strategy.
The moving average pullback strategy is a very practical short-term trading strategy. It captures mean-reverting opportunities when prices pull back in the short run. The strategy idea is simple and easy to grasp. There are still risks that need addressing through optimization and risk control. Overall this is a promising quantitative strategy worthy of further research and application.
[/trans]
Strategy Arguments
| Argument | Default | Description |
|---|---|---|
| v_input_1 | 2014 | Backtest Start Year |
| v_input_2 | true | Backtest Start Month |
| v_input_3 | 2 | Backtest Start Day |
| v_input_4 | 2035 | Backtest Stop Year |
| v_input_5 | 12 | Backtest Stop Month |
| v_input_6 | 30 | Backtest Stop Day |
| v_input_7 | 20 | leftBars |
| v_input_8 | 20 | rightBars |
Source (PineScript)
/*backtest
start: 2022-12-12 00:00:00
end: 2023-12-18 00:00:00
period: 1d
basePeriod: 1h
exchanges: [{"eid":"Futures_Binance","currency":"BTC_USDT"}]
*/

//@version=2
strategy("MAC Pullback", overlay=true)

// Setting up timeperiod for testing
startPeriodYear = input(2014, "Backtest Start Year")
startPeriodMonth = input(1, "Backtest Start Month")
startPeriodDay = input(2, "Backtest Start Day")
testPeriodStart = timestamp(startPeriodYear, startPeriodMonth, startPeriodDay, 0, 0)

stopPeriodYear = input(2035, "Backtest Stop Year")
stopPeriodMonth = input(12, "Backtest Stop Month")
stopPeriodDay = input(30, "Backtest Stop Day")
testPeriodStop = timestamp(stopPeriodYear, stopPeriodMonth, stopPeriodDay, 0, 0)

// Moving Averages
ema14 = ema(close, 14)
ema28 = ema(close, 28)
sma56 = sma(close, 56)

// Plot
plot(ema14, title="ema14", linewidth=2, color=green)
plot(ema28, title="ema28", linewidth=2, color=red)
plot(sma56, title="sma56", linewidth=3, color=blue)


// Strategy
goLong = cross(ema14, sma56) and ema14 > ema28
goShort = cross(ema14, sma56) and ema14 < ema28


// Locate Swing Lows
leftBars = input(20)
rightBars=input(20)
swinglow = pivotlow(close, leftBars, rightBars)
plot(swinglow, style=cross, linewidth=8, color=#00FF00, offset=-rightBars)

if goLong == true and time >= testPeriodStart and time <= testPeriodStop
    // We try to make sure that we're catching the first Pullback after the crossover
    if ema14[12] < sma56[12]
        pivotpoint = lowest(40)[0] //lowest value of the month as our swing low

        // We calculate a Fib 1.272 extension (from the previous swing low to
        // the crossover long entry's open) and use this as our entry target to short the Pullback
        extensiontarget = ((close[1] - pivotpoint) * 1.27) + pivotpoint
        shorttarget = ((close[1] - pivotpoint) * 0.618) + pivotpoint

        strategy.order("Pullback", strategy.short, 5.0, limit=extensiontarget)
        // I would like to use a trailing stop but for know we just hope to get
        // filled if the pullback reaches all the way down to the 0.618.
        // We also place a tight stop loss since we trying to short an uptrend
        strategy.exit("Pullback Exit", "Pullback", limit=shorttarget, loss=400)
Detail
https://www.fmz.com/strategy/435851
Last Modified
2023-12-19 11:55:25
