Name
移动平均线与MACD结合的RSI指标交易策略A-Combined-RSI-Strategy-with-Moving-Average-and-MACD
Author
ChaoZhang
Strategy Description
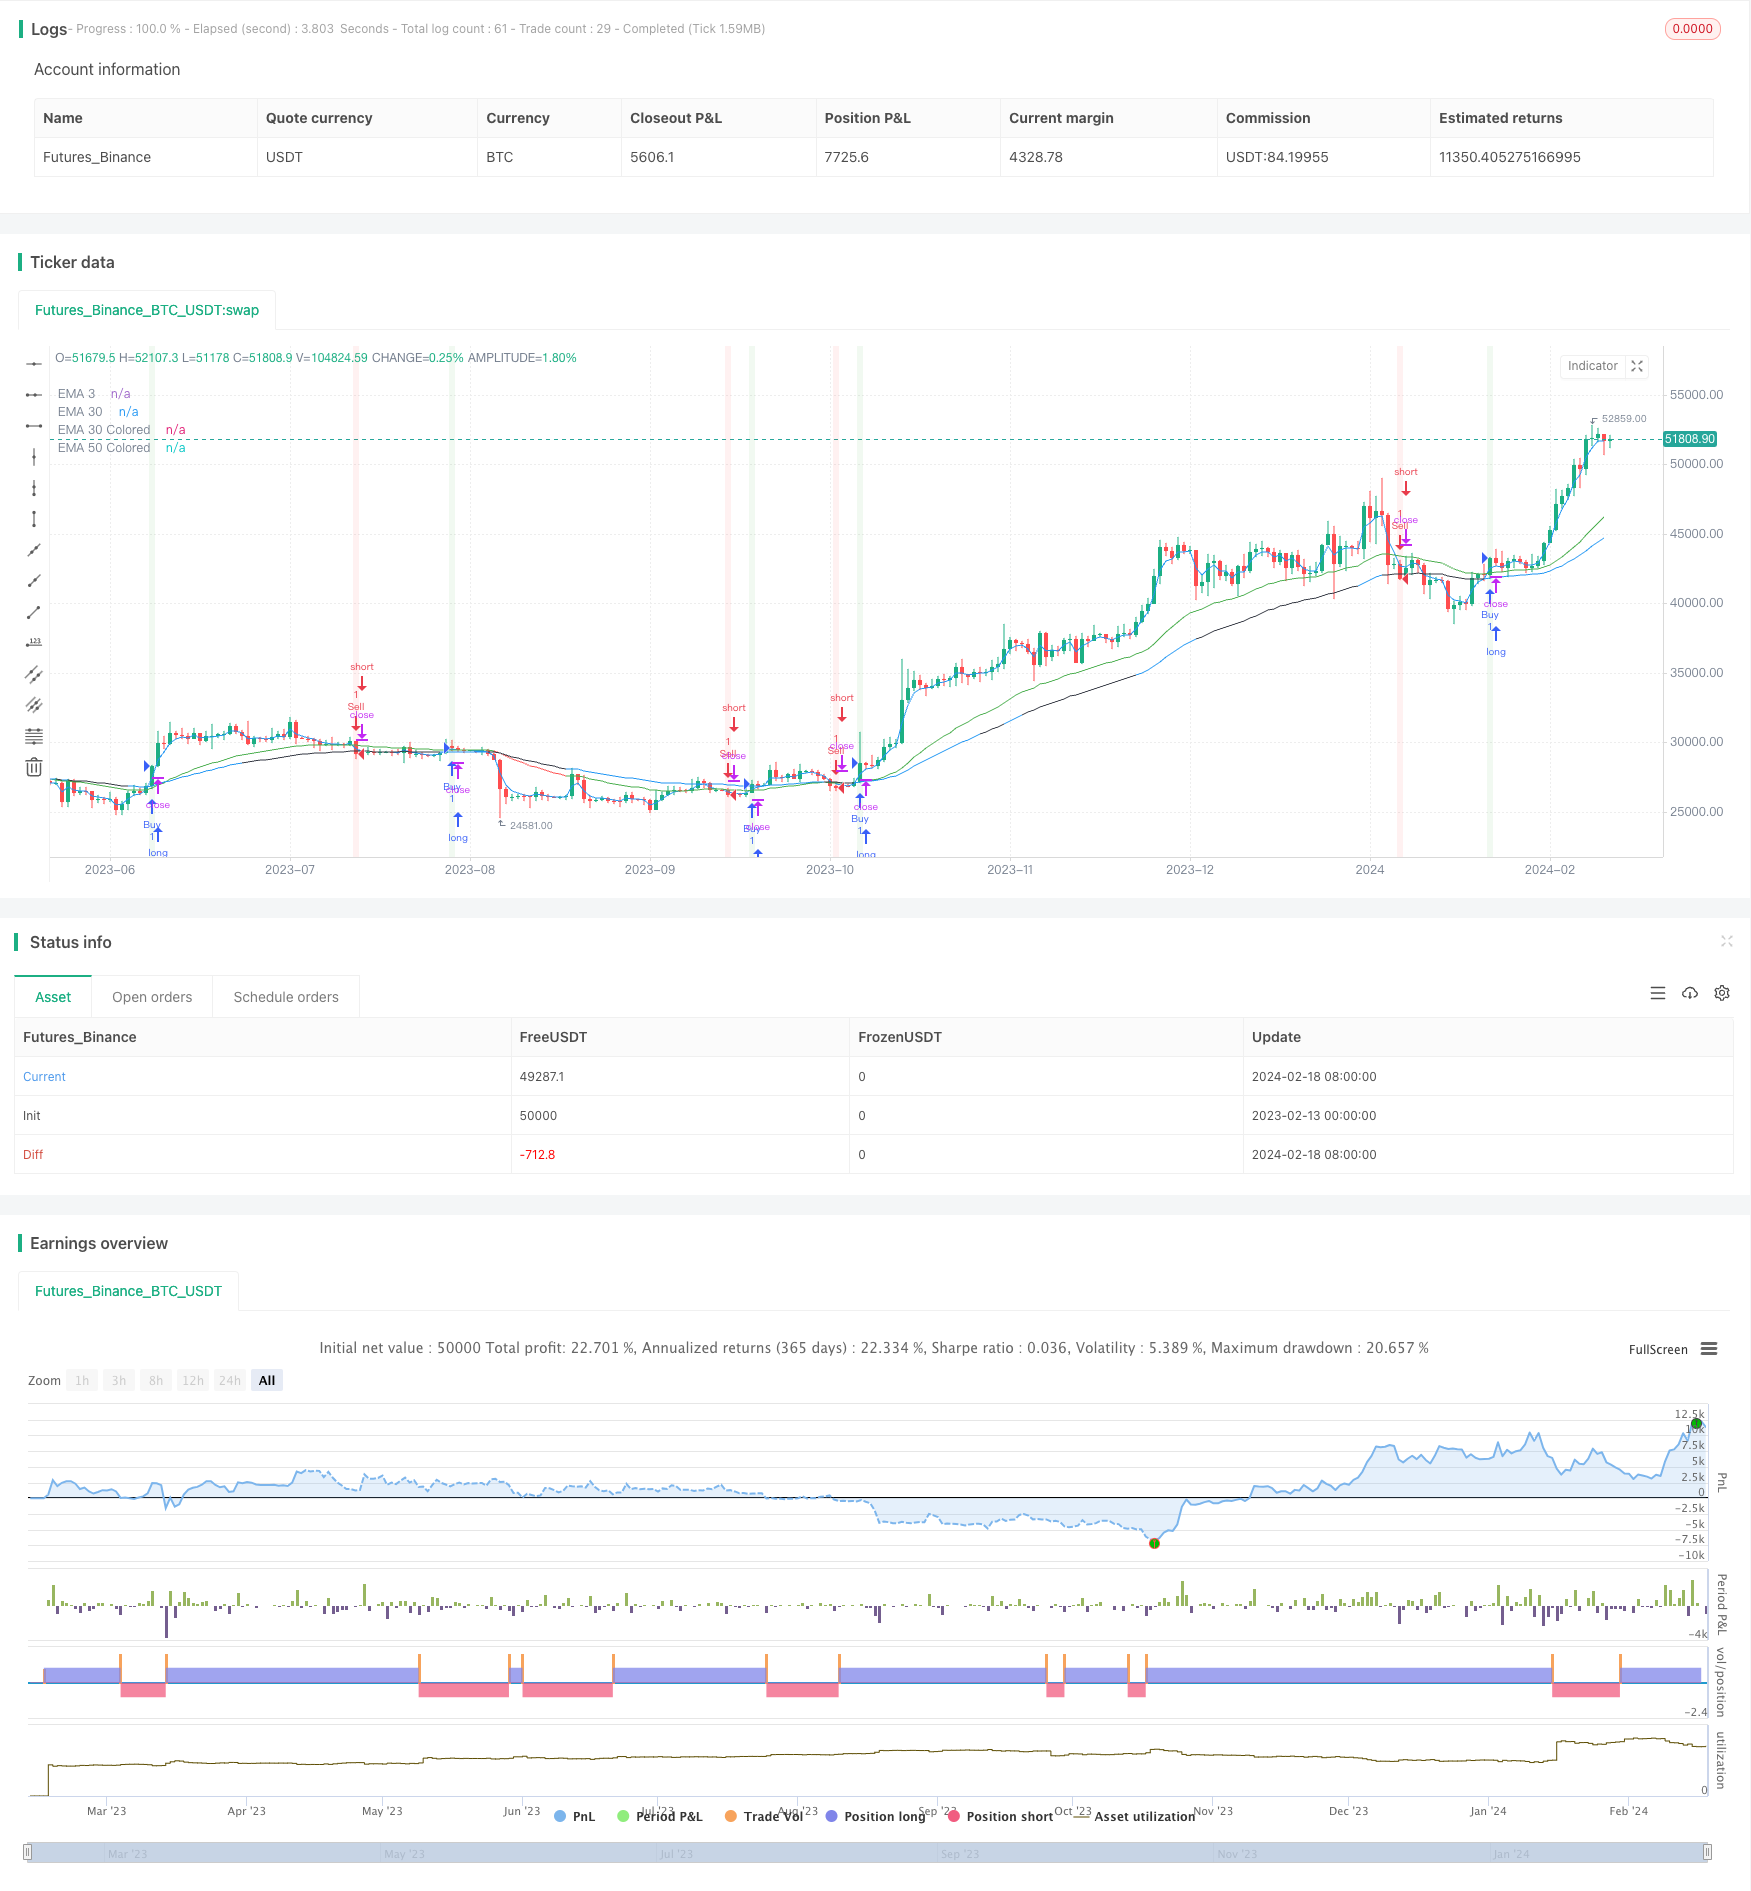
该策略通过组合使用移动平均线、MACD指标和RSI指标来识别股票价格趋势,实现低买高卖,获利。当短期移动平均线上穿长期移动平均线,并且收盘价高于50日移动平均线时产生买入信号。当短期移动平均线下穿长期移动平均线,并且收盘价低于50日移动平均线时产生卖出信号。另外,该策略还会通过RSI指标判断是否处于超买超卖区域来修正入场信号,并通过MACD指标的直方图来修正中长线趋势判断。
该策略主要依赖双移动平均线策略,即当短期移动平均线(3日EMA)上穿长期移动平均线(30日EMA)时产生买入信号,当短期移动平均线下穿长期移动平均线时产生卖出信号。这是判断股价短期和长期趋势的常用技巧。
另外,该策略还引入50日移动平均线,只有当价格高于50日线时才产生买入信号,低于时才产生卖出信号,这是为了避免频繁交易, filter掉一些假信号。
此外,RSI指标被用来判断是否超买超卖。如果RSI高于70则被认为是超买区,这时即使短期涨势强劲也可能面临回调。如果RSI低于30则被认为是超卖区,这时即使短期跌势猛烈也可能出现反弹。所以,该策略会修正入场信号,只有非超买超卖区才会进场。
最后,MACD直方图被用来判断中长期趋势。如果MACD直方图>0,则代表中长线为上涨趋势,这时进场信号更可信;如果MACD直方图<0,则代表中长线为下跌趋势,这时即使短期产生买入信号也可能面临调整。
该策略最大的优势是多指标组合,使进入和退出信号更加准确可靠。单一指标容易产生假信号,而该策略通过移动平均线判断短期趋势、RSI判断超买超卖、MACD判断中长期趋势,使每次交易的成功概率大大提高。
另一个优势是兼顾趋势交易和逆势交易。Follow the trend,follow the momentum是所有趋势交易者的信条。但高级策略不会死扣趋势,适当的逆势交易也能获得丰厚的超额收益。该策略在非超买超卖区域仍然选择逆势进场,这为策略再添活力。
该策略的主要风险来自突发事件导致快速调整。任何量化策略都难以应对重大利空或利好消息导致的剧烈价格波动。这时停损点可能被突破,造成较大损失。此外,政策风险也会对策略造成冲击。
另一个风险是多头走势中短期调整造成止损出场。即使中长线仍属牛市,短期调整时也可能被止损了结长仓。这时就错过了后续的上涨行情。
该策略可以从以下几个维度进行优化:
-
参数优化。可以测试更多组合的参数,寻找最优参数。
-
增加更多指标。可以测试加入布林线、KDJ等其他指标,丰富多指标组合,提高信号质量。
-
优化止损机制。可以测试追踪止损、区间突破止损等更先进的止损方式,减少止损被冲击的概率。
-
适应更多市场环境。可以优化策略的部分参数,使其能够在更多类型的市场中获得稳定收益。
该策略通过运用移动平均线、RSI指标和MACD指标的组合,实现了高质量信号的产生,避免了单一指标的局限性,使每次买卖决策都具有很强的信心度。同时,策略还兼顾趋势交易和逆势交易,在保证顺势出击的同时,也能在关键时候选择高效的逆势操作。总体来说,该策略稳健、高效,是非常棒的量化策略。
||
This strategy identifies price trends and makes buy low sell high decisions by combining moving averages, the MACD indicator and the RSI indicator. It generates buy signals when the short period moving average crosses above the long period moving average and the close price is above the 50-day moving average. It generates sell signals when the opposite happens. In addition, the strategy uses the RSI indicator to avoid overbought and oversold zones, and the MACD histogram to determine the intermediate-to-long term trend.
The core of this strategy relies on the dual moving average crossover system, which generates buy and sell signals when a short period EMA (3-day) crosses over a long period EMA (30-day). This is a common technique to determine short-term and long-term trend of the price.
In addition, the strategy incorporates a 50-day moving average line to avoid frequent trading, using it as a filter for trade signals. Only above the 50-day line will buy signals trigger, and vice versa.
Moreover, the RSI indicator identifies overbought (above 70) and oversold (below 30) scenarios. The strategy will skip taking positions even if MA crossover signals emerge in these irrational zones.
Finally, the MACD histogram is used to determine the intermediate-to-long term trend of the market. With MACD histogram > 0, the background is uptrend so buy signals are more reliable. When MACD histogram < 0, the background is downtrend so buy signals may face corrections soon.
The biggest advantage of this strategy is the combinational use of multiple indicators, which makes every trading decision highly confident and reliable. False signals can happen to individual indicators quite often, while this strategy improves accuracy by confirming signals in terms of short-term trend, long-term trend, overbought/oversold status, intermediate trend, etc.
Another advantage is that it combines trend trading and mean reversion trading. Following the trend is pivotal for trend traders, but advanced strategies won't be rigid about it. Taking contrarian positions in rational zones can also lead to lucrative excess returns.
Major risks come from sudden price shocks due to significant news events, which may penetrate stop loss points and incur big losses. Policy changes can also create disruptions to the strategy performances.
Another risk is being stopped out during temporary pullbacks in an intermediate-to-long term bull market. The strategy may fail to capture the full upside potentials if stopped out prematurally.
The strategy can be optimized in the following dimensions:
-
Parameter optimization to find the optimal combinations.
-
Incorporate more indicators like Bollinger Bands and KDJ to enrich the model.
-
Test more advanced stop loss mechanisms like trailing stop loss and volatility stop loss.
-
Optimize parts of the strategy to adapt to more types of markets.
In conclusion, by combining moving averages, RSI and MACD, this strategy manages to generate high-quality signals and avoid limitations of single indicators. It makes every trade confidently by confirming the trend. Also, the strategy balances trend trading and contrarian trading, excelling in both chasing the momentum and taking anticyclical positions when appropriate. It is a solid and efficient quantitative strategy overall.
[/trans]
Strategy Arguments
| Argument | Default | Description |
|---|---|---|
| v_input_int_1 | 14 | RSI Length |
| v_input_int_2 | 70 | RSI Overbought Level |
| v_input_int_3 | 30 | RSI Oversold Level |
| v_input_1 | 3 | EMA 3 Length |
| v_input_2 | 30 | EMA 30 Length |
| v_input_3 | 50 | EMA 50 Length |
Source (PineScript)
/*backtest
start: 2023-02-13 00:00:00
end: 2024-02-19 00:00:00
period: 1d
basePeriod: 1h
exchanges: [{"eid":"Futures_Binance","currency":"BTC_USDT"}]
*/

//@version=5
strategy('sachin 3.30 ', overlay=true)

// Input parameters
length = input.int(14, title='RSI Length', minval=1)
overbought = input.int(70, title='RSI Overbought Level', minval=0, maxval=100)
oversold = input.int(30, title='RSI Oversold Level', minval=0, maxval=100)
ema3_length = input(3, title='EMA 3 Length')
ema30_length = input(30, title='EMA 30 Length')
ema50_length = input(50, title='EMA 50 Length')

// Calculate EMAs
ema3 = ta.ema(close, ema3_length)
ema30 = ta.ema(close, ema30_length)
ema50 = ta.ema(close, ema50_length)

// Calculate RSI
rsiValue = ta.rsi(close, length)

// Calculate MACD
[macdLine, signalLine, hist] = ta.macd(close, 12, 26, 9)

var float buyPrice = na

// Buy condition: EMA 3 crosses above EMA 30 and price is above EMA 50
buyCondition = ta.crossover(ema3, ema30) and close > ema50
if (buyCondition)
    buyPrice := close
    strategy.entry('Buy', strategy.long)

// Exit long position when close is below EMA30 and below the low of the previous 3 candles after the buy entry
exitLongCondition = close < ema30 and close < ta.lowest(low, 3) and close < buyPrice
if (exitLongCondition)
    strategy.close('BuyExit')

// Sell condition: EMA 3 crosses below EMA 30 and price is below EMA 50
sellCondition = ta.crossunder(ema3, ema30) and close < ema50
if (sellCondition)
    strategy.entry('Sell', strategy.short)

// Exit short position when close is above EMA30 and above the high of the previous 3 candles after the sell entry
exitShortCondition = close > ema30 and close > ta.highest(high, 3)
if (exitShortCondition)
    strategy.close('SellExit')

// Plot EMAs on the chart
plot(ema3, color=color.new(color.blue, 0), title='EMA 3')
plot(ema30, color=color.new(color.red, 0), title='EMA 30')

// Change color of EMA 50 based on MACD histogram
ema50Color = hist > 0 ? color.new(color.blue, 0) : hist < 0 ? color.new(color.black, 0) : color.new(color.blue, 0)
plot(ema50, color=ema50Color, title='EMA 50 Colored')

// Change color of EMA 30 based on RSI trend
ema30Color = rsiValue > oversold ? color.new(color.green, 0) : rsiValue < overbought ? color.new(color.red, 0) : color.new(color.blue, 0)
plot(ema30, color=ema30Color, title='EMA 30 Colored')

// Highlight Buy and Sell signals on the chart
bgcolor(buyCondition ? color.new(color.green, 90) : na)
bgcolor(sellCondition ? color.new(color.red, 90) : na)

// Plotting Buy and Sell Signals on the Chart until strategy exit
barcolor(strategy.position_size > 0 and rsiValue > overbought ? color.new(color.yellow, 0) : strategy.position_size < 0 and rsiValue < oversold ? color.new(color.black, 0) : na)
Detail
https://www.fmz.com/strategy/442233
Last Modified
2024-02-20 14:28:59