Name
牛市追涨箱体买入策略Bull-Market-Breakout-Darvas-Box-Buy-Strategy
Author
ChaoZhang
Strategy Description
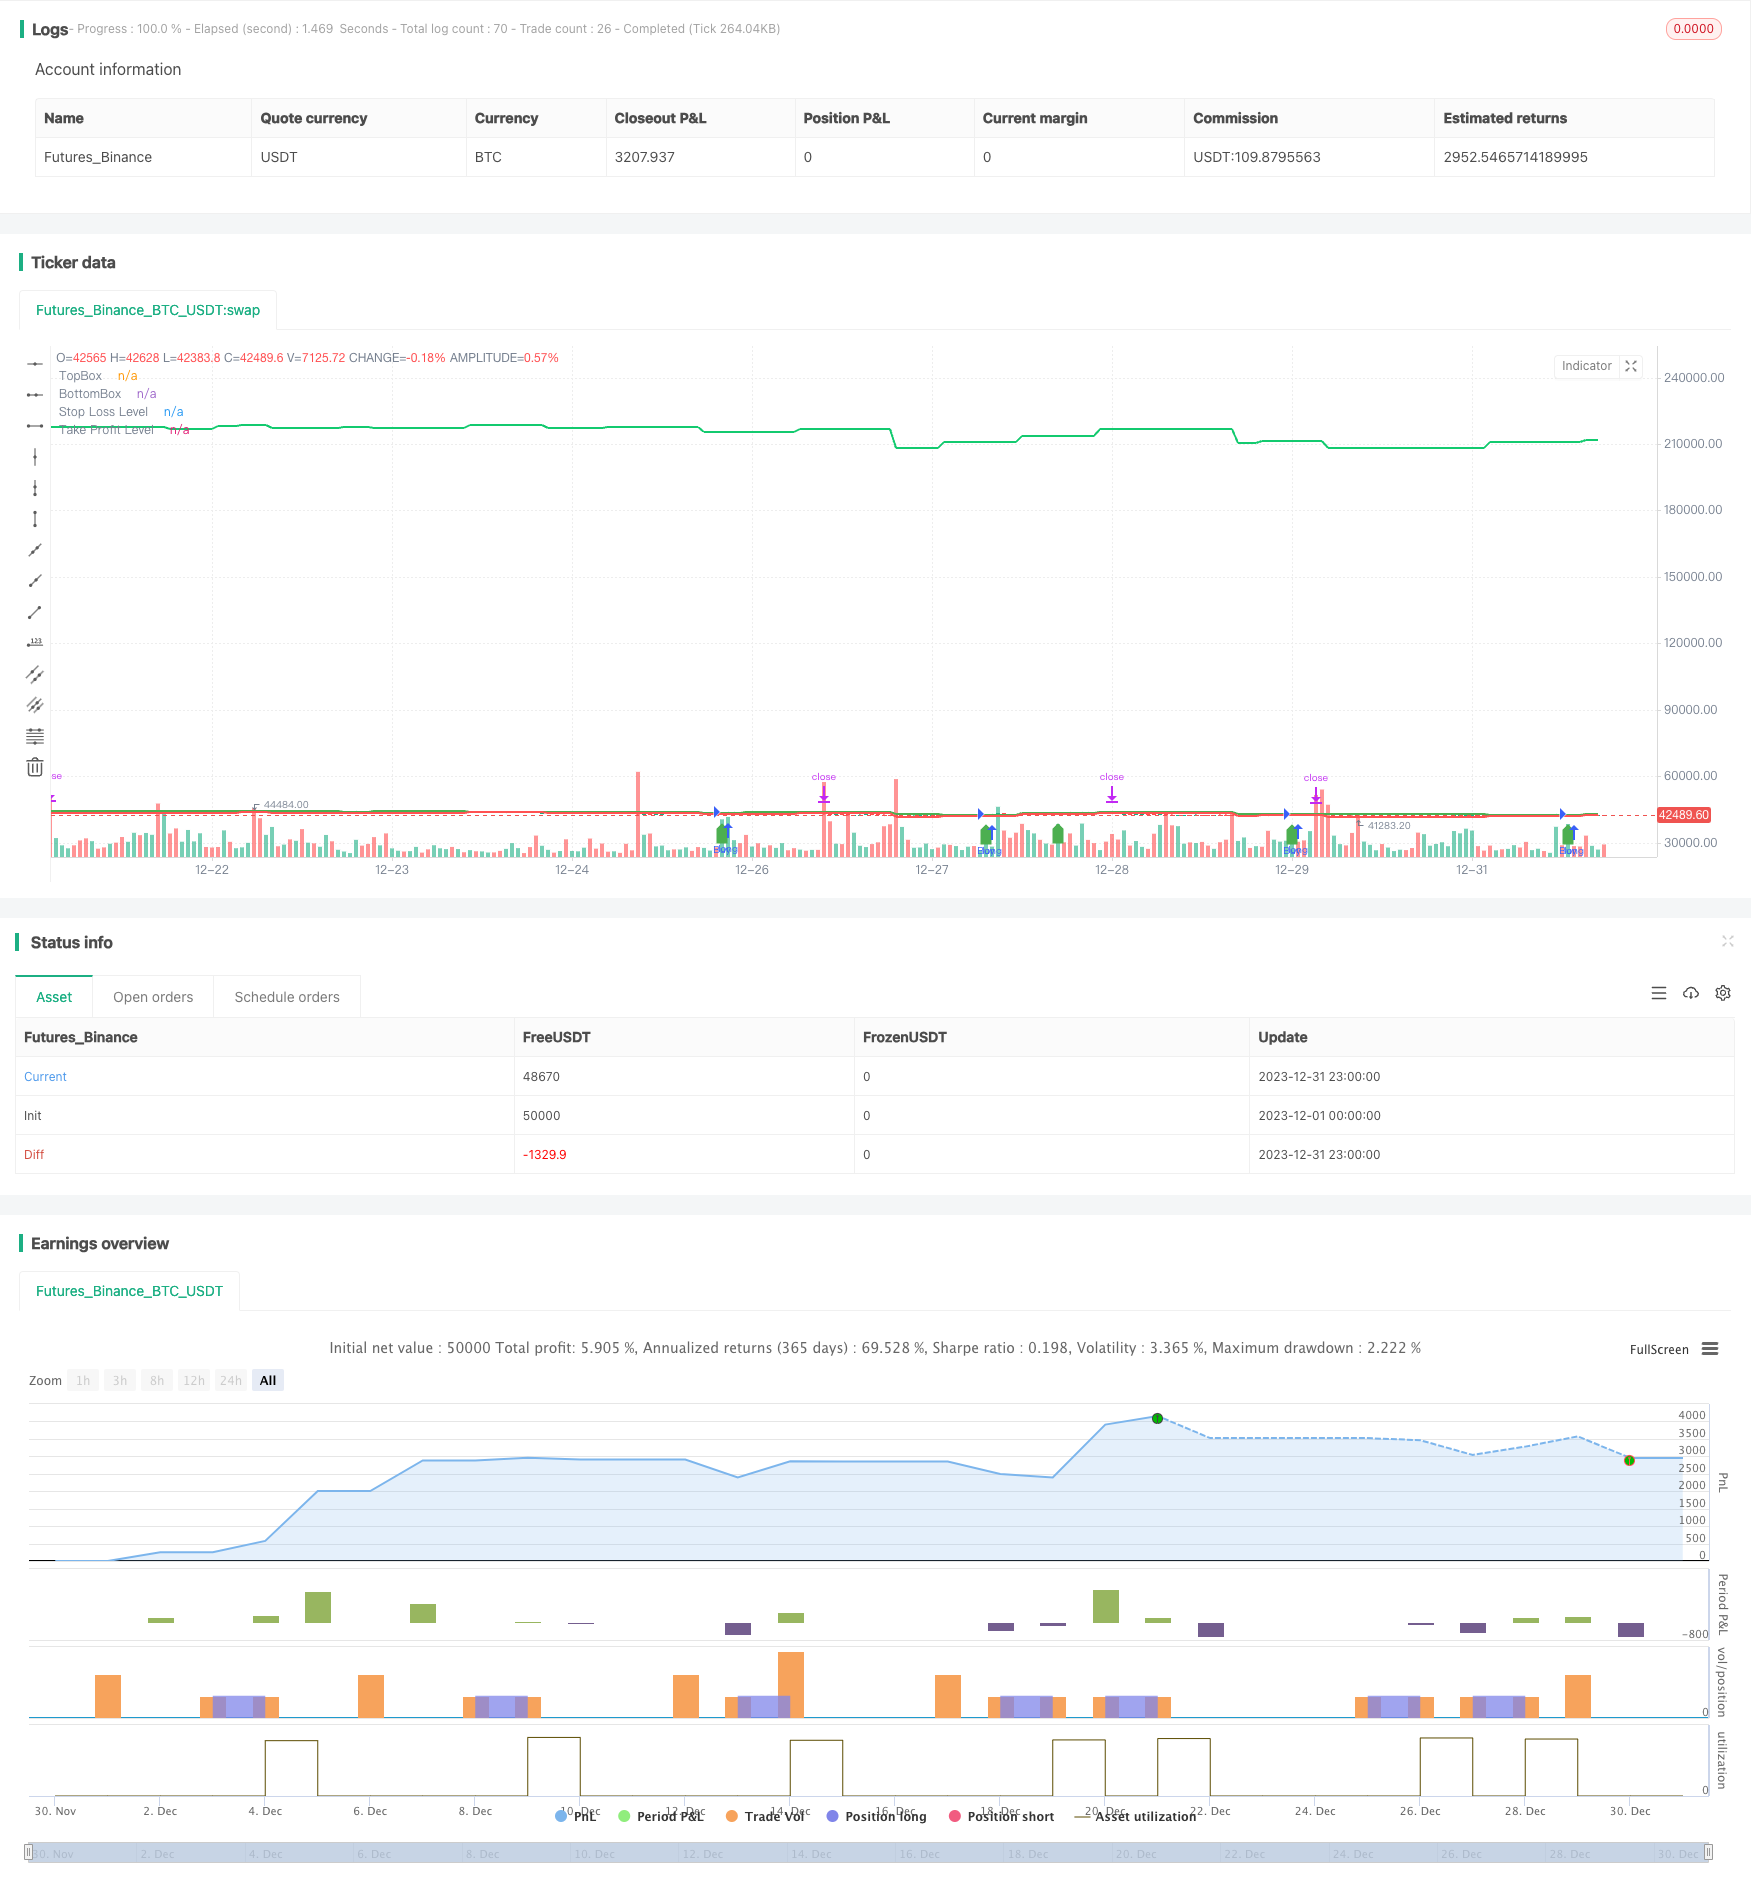
牛市追涨箱体买入策略是Darvas箱体策略的一个修改版本, 该策略只在牛市时期开仓做多。策略首先根据最高价绘制出一个箱体区域,当价格突破该箱体上轨时,就在收盘价做多入场。
该策略基于Darvas箱体理论改进而来。Darvas箱体理论认为,当价格在横盘整理后突破箱体上沿时,是做多的良好时机点。该策略依照这个理论判断做多入场时机。
具体来说,该策略首先计算最近5天的最低价,绘制箱体下轨。然后计算最近5天的最高价,绘制箱体上轨。当价格收盘突破上轨时,则判断行情进入牛市,在收盘价开仓做多。
做多后,策略会设置止损位于箱体下轨附近,同时设置止盈为止损的5倍大小。
该策略具有以下几个优势:
-
利用箱体理论判断追涨做多时机,可以有效过滤掉部分噪音。
-
只在突破上轨这一明确信号点做多,避免了许多不必要的随机开仓。
-
设置了止损和止盈逻辑,可以很好控制风险。
-
只在牛市时追涨做多,避免震荡行情和熊市下做多带来的风险。
该策略也存在一些风险:
-
箱体理论并不完美,价格突破上轨不代表一定能继续上涨。
-
没有考虑突破箱体上轨后的回调风险,可能会止损。
-
没有退出机制,长期持有带来的风险需要注意。
-
策略参数可能需要针对不同市场做出调整。
对应风险,可以通过以下方法加以优化和改进:
-
结合更多指标判断箱体突破的可靠性。
-
在突破上轨后考虑等待一定时间或第二次突破确认,再入场。
-
增加尾盘止损或移动止损来锁定利润。
-
测试不同市场的数据,优化参数。
该策略可以从以下几个方向进行优化:
-
优化箱体参数,测试不同的天数参数是否能获得更好的结果。
-
增加过滤指标,确保在趋势向上时追涨做多。例如结合均线指标等。
-
优化止损止盈参数,使其更适合不同市场。
-
增加移动止损来跟踪利润。
-
添加退出信号,在股价出现回调时及时止盈。
牛市追涨箱体买入策略是基于Darvas理论改进的简单有效的追涨策略。它只在明确的买入信号出现时才做多,可以避免许多不必要的随机交易。同时设置了止损和止盈来控制风险。该策略简单实用,值得在牛市中应用。但也需要注意其中存在的风险,并进行进一步的测试与优化,使其能够在更多市场中稳定盈利。
||
The Bull Market Breakout Darvas Box Buy Strategy is a modified version of the Darvas Box strategy that only goes long during a bull market. The strategy first draws a box area based on recent high prices, and goes long at the closing price when the price breaks out above the top band of the box.
This strategy is built upon the Darvas Box theory. The Darvas Box theory believes that when price breaks out of the box after a consolidation, it is a good long entry signal. This strategy identifies long entries based on this theory.
Specifically, the strategy first calculates the lowest low over the past 5 days to plot the bottom band of the box. Then it calculates the highest high over the past 5 days to plot the top band. When the closing price breaks above the top band, it signals that the trend has turned bullish and goes long at the closing price.
After going long, the strategy sets the stop loss near the bottom band of the box, and the take profit at 5 times the size of the stop loss.
The advantages of this strategy include:
-
Using the box theory to identify chasing breakout long entries can effectively filter out some noise.
-
Only going long at the clear breakout signal avoids many unnecessary random trades.
-
Having predefined stop loss and take profit can control risk well.
-
Only buying breakouts during bull market avoids risks of choppy and bear markets.
There are also some risks with this strategy:
-
The box theory is not perfect, breakout does not guarantee further upside.
-
It does not consider the pullback risk after breakout, which may hit stop loss.
-
There is no exit mechanism, long term holding can be risky.
-
The parameters may need adjustments for different markets.
Some methods to optimize and improve based on the risks:
-
Combine with more indicators to confirm the reliability of breakout signals.
-
Consider waiting for retest or second breakout for confirmation before entering.
-
Add trailing stop loss to lock in profits.
-
Test and optimize parameters using different market data.
Some directions this strategy can be improved on:
-
Optimize box parameter, test whether different day parameters can get better results.
-
Add filtering indicators to ensure buying into an upward trend. E.g. combining with moving averages.
-
Optimize stop loss and take profit for different markets.
-
Add trailing stop loss to follow profits.
-
Add exit signals to take profit when there is a pullback.
The Bull Market Breakout Darvas Box Buy Strategy is a simple yet effective trend chasing strategy built on the Darvas theory. It only goes long at clear buy signals to avoid unnecessary random trades. It also has predefined stop loss and take profit to control risk. This strategy is simple and practical for bull markets, but risks need to be monitored and further optimizations can be explored for more stable profits across different markets.
[/trans]
Strategy Arguments
| Argument | Default | Description |
|---|---|---|
| v_input_1 | 5 | BOX LENGTH |
Source (PineScript)
/*backtest
start: 2023-12-01 00:00:00
end: 2023-12-31 23:59:59
period: 1h
basePeriod: 15m
exchanges: [{"eid":"Futures_Binance","currency":"BTC_USDT"}]
*/

//@version=4
strategy("Darvas Box Strategy - Buy Only", overlay=true)

start_date = timestamp(2023, 10, 15, 0, 0)

boxp = input(5, "BOX LENGTH")

LL = lowest(low, boxp)
k1 = highest(high, boxp)
k2 = highest(high, boxp - 1)
k3 = highest(high, boxp - 2)

NH = valuewhen(high > k1[1], high, 0)
box1 = k3 < k2
TopBox = valuewhen(barssince(high > k1[1]) == boxp - 2 and box1, NH, 0)
BottomBox = valuewhen(barssince(high > k1[1]) == boxp - 2 and box1, LL, 0)

plot(TopBox, linewidth=2, color=color.green, title="TopBox")
plot(BottomBox, linewidth=2, color=color.red, title="BottomBox")

// Define entry conditions
enterLong = crossover(close, TopBox)

// Define exit conditions
exitLong = false  // No specific exit condition mentioned in the original script

// Define stop loss level
stopLoss = BottomBox

// Define take profit level (2 times the stop loss)
takeProfit = stopLoss * 5

// Execute buy trade and set stop loss and take profit
strategy.entry("Buy", strategy.long, when = enterLong)
strategy.exit("Exit", "Buy", stop = stopLoss, limit = takeProfit)

// Plot buy signal arrow
plotshape(enterLong, title = "Buy Signal", style = shape.labelup, location = location.belowbar, color = color.green)

// Plot stop loss level
plot(stopLoss, linewidth=2, color=color.red, title="Stop Loss Level")

// Plot take profit level
plot(takeProfit, linewidth=2, color=color.rgb(19, 202, 111), title="Take Profit Level")

// Hide sell signal arrow
plotshape(false, title = "Sell Signal", style = shape.labeldown, location = location.abovebar, color = color.red, transp = 100)
Detail
https://www.fmz.com/strategy/440292
Last Modified
2024-01-29 09:53:55
