Name
最佳ATR停损倍数策略Best-ATR-Stop-Multiple-Strategy
Author
ChaoZhang
Strategy Description
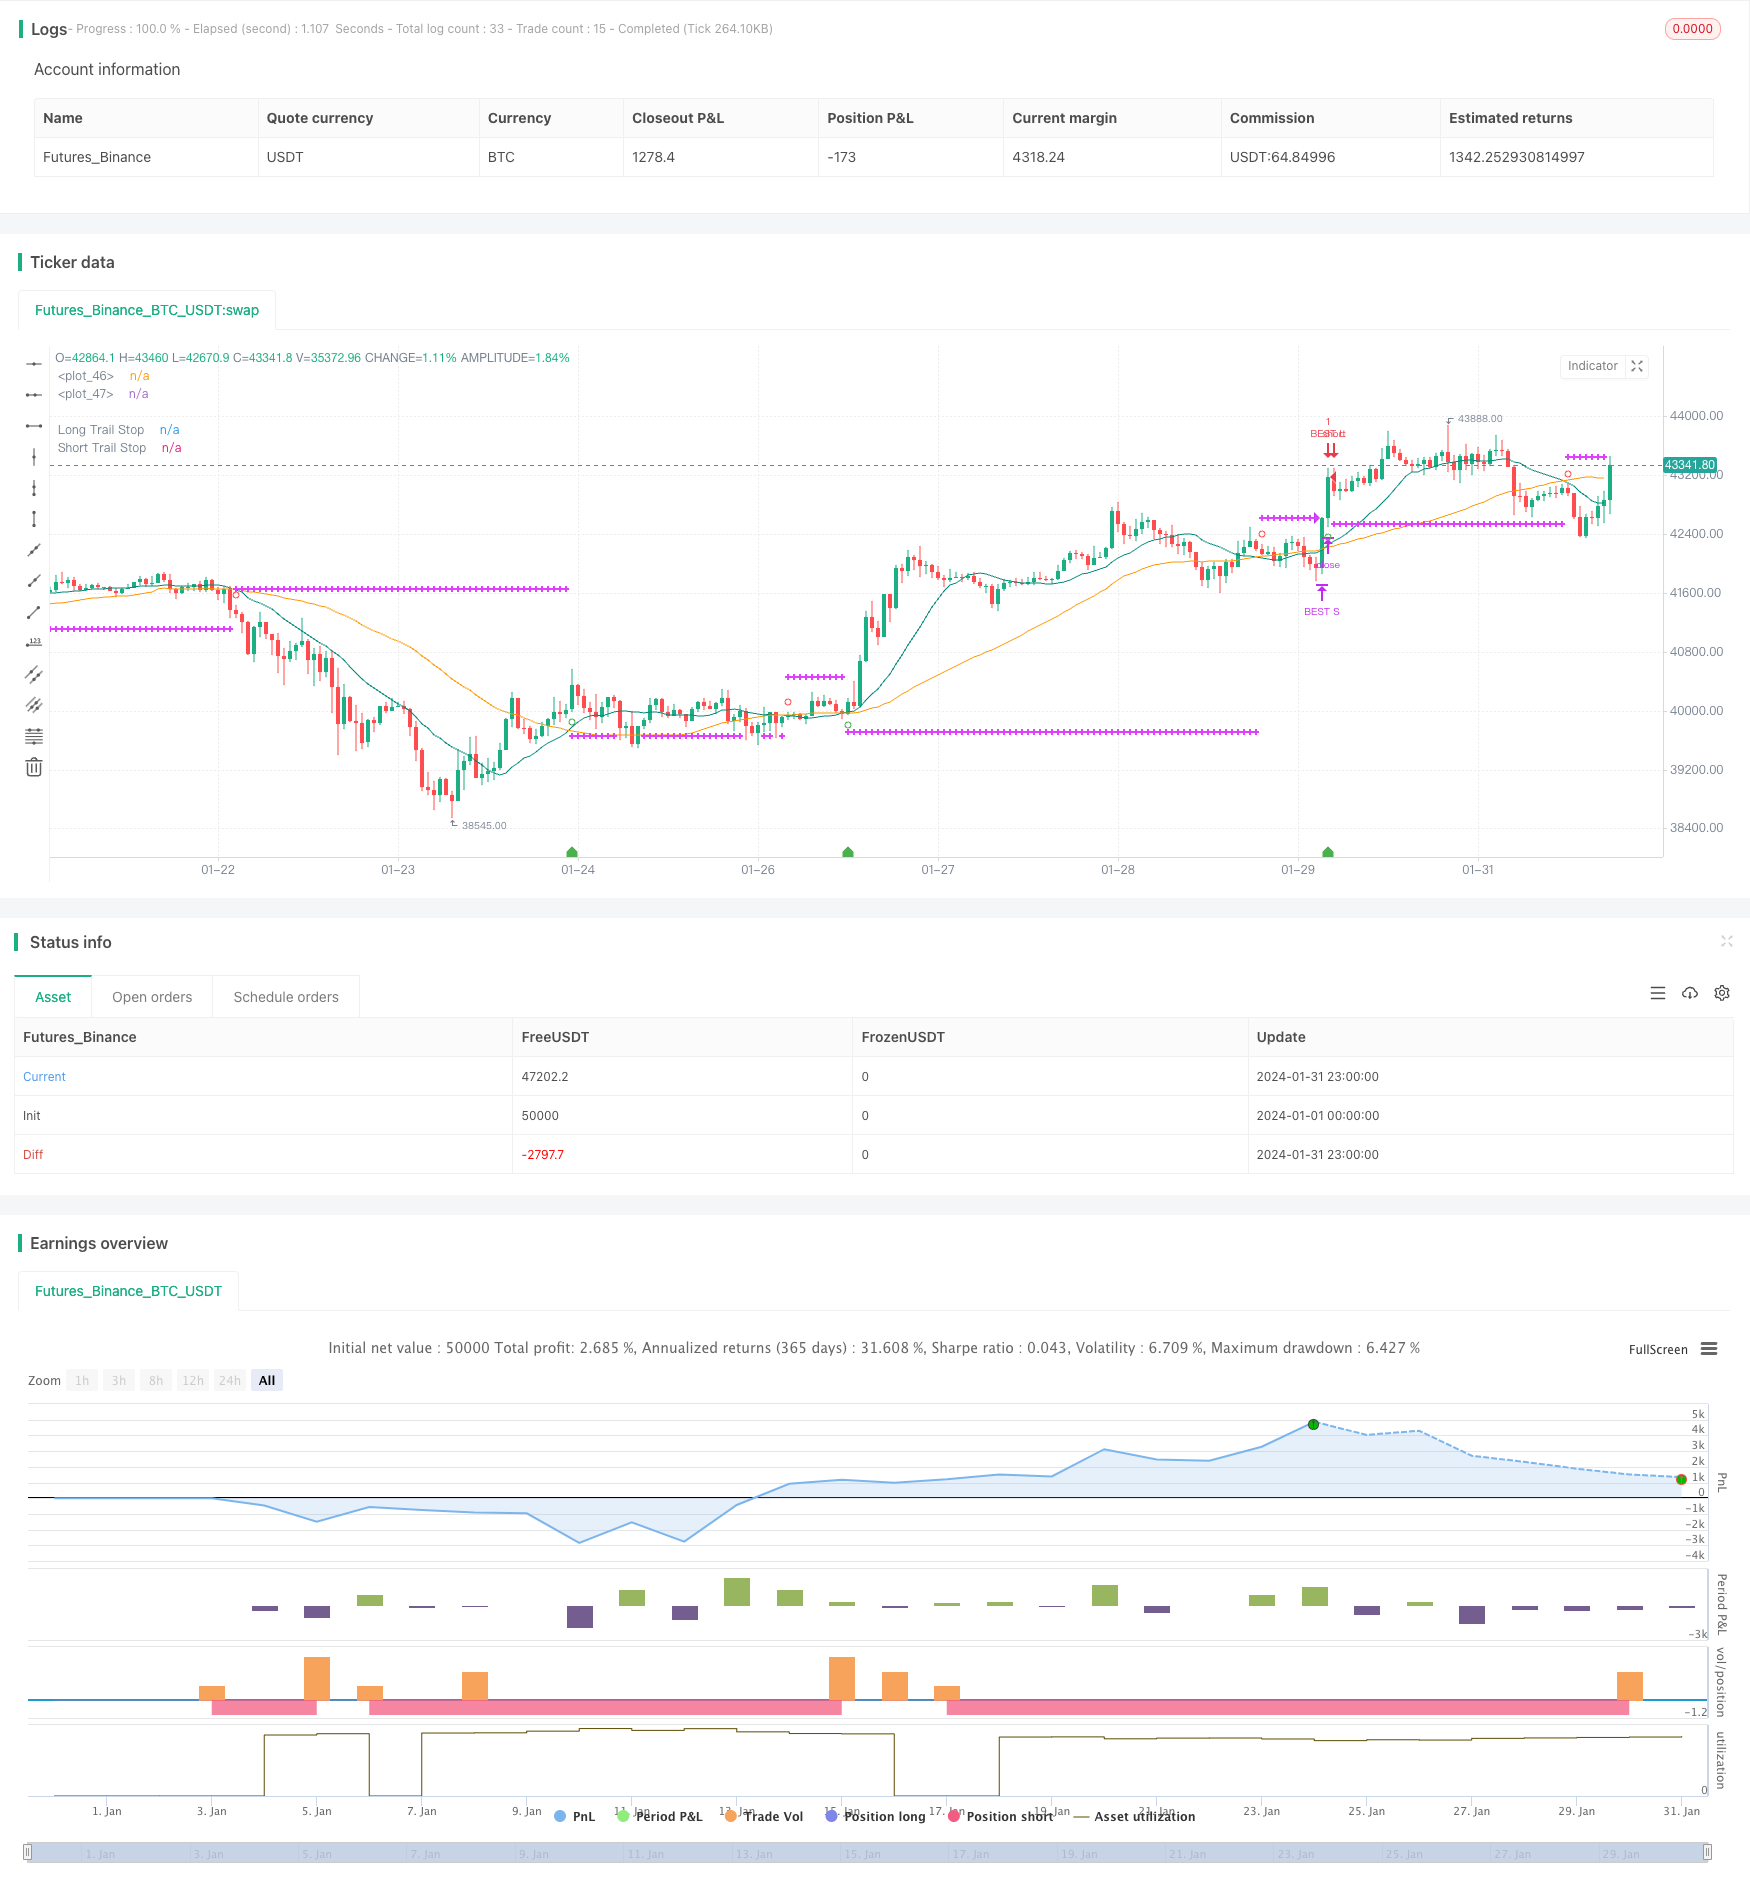
最佳ATR停损倍数策略是一种趋势跟踪策略,它使用平均真实波幅(ATR)的倍数来设置止损点,动态调整风险。当价格趋势变化时,它可以及时止损,避免巨额亏损。
该策略首先计算快速SMA周期和慢速SMA周期的简单移动平均线,当快速SMA上穿慢速SMA时做多,当快速SMA下穿慢速SMA时做空。
入场后,它会实时监控ATR的数值。ATR表示过去一定周期内的平均波动幅度。该策略允许我们设置ATR的周期长度(默认14)和倍数(默认2)。系统会在入场时计算ATR值,然后乘以设置的倍数,作为止损距离。
例如,如果入场后ATR为50点,倍数设定为2,则止损距离为100点。如果价格随后运行超过100点,止损单会被触发。这可以及时止损,避免过大损失。
该策略同时考虑了趋势判断,只有当买入信号匹配趋势为上涨时,才会启用长仓止损。做空信号则与下跌趋势匹配时启用。
止损线会在图表上绘制,我们可以实时验证。当止损条件触发时,对应头寸也会被系统自动平仓。
该策略最大的优势是动态调整止损距离,可以根据市场波动率变化自动修改风险敞口。当波动率扩大时,止损距离也会拉大,减小了止损被突破的概率。而低波动市场中,止损距离也会缩小。
相比固定止损距离,该方式可以在跟踪趋势的同时,有效控制单笔损失。它既保证了盈利空间,也注意了风险管理。
此外,结合趋势判断,这样的止损方式可以减少在盘整区域因震荡而被踢出的情况。
该策略的主要风险在于,持仓期间价格短线拉回,触发止损单的风险。尤其是ATR周期过短时,止损距离无法完全过滤短期波动的影响。
另一个风险在于,在剧烈行情中,价格跳空运动可能直接突破止损线。这时需要设置更大的止损倍数,但也意味着减小了盈利空间。
最后,该策略并没有考虑夜盘和盘前交易对ATR值的影响。这可能导致在开盘或收盘时,策略计算的ATR数据不准确。
该策略可以从以下几个方面进行优化:
-
优化ATR周期参数,测试不同市场下的最佳参数组合
-
比较固定倍数和动态变化倍数设置的收益率
-
结合夜盘和盘前数据计算ATR,减小开盘价格跳空的影响
-
设置ATR条件:仅在ATR达到一定水平后启用,可以避免低波动率市场的不必要止损
-
结合更多过滤条件:例如大级别趋势、量能指标等信息
最佳ATR停损倍数策略通过动态调整止损距离,实现了趋势跟踪和风险控制之间的有效平衡。相比固定止损距离,它可以在保证盈利空间的同时,有效限制单笔损失。
当然,仍需要注意一些潜在风险,比如价格跳空、止损过于灵敏等情况。我们可以从多种层面继续优化,提升策略的稳定性和收益率。
||
The Best ATR Stop Multiple strategy is a trend following strategy that uses multiples of the Average True Range (ATR) to set stop loss points and dynamically adjust risk. It can exit positions in a timely manner when price trends change to avoid huge losses.
The strategy first calculates the simple moving averages of fast and slow SMA periods. It goes long when the fast SMA crosses over the slow SMA, and goes short when the fast SMA crosses below the slow SMA.
After entering, it monitors the ATR value in real-time. The ATR represents the average volatility over a certain lookback period. The strategy allows us to set the ATR period (default 14) and multiplier (default 2). The system calculates the ATR value on entry, then multiplies it by the set multiplier as the stop distance.
For example, if the ATR after entry is 50 points, and the multiplier is set to 2, then the stop distance would be 100 points. If the price then moves more than 100 points, the stop loss order would be triggered. This allows timely stop losses to avoid excessive losses.
The strategy also considers trend determination. The long stop loss is only enabled when the buy signal matches an upward trend. The short stop loss matches a downward trend.
The stop loss lines are plotted on the chart so we can verify them in real-time. When stop loss conditions are triggered, corresponding positions are closed automatically by the system.
The biggest advantage of this strategy is that it dynamically adjusts the stop loss distance and automatically modifies risk exposure based on market volatility changes. When volatility expands, the stop distance also increases, reducing the chance of stop loss being hit. In low volatility markets, the stop distance is reduced.
Compared to fixed stop loss distances, this approach effectively controls losses on a per trade basis while tracking trends. It ensures profit room as well as managing risk.
In addition, combining with trend determination, such stop loss methods can reduce the chance of being stopped out by whipsaws in consolidation zones.
The main risk of this strategy is the chance of prices pulling back in the short term during a position, triggering the stop loss. Especially if ATR period is too short, stop distances cannot fully filter out the impact of short term fluctuations.
Another risk is that prices may gap through the stop loss level in violent moves. This would require larger ATR multiplier settings, but that also means reduced profit potential.
Finally, the strategy does not consider the impact of afterhours and premarket trading on ATR values. This may lead to inaccurate ATR data calculation on opens or closes.
The strategy can be optimized in several aspects:
-
Optimize ATR period parameters and test best combinations for different markets
-
Compare fixed vs dynamic ATR multiples in terms of return
-
Incorporate afterhours data into ATR calculation to reduce gaps on opens
-
Set ATR conditions: only enable stops when ATR reaches certain levels, avoiding unnecessary stops in low volatility environments
-
Incorporate more filters: major trends, volume/momentum indicators etc.
The Best ATR Stop Multiple Strategy effectively balances trend following and risk control by dynamically adjusting stop distances. Compared to fixed stops, it ensures profit potential while effectively capping losses.
Of course some risks remain, like price gaps and oversensitive stops. Further optimizations across multiple dimensions can improve robustness and returns.
[/trans]
Strategy Arguments
| Argument | Default | Description |
|---|---|---|
| v_input_1 | 15 | Fast SMA |
| v_input_2 | 45 | Slow SMA |
| v_input_3 | true | Use stop Loss |
| v_input_4 | 14 | ATR Length |
| v_input_5 | 2 | ATR Multiple |
Source (PineScript)
/*backtest
start: 2024-01-01 00:00:00
end: 2024-01-31 23:59:59
period: 1h
basePeriod: 15m
exchanges: [{"eid":"Futures_Binance","currency":"BTC_USDT"}]
*/

//@version=4
//@author=Daveatt
//This source code is subject to the terms of the Mozilla Public License 2.0 at https://mozilla.org/MPL/2.0/

SystemName = "BEST ATR Stop Multiple Strategy"
TradeId = "BEST"

InitCapital = 100000
InitPosition = 100
InitCommission = 0.075
InitPyramidMax = 1
CalcOnorderFills = true
CalcOnTick = true
DefaultQtyType = strategy.fixed
DefaultQtyValue = strategy.fixed
Precision = 2
Overlay=true


strategy(title=SystemName, shorttitle=SystemName, overlay=Overlay )

fastSMAperiod = input(defval=15, title='Fast SMA', type=input.integer, minval=2, step=1)
slowSMAperiod = input(defval=45, title='Slow SMA', type=input.integer, minval=2, step=1)

src = close
// Calculate moving averages
fastSMA = sma(src, fastSMAperiod)
slowSMA = sma(src, slowSMAperiod)

// Calculate trading conditions
enterLong  = crossover(fastSMA, slowSMA)
enterShort = crossunder(fastSMA, slowSMA)

// trend states
since_buy  = barssince(enterLong)
since_sell = barssince(enterShort)
buy_trend  = since_sell > since_buy
sell_trend = since_sell < since_buy

is_signal = enterLong or enterShort

// get the entry price
entry_price = valuewhen(enterLong or enterShort, src, 0)

// Plot moving averages
plot(series=fastSMA, color=color.teal)
plot(series=slowSMA, color=color.orange)

// Plot the entries
plotshape(enterLong, style=shape.circle, location=location.belowbar, color=color.green, size=size.small)
plotshape(enterShort, style=shape.circle, location=location.abovebar, color=color.red, size=size.small)


///////////////////////////////
//======[ Trailing STOP ]======//
///////////////////////////////

// use SL?
useSL = input(true, "Use stop Loss")
// ATR multiple Stop
stop_atr_length         = input(14,title="ATR Length", minval=1, type=input.integer)
stop_atr_mult           = input(2,title="ATR Multiple", minval=0.05, step=0.1, type=input.float)

// Global STOP

stop_price = 0.0, stop_price := nz(stop_price[1])

// STOP ATR
var stop_atr      = 0.0
var entry_stop_atr   = 0.0

stop_atr          := nz(atr(stop_atr_length))

if enterLong or enterShort
    entry_stop_atr := stop_atr * stop_atr_mult

// display the ATR value multiple
plotshape(enterLong, title='ATR Long Stop value', style=shape.labelup,
 location=location.bottom, color=color.green, transp=0, text='', textcolor=color.navy, editable=true, size=size.small, show_last=1, size=size.small)

// var label atr_long_label = na
// var label atr_short_label = na
lapos_y_entry_up = lowest(30)
lapos_y_entry_dn = highest(30)

// text_label = "ATR value: " + tostring(stop_atr, '#.#') + "\n\nATR Multiple value: " + tostring(entry_stop_atr, '#.#')

// if enterLong

//     label.delete(atr_long_label)

//     atr_long_label := label.new(bar_index, lapos_y_entry_up, text=text_label,
//      xloc=xloc.bar_index, yloc=yloc.price, color=color.green, style=label.style_labelup, textcolor=color.white,
//      size=size.normal)

// if enterShort

//     label.delete(atr_short_label)

//     atr_short_label := label.new(bar_index, lapos_y_entry_dn, text=text_label,
//      xloc=xloc.bar_index, yloc=yloc.price, color=color.red, style=label.style_labeldown, textcolor=color.black,
//      size=size.normal)

// Determine trail stop loss prices
longStopPrice = 0.0, shortStopPrice = 0.0

longStopPrice := if useSL and buy_trend
    stopValue = entry_price - entry_stop_atr
else
    0

shortStopPrice := if useSL and sell_trend
    stopValue = entry_price + entry_stop_atr
else
    999999

//////////////////////////////////////////////////////////////////////////////////////////
//*** STOP LOSS HIT CONDITIONS TO BE USED IN ALERTS  ***//
//////////////////////////////////////////////////////////////////////////////////////////

cond_long_stop_loss_hit  = useSL and buy_trend and crossunder(low, longStopPrice[1])

cond_short_stop_loss_hit = useSL and sell_trend and crossover(high, shortStopPrice[1])


// Plot stop loss values for confirmation
plot(series=useSL and buy_trend and low >= longStopPrice
 ? longStopPrice : na,
 color=color.fuchsia, style=plot.style_cross,
 linewidth=2, title="Long Trail Stop")

plot(series=useSL and sell_trend and high <= shortStopPrice
 ? shortStopPrice : na,
 color=color.fuchsia, style=plot.style_cross,
 linewidth=2, title="Short Trail Stop")

close_long  = cond_long_stop_loss_hit
close_short = cond_short_stop_loss_hit

// Submit entry orders
strategy.entry(TradeId + " L", long=true, when=enterLong)
strategy.close(TradeId + " L", when=close_long)

//if (enterShort)
strategy.entry(TradeId + " S", long=false, when=enterShort)
strategy.close(TradeId + " S", when=close_short)
Detail
https://www.fmz.com/strategy/442369
Last Modified
2024-02-21 14:24:22