Name
抛物线转向系统动能拐点追踪策略Momentum-Inversion-Tracking-Strategy
Author
ChaoZhang
Strategy Description
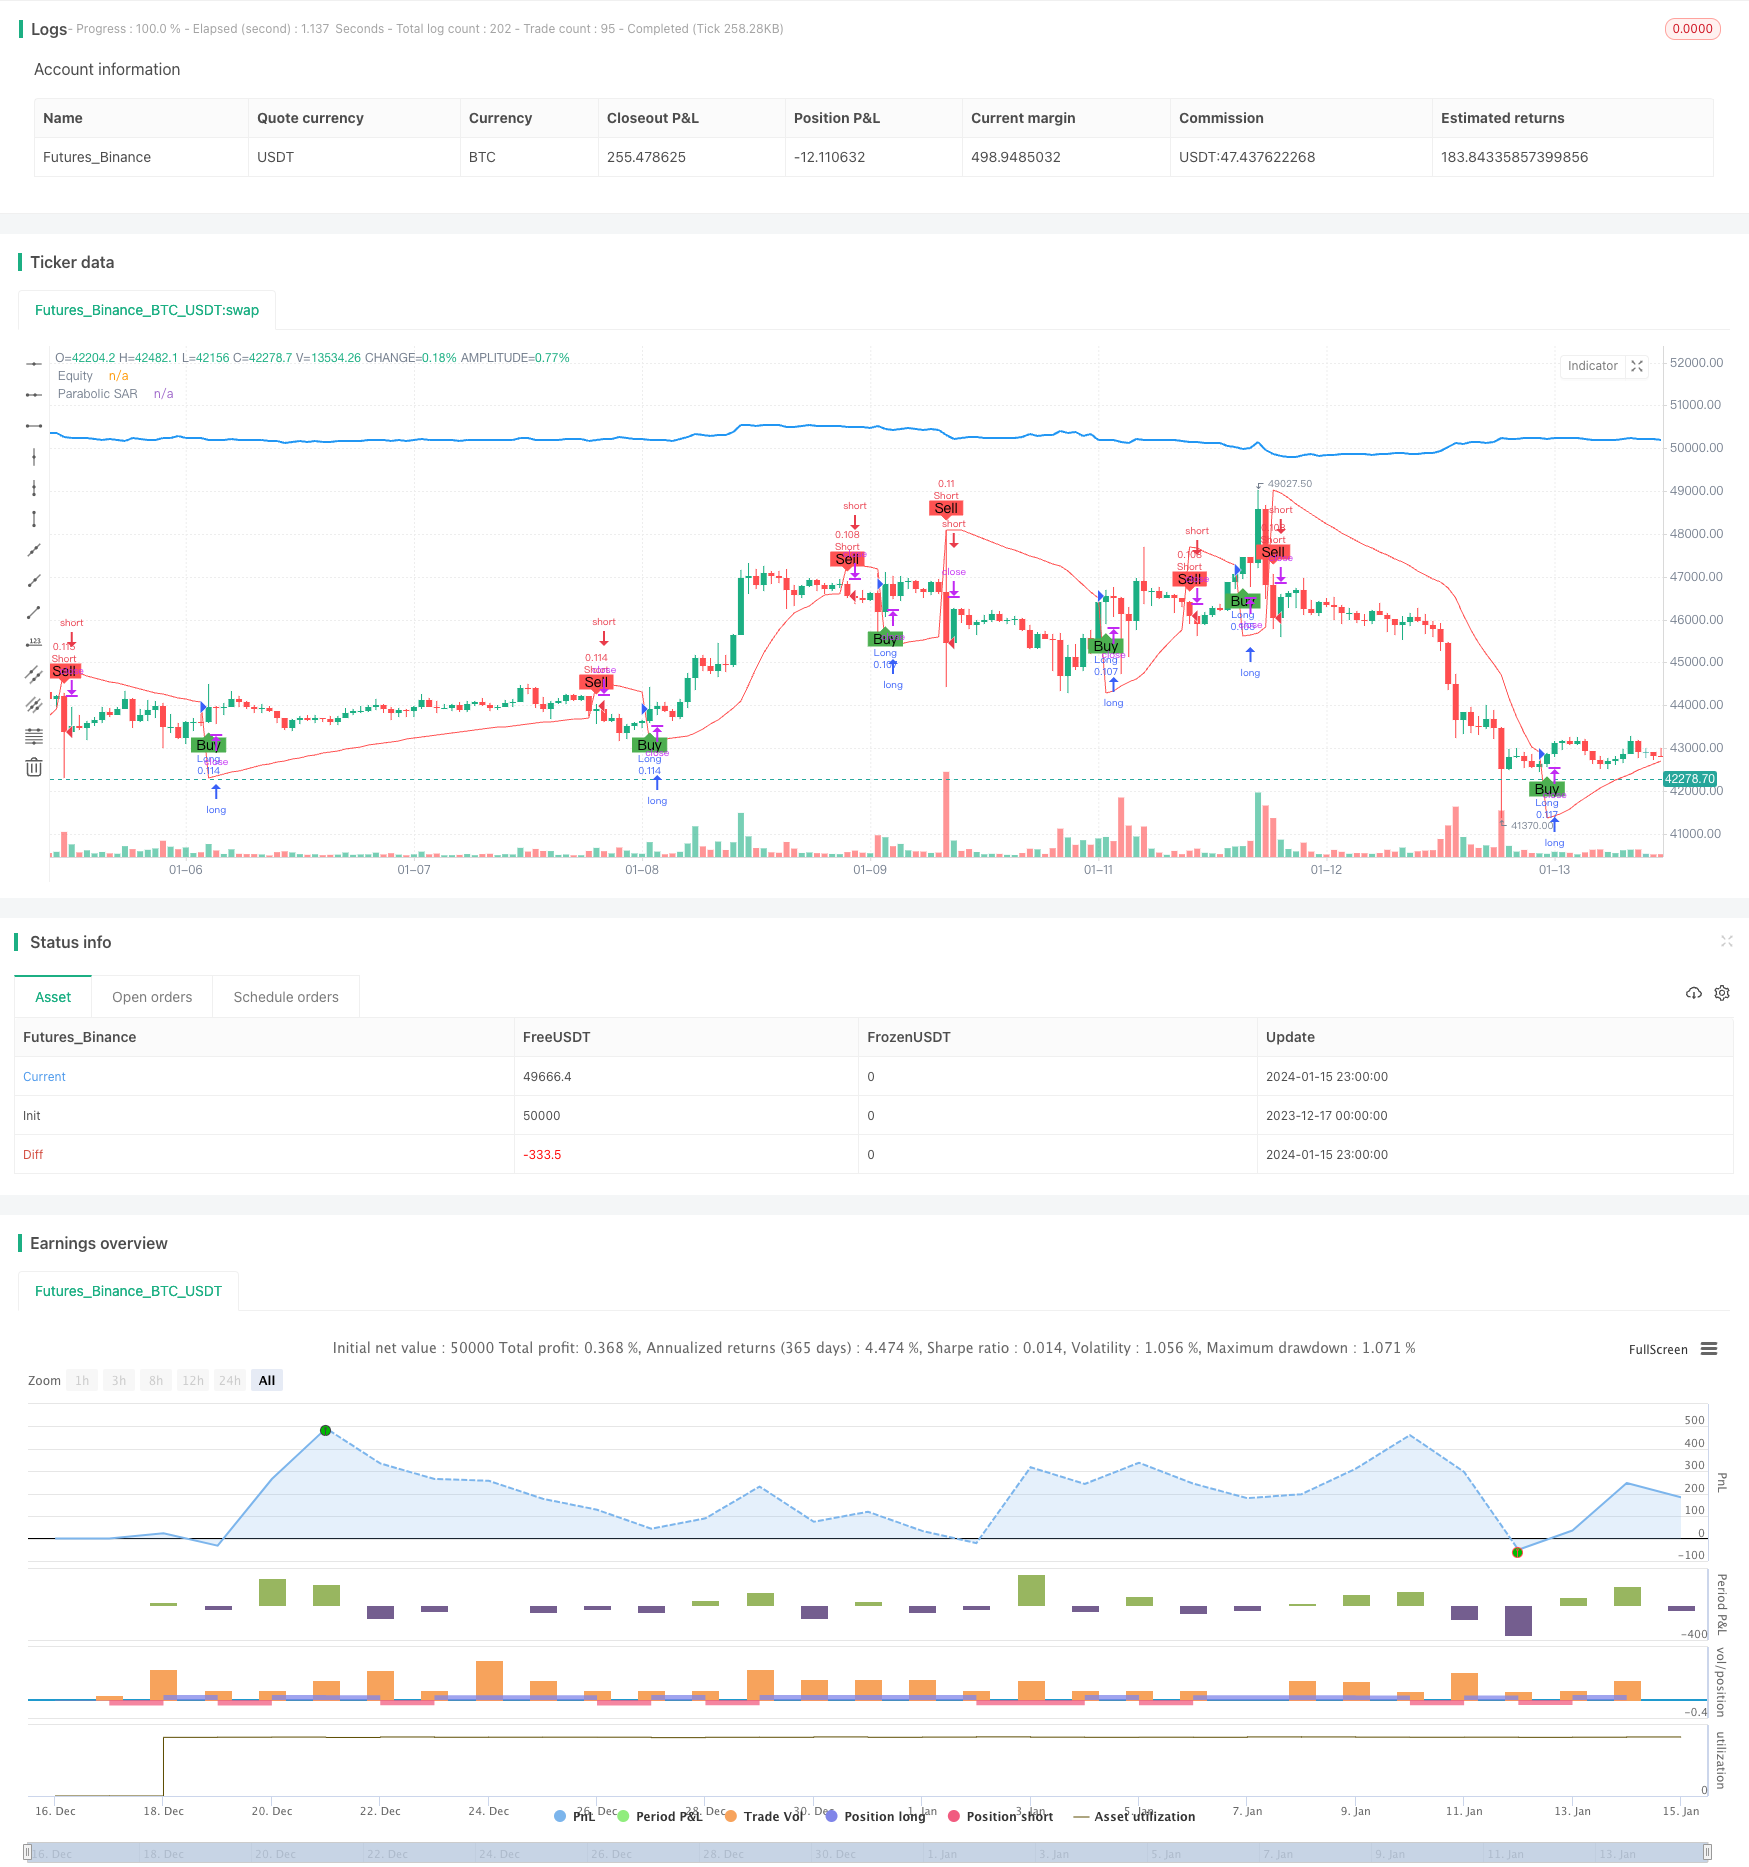
本策略利用抛物线转向系统(Parabolic SAR)指标识别股价趋势的转折点,在转折点发生时进行买入或卖出操作。该策略可以自动识别股价的上涨和下跌趋势,并相应调整头寸。
本策略的核心指标是抛物线转向系统(Parabolic SAR)。该指标能够识别股价的上涨趋势和下跌趋势,当股价上涨时SAR点会位于股价的下方,当股价下跌时SAR点会跃升到股价的上方。策略通过检测股价线和SAR点的交叉作为买入和卖出信号。具体来说,当股价线从下方上扫SAR点时产生买入信号;当股价线从上方下破SAR点时产生卖出信号。
该策略的买入条件是:close高于sar,表示股价线从下方上扫穿了SAR点,属于买入信号;卖出条件是close低于sar,表示股价线从上方下破了SAR点,属于卖出信号。所以,本策略的核心逻辑就是追踪股价运动的动能转折点,在转折点发生交叉时进行买入和卖出操作。
本策略最大的优势在于能够自动识别股价趋势的转折点,无需人工判断,避免了追高杀跌的常见错误。抛物线转向系统是一种具有良好可靠性的趋势识别指标,可以减少误操作的机会。
另外,SAR指标对股价的反应也比较灵敏,可以及时捕捉到价格的小范围调整,这对于追求高胜率和频繁交易的策略而言是非常必要的。所以该策略可以自动调整持仓,避免被困在大幅度调整的局面中。
本策略最大的风险在于SAR指标对股价变化反应太灵敏,小幅震荡可能会产生错误信号,导致过于频繁地进行买入卖出操作,增加交易成本和滑点损失。
另外,在股票大幅上涨或者下跌的时候,SAR指标的设置参数如起始值、递增值等,可能会影响其判断趋势转折的准确性和及时性,需要谨慎设置这些参数。
如果不适当配置仓位管理,过于追踪SAR信号,可能导致仓位过于频繁波动,增加实际交易的难度。
该策略可以从以下几个方面进行优化:
-
优化SAR参数设置,调整参数组合,找到最优参数以提高信号判断的准确性
-
增加其他辅助指标进行确认,避免SAR指标的误报导致不必要的头寸切换
-
配置适当的仓位和止损策略,避免过于频繁交易,控制风险
-
结合趋势判断指标,避免在震荡行情中被套
-
优化买入卖出的具体价格,考虑成本和滑点损失,提高交易效率
本策略主要依赖抛物线转向系统指标判断股价趋势的转折点,具有可靠的趋势判断能力。策略优化后可以成为一个有效的趋势跟踪策略,通过自动调整持仓获取股价的方向性机会。但需要注意控制仓位波动频率,并防范误报风险。
||
This strategy uses the Parabolic SAR indicator to identify turning points in stock price trends and enters long or short positions when reversals occur. It can automatically detect upward and downward momentum in stock prices and adjust positions accordingly.
The core indicator of this strategy is Parabolic SAR. This indicator can identify upward and downward trends in stock prices. When prices rise, the SAR dots stay below the prices. When prices fall, the SAR dots jump above the prices. The strategy detects crossover between price and SAR dots as trading signals. Specifically, when the price line crosses above the SAR dots from below, a long entry signal is generated. When the price line crosses below the SAR dots from above, a short entry signal is triggered.
The long condition is: close above sar, indicating the price line has crossed above the SAR dots from below, a long signal. The short condition is: close below sar, indicating the price line has crossed below the SAR dots from above, a short signal. So the core logic of this strategy is to track inversion points in price momentum and trade on crossovers.
The biggest advantage of this strategy is it can automatically identify turning points in price trends without manual interference, avoiding common mistakes like chasing peaks and killing dips. The Parabolic SAR is a reliable trend identification indicator, which reduces trading mistakes.
Besides, SAR reacts sensitively to price changes, capturing minor pullbacks in time. This is important for strategies targeting high win rate and frequent trading. So the strategy can adjust positions automatically to avoid being trapped in significant pullbacks.
The major risk is SAR may overreact to minor price oscillations, generating false signals and causing over-trading, increasing costs and slippage.
Also, in strong uptrends or downtrends, the SAR parameters like starting and increment values could impact the accuracy and timeliness of catching trend reversals. Careful parameter tuning is important.
Inappropriate position sizing, over-reacting to SAR signals can lead to fluctuating exposure, increasing practical difficulties in trading.
The strategy can be optimized in the following aspects:
-
Optimize SAR parameters for higher accuracy of signals
-
Add filters to avoid false signals caused by SAR
-
Employ proper position sizing and stop loss to control risks
-
Incorporate trend filters to avoid whipsaws in ranging markets
-
Optimize entry and exit prices considering costs and slippage to improve efficiency
The strategy mainly relies on SAR to determine trend reversal points. It has reliable trend identification capability. When optimized, it can serve as an effective trend following strategy by automatically adjusting positions to capture directional price movements. But position churning should be controlled and risk of false signals should be mitigated.
[/trans]
Strategy Arguments
| Argument | Default | Description |
|---|---|---|
| v_input_1 | 0.02 | Start |
| v_input_2 | 0.02 | Increment |
| v_input_3 | 0.2 | Maximum |
Source (PineScript)
/*backtest
start: 2023-12-17 00:00:00
end: 2024-01-16 00:00:00
period: 1h
basePeriod: 15m
exchanges: [{"eid":"Futures_Binance","currency":"BTC_USDT"}]
*/

//@version=5
strategy("Parabolic SAR Strategy", shorttitle="PSAR", overlay=true, default_qty_type=strategy.percent_of_equity, default_qty_value=10)

// Parabolic SAR settings
start = input(0.02, title="Start")
increment = input(0.02, title="Increment")
maximum = input(0.2, title="Maximum")

// Calculate Parabolic SAR
sar = ta.sar(start, increment, maximum)

// Plot Parabolic SAR on the chart
plot(sar, color=color.red, title="Parabolic SAR")

// Strategy logic
longCondition = ta.crossover(close, sar)
shortCondition = ta.crossunder(close, sar)

// Execute strategy orders
strategy.entry("Long", strategy.long, when=longCondition)
strategy.entry("Short", strategy.short, when=shortCondition)

// Plot buy and sell signals on the chart
plotshape(series=longCondition, title="Buy Signal", color=color.green, style=shape.labelup, location=location.belowbar, text="Buy")
plotshape(series=shortCondition, title="Sell Signal", color=color.red, style=shape.labeldown, location=location.abovebar, text="Sell")

// Calculate equity manually
equity = strategy.equity
equity_str = str.tostring(equity)
equity_plot = plot(equity, title="Equity", color=color.blue, linewidth=2)

// Update equity plot only on bar close to avoid repainting issues
label.new(bar_index, na, text=equity_str, style=label.style_none, color=color.blue, yloc=yloc.abovebar)
Detail
https://www.fmz.com/strategy/439080
Last Modified
2024-01-17 15:46:21
