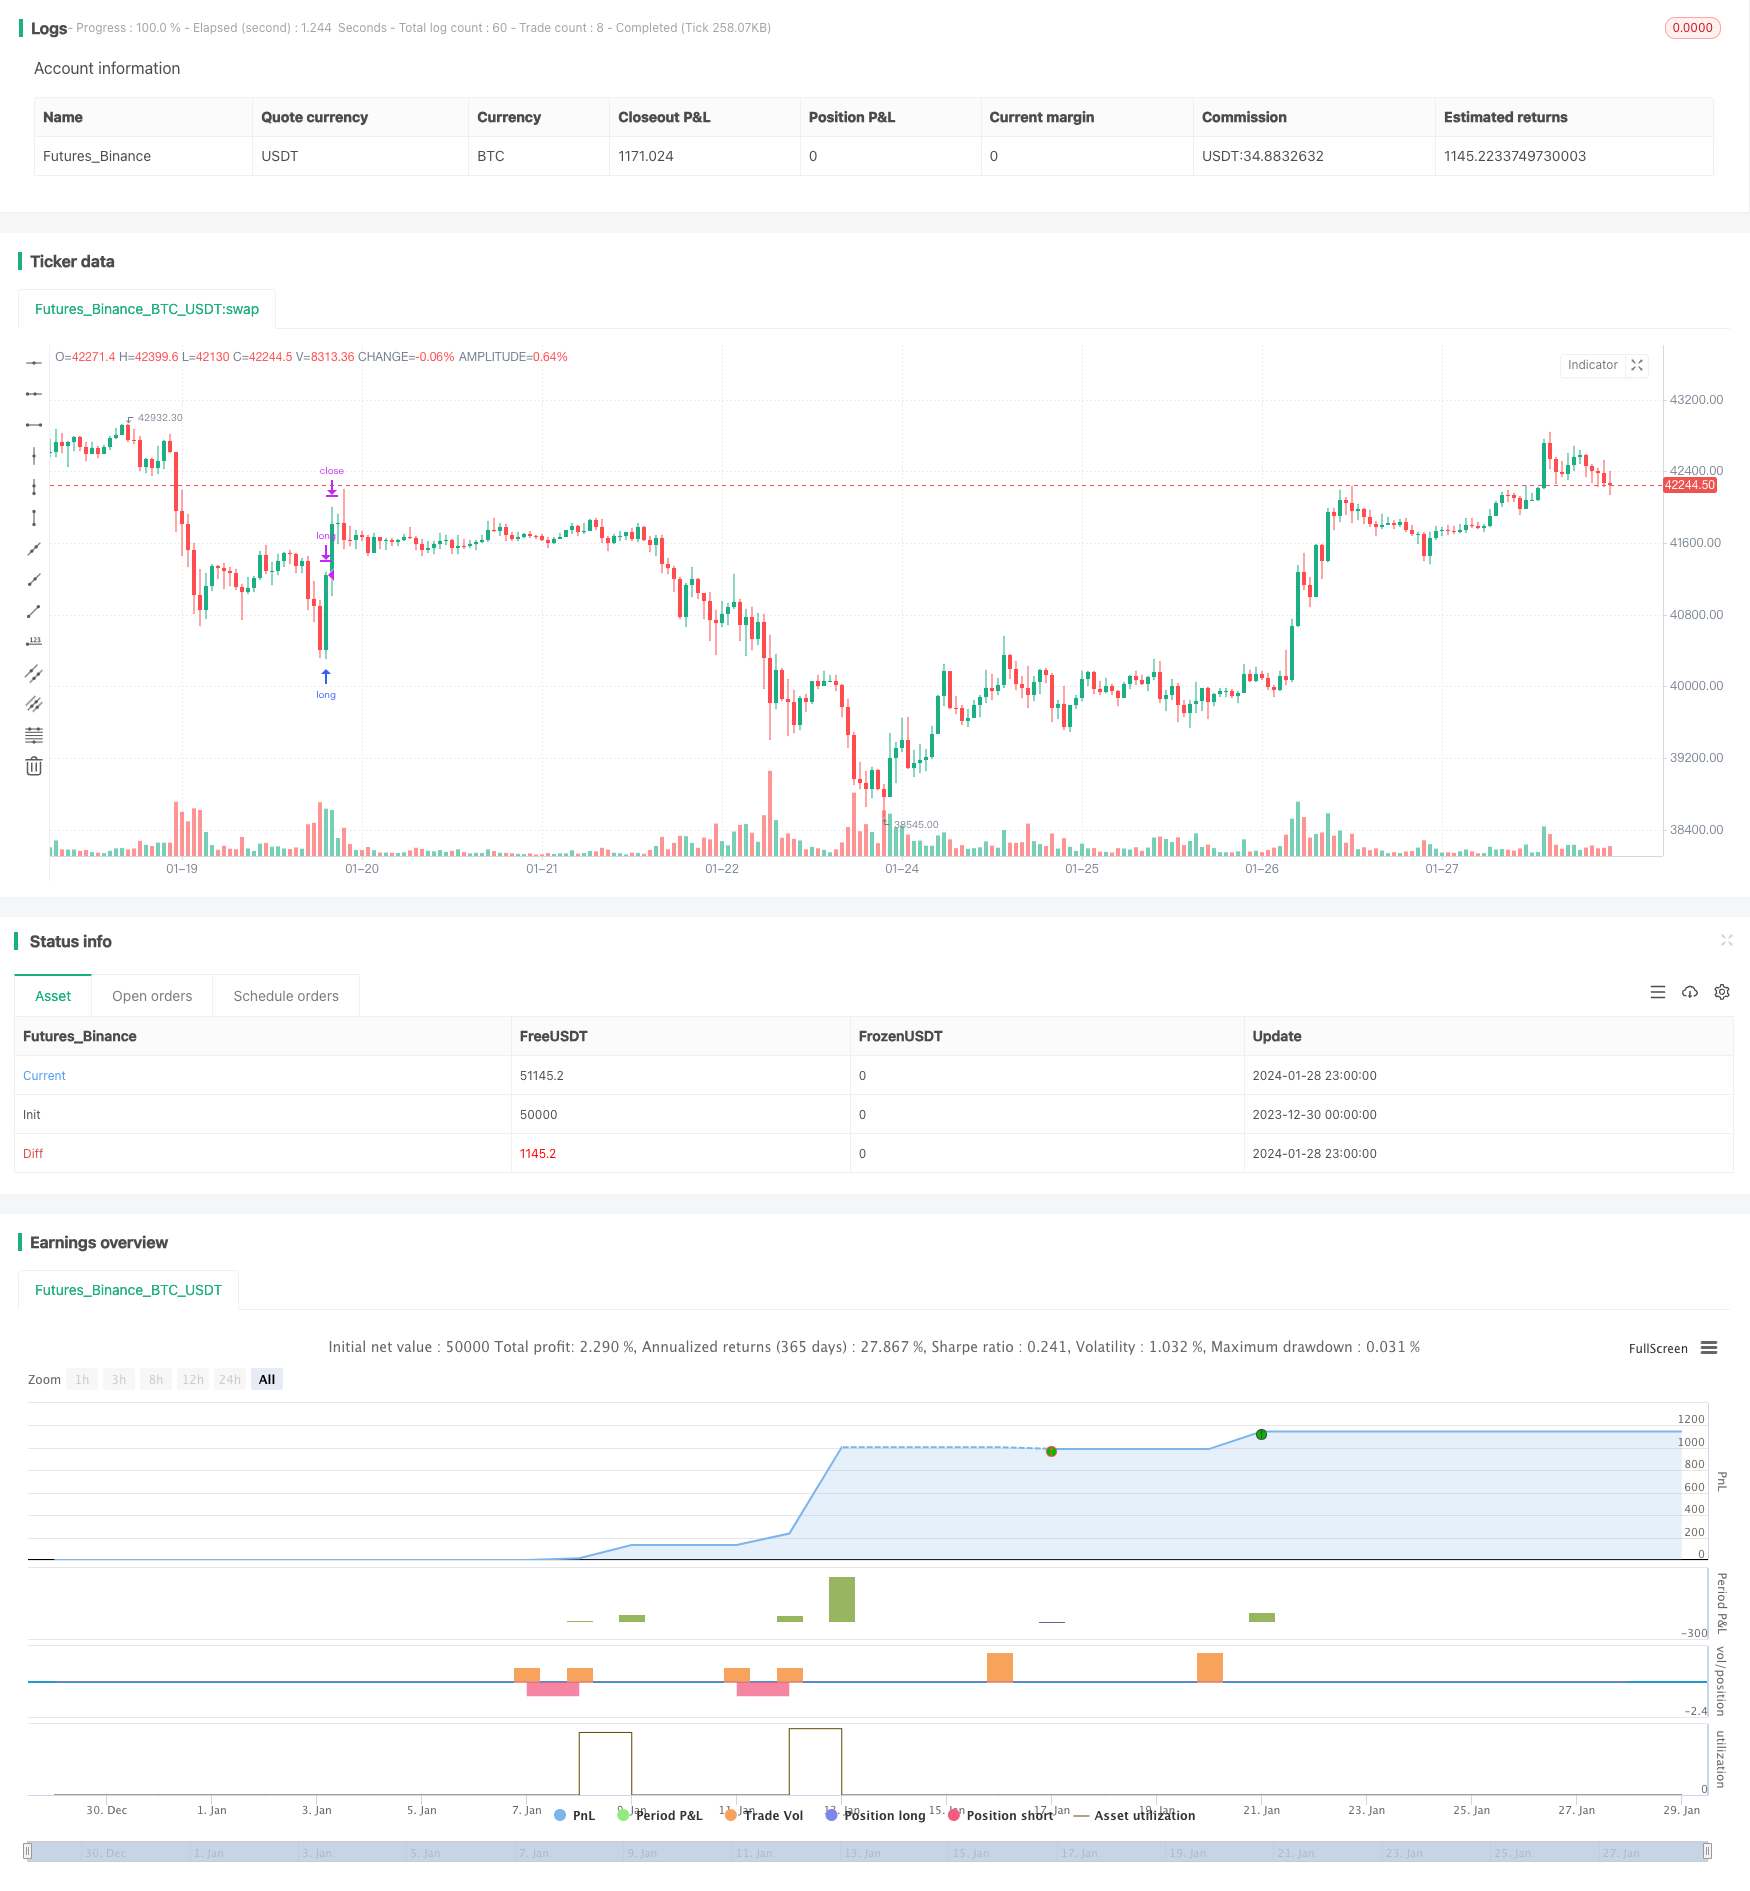
Name
布林带均线交叉策略Bollinger-Band-Moving-Average-Crossover-Strategy
Author
ChaoZhang
Strategy Description
该策略是基于布林带和移动平均线的交叉进行买入和卖出操盘的策略。主要运用5分钟时间周期布林带指标判断价格震荡区间,结合移动平均线判定趋势方向,根据布林带上下轨和中间轨的交叉情况制定交易策略。该策略适用于AUD/NZD的外汇品种。
-
使用布林带指标判断价格的上下限。布林带中轨是20周期的简单移动平均线,上轨线是中轨加上标准差的两倍,下轨线是中轨减去标准差的两倍。
-
当收盘价从下轨线向上突破时,表明价格开始进入涨势,这个时候进行买入开仓。
-
当收盘价超过布林带的中轨线时,说明价格已经上涨到中轨以上,此时平仓离场,结束本轮交易。
-
当收盘价从上轨线向下突破时,表明价格开始进入跌势,进行卖出开仓。
-
当收盘价跌破布林带中轨线时,说明价格已经下跌到中轨以下,此时平仓离场,结束本轮交易。
-
规避错过反转的风险。该策略充分利用了布林带的特性,能够及时捕捉价格从下轨反弹和从上轨下跌的机会,避免错过反转机会带来的亏损。
-
获利能力较强。通过在关键点位进行买入卖出,并设置合理止损,能够在牛熊转换时快速切换方向获得较好收益。
-
操作频率适中。基于5分钟线形成交易信号,既能捕捉短期趋势,也不会过于频繁交易而增加交易成本。
-
布林带收敛过快风险。当市场价格剧烈波动时,布林带上下轨收敛过快,容易形成虚假突破从而发出错误信号。此时需要调整参数或暂停交易。
-
止损风险。止损过小容易被突破,止损过大又容易造成过大亏损。需要适当调整止损价位。
-
交易成本过高风险。如果交易频率过高,交易成本也会明显增加,需要适当调整参数,降低交易频率。
-
优化布林带参数。可以测试不同的周期参数、标准差参数,找到最适合该品种震荡范围的参数组合。
-
结合其他指标过滤虚假信号。可以加入像KDJ,MACD等其他因子,避免布林带单一指标判断造成错误信号的问题。
-
优化止损策略。可以通过跟踪价格实时变化来实现更精准的止损。也可以使用存量线等其他止损策略。
该策略整体较为稳定,具有一定的盈利能力。通过参数调整和止损策略优化可以进一步减少交易风险,在波动行情中获得良好收益。该策略值得进一步测试和优化,具有很好的实战应用前景。
||
This is a trading strategy based on the crossover of Bollinger Bands and moving averages to make buy and sell decisions. It mainly uses the Bollinger Bands indicator on the 5-minute timeframe to determine price fluctuation range, combined with moving averages to determine trend direction, and forms trading strategy according to the crossover situations of upper band, lower band and middle band of Bollinger Bands. This strategy is suitable for the AUD/NZD currency pair.
-
Use Bollinger Bands indicator to determine the upper and lower limits of prices. The middle band of Bollinger Bands is a 20-period simple moving average, the upper band is the middle band plus two standard deviations, and the lower band is the middle band minus two standard deviations.
-
When the closing price breaks through the lower band upward, it indicates that the price starts to go up, so we make long entry here.
-
When the closing price exceeds the middle band of Bollinger Bands, it means the price has risen above the middle band, so we exit position here to finish this round of trading.
-
When the closing price breaks through the upper band downward, it means the price starts to go down, so we make short entry here.
-
When the closing price breaks down the middle band of Bollinger Bands, it means the price has fallen below the middle band, so we exit position here to finish this round of trading.
-
Avoid missing reversal signals. This strategy makes full use of the characteristics of Bollinger Bands to capture price bounces from the lower band and drops from the upper band in a timely manner, avoiding losses caused by missing reversal opportunities.
-
Strong profitability. By making buy and sell entries at key points and setting reasonable stop loss, it can quickly switch directions during the transformation between bull and bear market to obtain better returns.
-
Appropriate trading frequency. Form trading signals based on 5-minute timeframe, which can capture short-term trends without trading too frequently to increase transaction costs.
-
Risk of too fast convergence of Bollinger Bands. When market prices fluctuate violently, the upper and lower bands of Bollinger Bands converge too fast, which can easily form false breaks and give out wrong signals. We need to adjust parameters or suspend trading at this point.
-
Stop loss risk. A stop loss that is too small may easily be broken through while a stop loss too large can lead to huge losses. We need to properly adjust the stop loss price.
-
High transaction cost risk. If the trading frequency is too high, transaction costs will also increase significantly. We need to properly adjust the parameters to reduce the trading frequency.
-
Optimize Bollinger Bands parameters. We can test different combinations of cycle parameters and standard deviation parameters to find the set of parameters that best matches the volatility range of this particular product.
-
Add other indicators to filter false signals. Indicators like KDJ and MACD can be introduced to avoid issues caused by solely relying on Bollinger Bands.
-
Optimize stop loss strategy. We can set more accurate stop loss by tracking price changes in real time. Other strategies like stock line can also be used.
This strategy is relatively stable overall with some profitability. By optimizing parameters and stop loss strategies, trading risks can be further reduced to gain good returns in volatile market conditions. This strategy is worth further testing and optimization and has very good practical application prospects.
[/trans]
Strategy Arguments
| Argument | Default | Description |
|---|---|---|
| v_input_1 | true | length |
| v_input_int_1 | 200 | emaLenght |
| v_input_int_2 | 20 | length1 |
| v_input_string_1 | 0 | Basis MA Type: SMA |
| v_input_2_close | 0 | Source: close |
| v_input_float_1 | 2 | StdDev |
| v_input_int_3 | false | Offset |
Source (PineScript)
/*backtest
start: 2023-12-30 00:00:00
end: 2024-01-29 00:00:00
period: 1h
basePeriod: 15m
exchanges: [{"eid":"Futures_Binance","currency":"BTC_USDT"}]
*/

//@version=5
// This source code is subject to the terms of the Mozilla Public License 2.0 at https://mozilla.org/MPL/2.0/
// © theTradeAI

strategy('TradeAI - 5min AUDNZD Strategy', overlay=true)

//////////////////////////////
//////// STOP ORDERS DETECTING
//////////////////////////////

length = input(1)

h = ta.highest(high, length)
l = ta.lowest(low, length)

//////////////////////////////
//////// EMAS
//////////////////////////////

emaLenght = input.int(200)

ema200 = ta.ema(close,emaLenght)

//////////////////////////////
//////// BOLLINGER BANDS
//////////////////////////////

length1 = input.int(20, minval=1)
maType = input.string("SMA", "Basis MA Type", options = ["SMA", "EMA", "SMMA (RMA)", "WMA", "VWMA"])
src = input(close, title="Source")
mult = input.float(2.0, minval=0.001, maxval=50, title="StdDev")

ma(source, length1, _type) =>
    switch _type
        "SMA" => ta.sma(source, length1)
        "EMA" => ta.ema(source, length1)
        "SMMA (RMA)" => ta.rma(source, length1)
        "WMA" => ta.wma(source, length1)
        "VWMA" => ta.vwma(source, length1)

basis = ma(src, length1, maType)
dev = mult * ta.stdev(src, length1)
upperr = basis + dev
lowerr = basis - dev
offset = input.int(0, "Offset", minval = -500, maxval = 500)


//////////////////////////////
//////// ENTRY & EXIT
//////////////////////////////

// Buy entry
if ta.crossover(lowerr, close)
    strategy.entry('long', strategy.long, stop=h)

// Buy entry CANCEL
if close > lowerr
    strategy.cancel('long')

// Buy exit
if close > basis
    strategy.close('long')

// Sell entry
if ta.crossunder(upperr, close)
    strategy.entry('short', strategy.short, stop=l)

// Sell entry CANCEL
if close < upperr
    strategy.cancel('short')

// Sell exit
if close < basis
    strategy.close('short')
Detail
https://www.fmz.com/strategy/440448
Last Modified
2024-01-30 16:37:47
