Name
大神波动带RSI交易策略Gods-Bollinger-Bands-RSI-Trading-Strategy
Author
ChaoZhang
Strategy Description
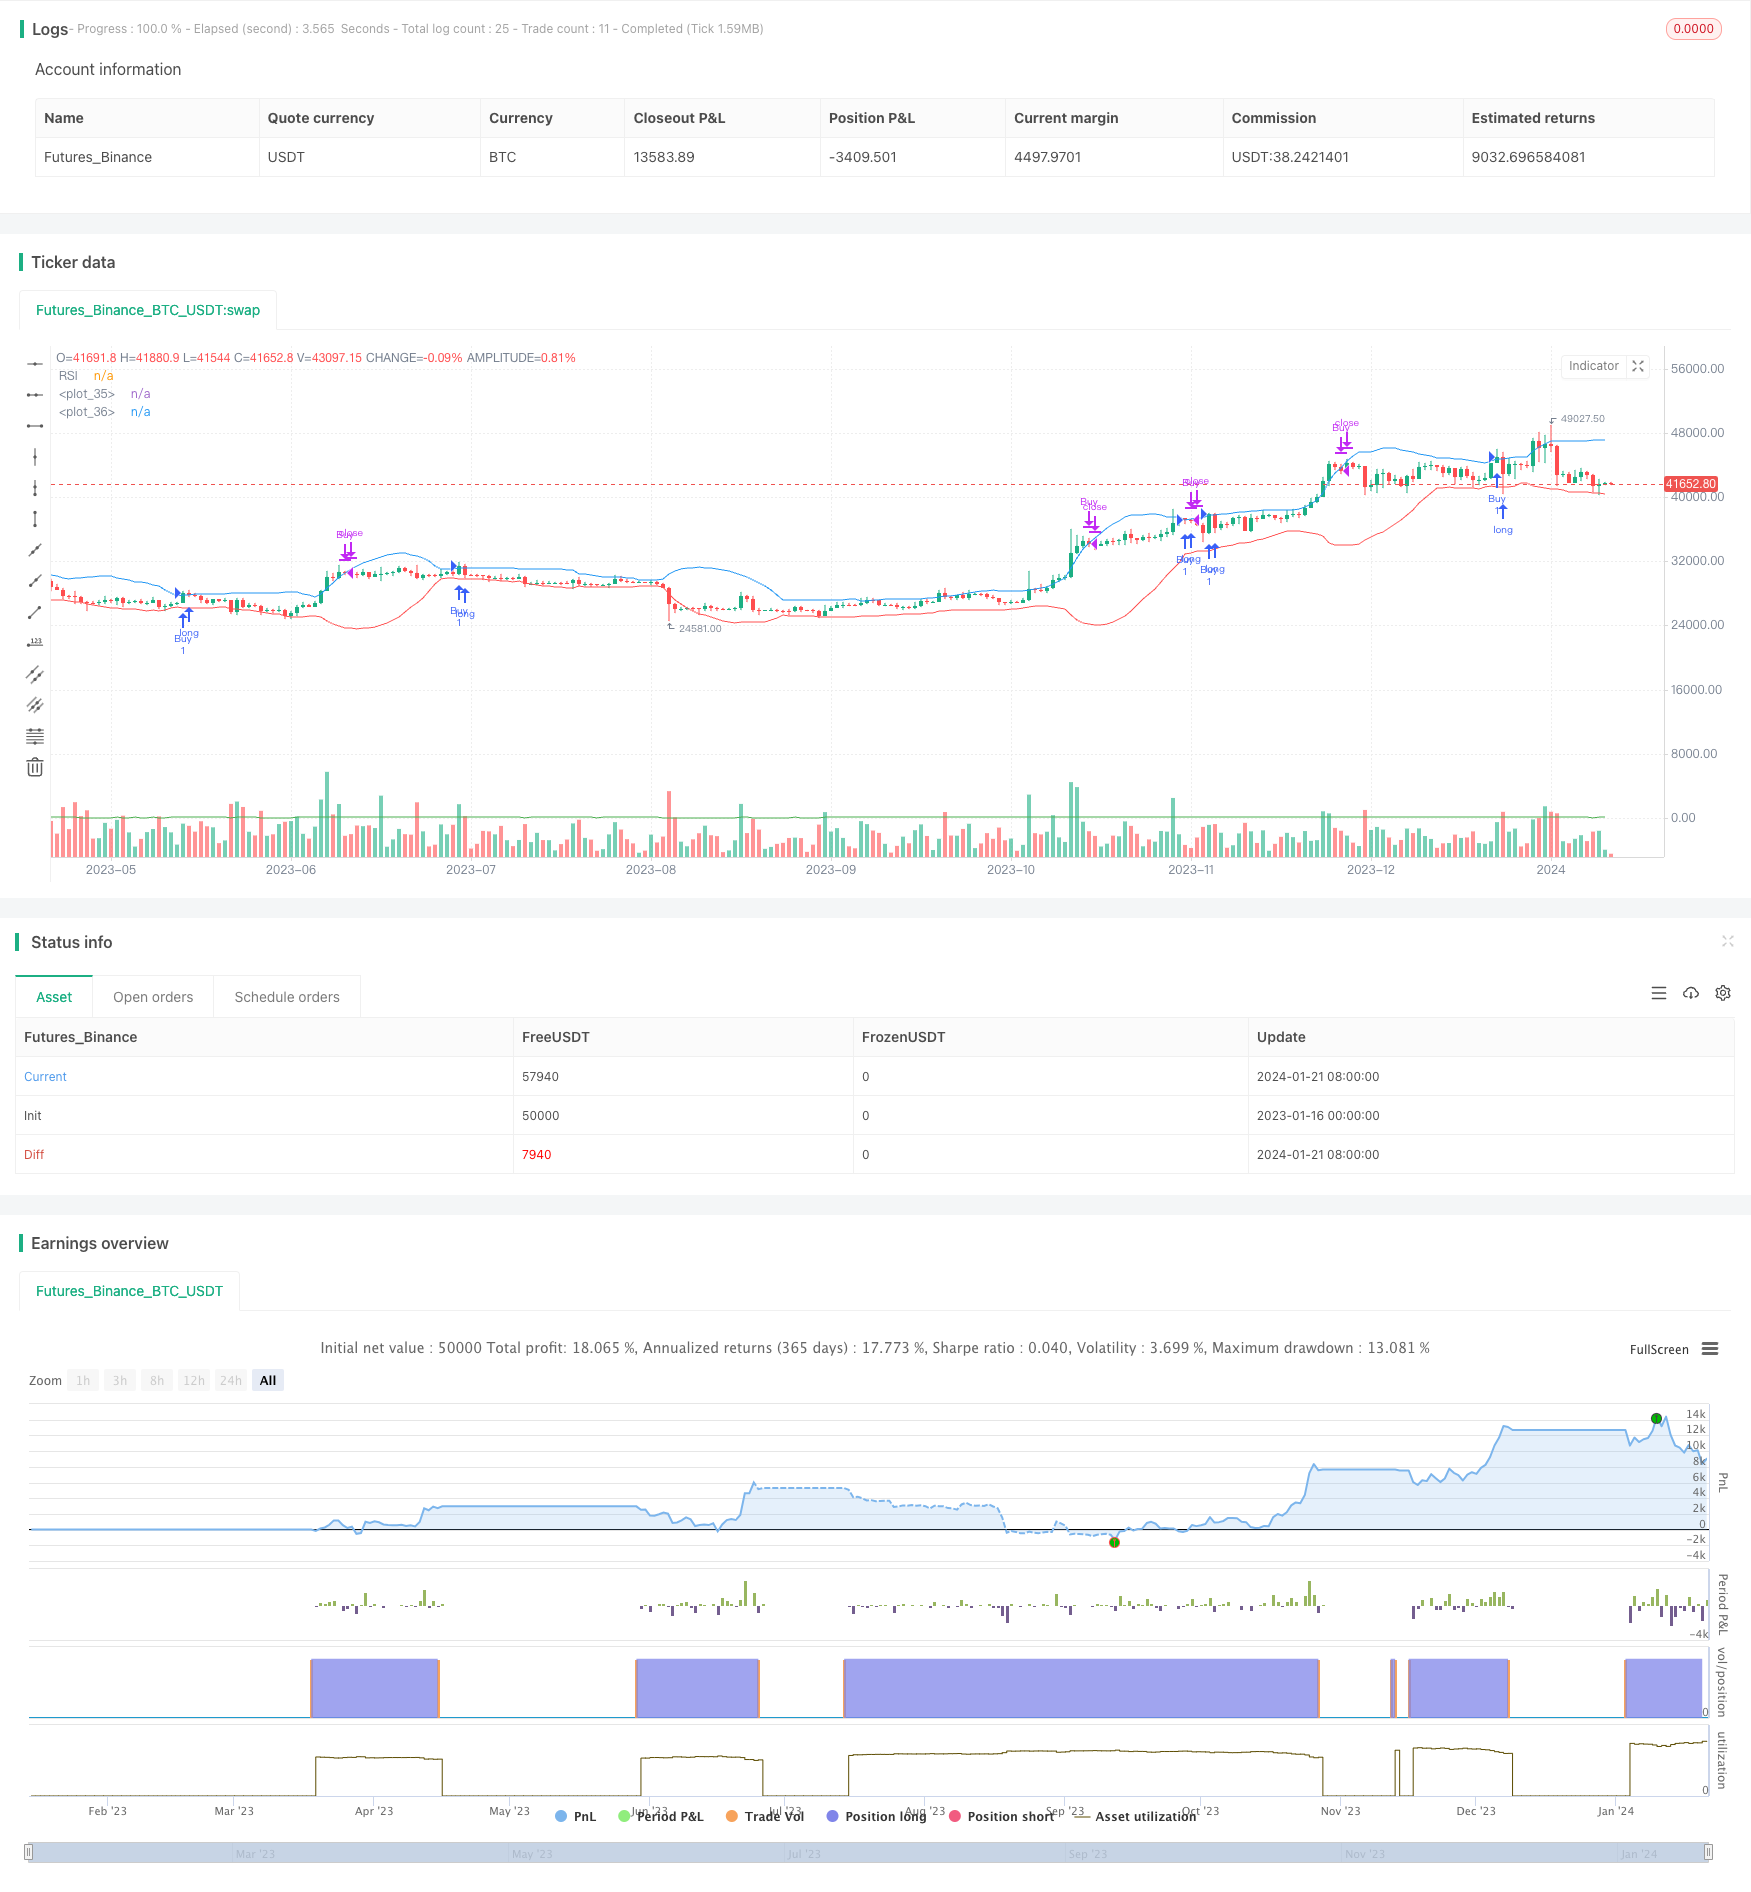
大神波动带RSI交易策略通过结合波动带指标和相对强弱指数(RSI)指标,在价格突破上轨且RSI指标显示为超卖信号时产生买入信号;当价格跌破上轨且RSI指标显示为超买信号时产生卖出信号。该策略主要利用波动带指标判断市场波动的节奏变化,结合RSI指标发现超买超卖现象,在反转点位发出交易信号。
该策略的核心逻辑基于以下几点:
-
计算20日的收盘价简单移动平均线作为基准中轨。
-
在中轨的基础上计算上下轨,上轨为中轨+2倍的20日收盘价标准差,下轨为中轨-2倍的20日收盘价标准差。构成波动带。
-
计算14日RSI指标判断超买超卖现象。RSI低于20为超卖,高于70为超买。
-
当收盘价由下向上突破上轨,且RSI指标显示超卖信号,产生买入信号。
-
当收盘价由上向下跌破上轨,且RSI指标显示超买信号,产生卖出信号。
该策略通过波动带指标判断价格波动的节奏和速度,并结合RSI指标发现反转点位,在可能的反转点发出交易信号。
-
波动带指标能判断市场的波动节奏和方向,RSI指标判断超买超卖现象,两者结合形成有效的交易信号。
-
RSI指标参数可调节,可以根据不同市场设置不同的超买超卖水平,避免错误信号。
-
波动带参数也可以调整,根据市场波动范围和速度设定合适的参数,提高获利概率。
-
突破上轨形成买入信号,跌破上轨形成卖出信号,简单易懂的交易逻辑。
-
可同时用于股市、外汇和数字货币等市场。
-
市场持续向上时,可能造成多次误判买入信号。可通过优化RSI参数降低错误信号率。
-
震荡行情中,波动带上下轨震荡频繁,可能导致频繁交易亏损。可适当放宽突破参数,减少无谓交易。
-
代码中假设超买超卖标准固定,实际上应该根据不同市场波动程度设定参数。
-
波动带和RSI指标都存在滞后,不能提前预测价格走势,只能追踪价格变化。
-
根据不同市场的特点,调整波动带参数,增大波动带宽度,降低误交易概率。
-
RSI参数也需要针对不同市场调整,适当调高超买超卖标准,避免多次触发错误交易信号。
-
增加其他指标判断,如KDJ、MACD等,避免波动带和RSI单一指标判断错误。
-
增加止损策略,设定合理的止损点,避免单次亏损过大。
-
可考虑 Breakout 突破或回测测试参数优化,进一步提高策略稳定性。
大神波动带RSI交易策略通过波动带指标判断价格波动速度和RSI指标判断超买超卖现象,在可能的反转点发出交易信号。该策略整合了多个指标优势,交易逻辑简单清晰,可广泛适用于股市、外汇、数字货币等交易市场,是一种有效的趋势交易策略。但也存在一定改进空间,可从调整参数、增设指标、止损机制等多方面进行优化,使策略更稳定可靠。
||
God's Bollinger Bands RSI trading strategy generates buy signals when the price crosses above the upper Bollinger Band and the RSI is showing an oversold signal; it generates sell signals when the price crosses below the upper Bollinger Band and the RSI is showing an overbought signal. This strategy mainly uses the Bollinger Bands indicator to judge changes in market volatility rhythm and combines with the RSI indicator to detect overbought and oversold phenomena to issue trading signals at inflection points.
The core logic of this strategy is based on the following points:
-
Calculate the 20-period simple moving average of the closing price as the base middle band.
-
Calculate the upper and lower bands on the basis of the middle band. The upper band is the middle band + 2 times the 20-period standard deviation of the closing price, and the lower band is the middle band - 2 times the 20-period standard deviation of the closing price.
-
Calculate the 14-period RSI indicator to judge overbought and oversold phenomena. RSI below 20 is oversold and above 70 is overbought.
-
When the closing price breaks through the upper rail upward and the RSI indicator shows an oversold signal, a buy signal is generated.
-
When the closing price breaks through the upper rail downward and the RSI indicator shows an overbought signal, a sell signal is generated.
This strategy judges the rhythm and speed of price fluctuations through the Bollinger Bands indicator and detects possible reversal points with the RSI indicator to issue trading signals.
-
The Bollinger Bands indicator can determine market volatility rhythm and direction, and the RSI indicator judges overbought and oversold phenomena. The combination forms effective trading signals.
-
The RSI indicator parameters are adjustable and can set different overbought and oversold levels for different markets to avoid wrong signals.
-
The Bollinger Bands parameters can also be adjusted according to the market volatility range and speed to set appropriate parameters and improve profitability.
-
Breaking through the upper track forms a buy signal, and breaking through the upper track downward forms a sell signal. The trading logic is simple and easy to understand.
-
Can be used in stock, forex and cryptocurrency markets.
-
In a sustained upside market, it may cause multiple misjudgments of buy signals. The error signal rate can be reduced by optimizing the RSI parameters.
-
In a choppy market, the upper and lower tracks of the Bollinger Bands oscillate frequently, which may lead to frequent unprofitable trades. Appropriately loosen the breakout parameters to reduce unnecessary trades.
-
The code assumes that the criteria for overbought and oversold are fixed, but they should be set according to different market volatility levels.
-
Both Bollinger Bands and RSI indicators have lags and cannot predict price movements in advance but can only track price changes.
-
According to the characteristics of different markets, adjust the parameters of Bollinger Bands, increase the width of Bollinger Bands, and reduce the probability of erroneous transactions.
-
RSI parameters also need to be adjusted for different markets, appropriately increase the overbought and oversold criteria to avoid triggering multiple erroneous trading signals.
-
Increase other indicators for judgment, such as KDJ and MACD, to avoid errors caused by single Bollinger Bands and RSI indicators.
-
Increase stop loss strategy and set reasonable stop loss points to avoid excessive losses.
-
Breakout testing or backtesting parameter optimization can be considered to further improve strategy stability.
God's Bollinger Bands RSI trading strategy issues trading signals at possible reversal points by judging price volatility speed through Bollinger Bands indicator and overbought and oversold phenomena through RSI indicator. This strategy integrates the advantages of multiple indicators with simple and clear trading logic, and can be widely applied to stock, forex, cryptocurrency and other trading markets as an effective trend trading strategy. But there is also room for improvement, such as adjusting parameters, adding indicators, stop loss mechanism and so on to make the strategy more stable and reliable.
[/trans]
Strategy Arguments
| Argument | Default | Description |
|---|---|---|
| v_input_1 | 3 | Number of Candles Outside BB |
| v_input_2 | 3 | Number of Candles Outside Upper BB |
| v_input_3 | 14 | RSI Length |
| v_input_4 | 20 | RSI Oversold Level |
| v_input_5 | 70 | RSI Overbought Level |
| v_input_6 | 20 | BB Length |
| v_input_7 | 2 | BB Standard Deviation |
Source (PineScript)
/*backtest
start: 2023-01-16 00:00:00
end: 2024-01-22 00:00:00
period: 1d
basePeriod: 1h
exchanges: [{"eid":"Futures_Binance","currency":"BTC_USDT"}]
*/

//@version=4
strategy("Bollinger Band + RSI Strategy", overlay=true)

// Input variables
numCandlesOutsideBB = input(3, "Number of Candles Outside BB")
numCandlesOutsideUpperBB = input(3, "Number of Candles Outside Upper BB")
rsiLength = input(14, "RSI Length")
rsiOversoldLevel = input(20, "RSI Oversold Level")
rsiOverboughtLevel = input(70, "RSI Overbought Level")

// Bollinger Bands
length = input(20, minval=1, title="BB Length")
mult = input(2.0, minval=0.001, maxval=50, title="BB Standard Deviation")
basis = sma(close, length)
dev = mult * stdev(close, length)
upperBB = basis + dev
lowerBB = basis - dev

// RSI
rsi = rsi(close, rsiLength)

// Buy condition
buyCondition = crossover(close, upperBB) and rsi > rsiOversoldLevel

// Sell condition
sellCondition = crossunder(close, upperBB) and rsi > rsiOverboughtLevel

// Strategy
if buyCondition
    strategy.entry("Buy", strategy.long)
if sellCondition
    strategy.close("Buy")

// Plotting
plot(upperBB, color=color.blue)
plot(lowerBB, color=color.red)
plot(rsi, "RSI", color=color.green)
Detail
https://www.fmz.com/strategy/439744
Last Modified
2024-01-23 14:33:13
