Name
多重均线多头趋势策略Multi-EMA-Bullish-Trend-Strategy
Author
ChaoZhang
Strategy Description
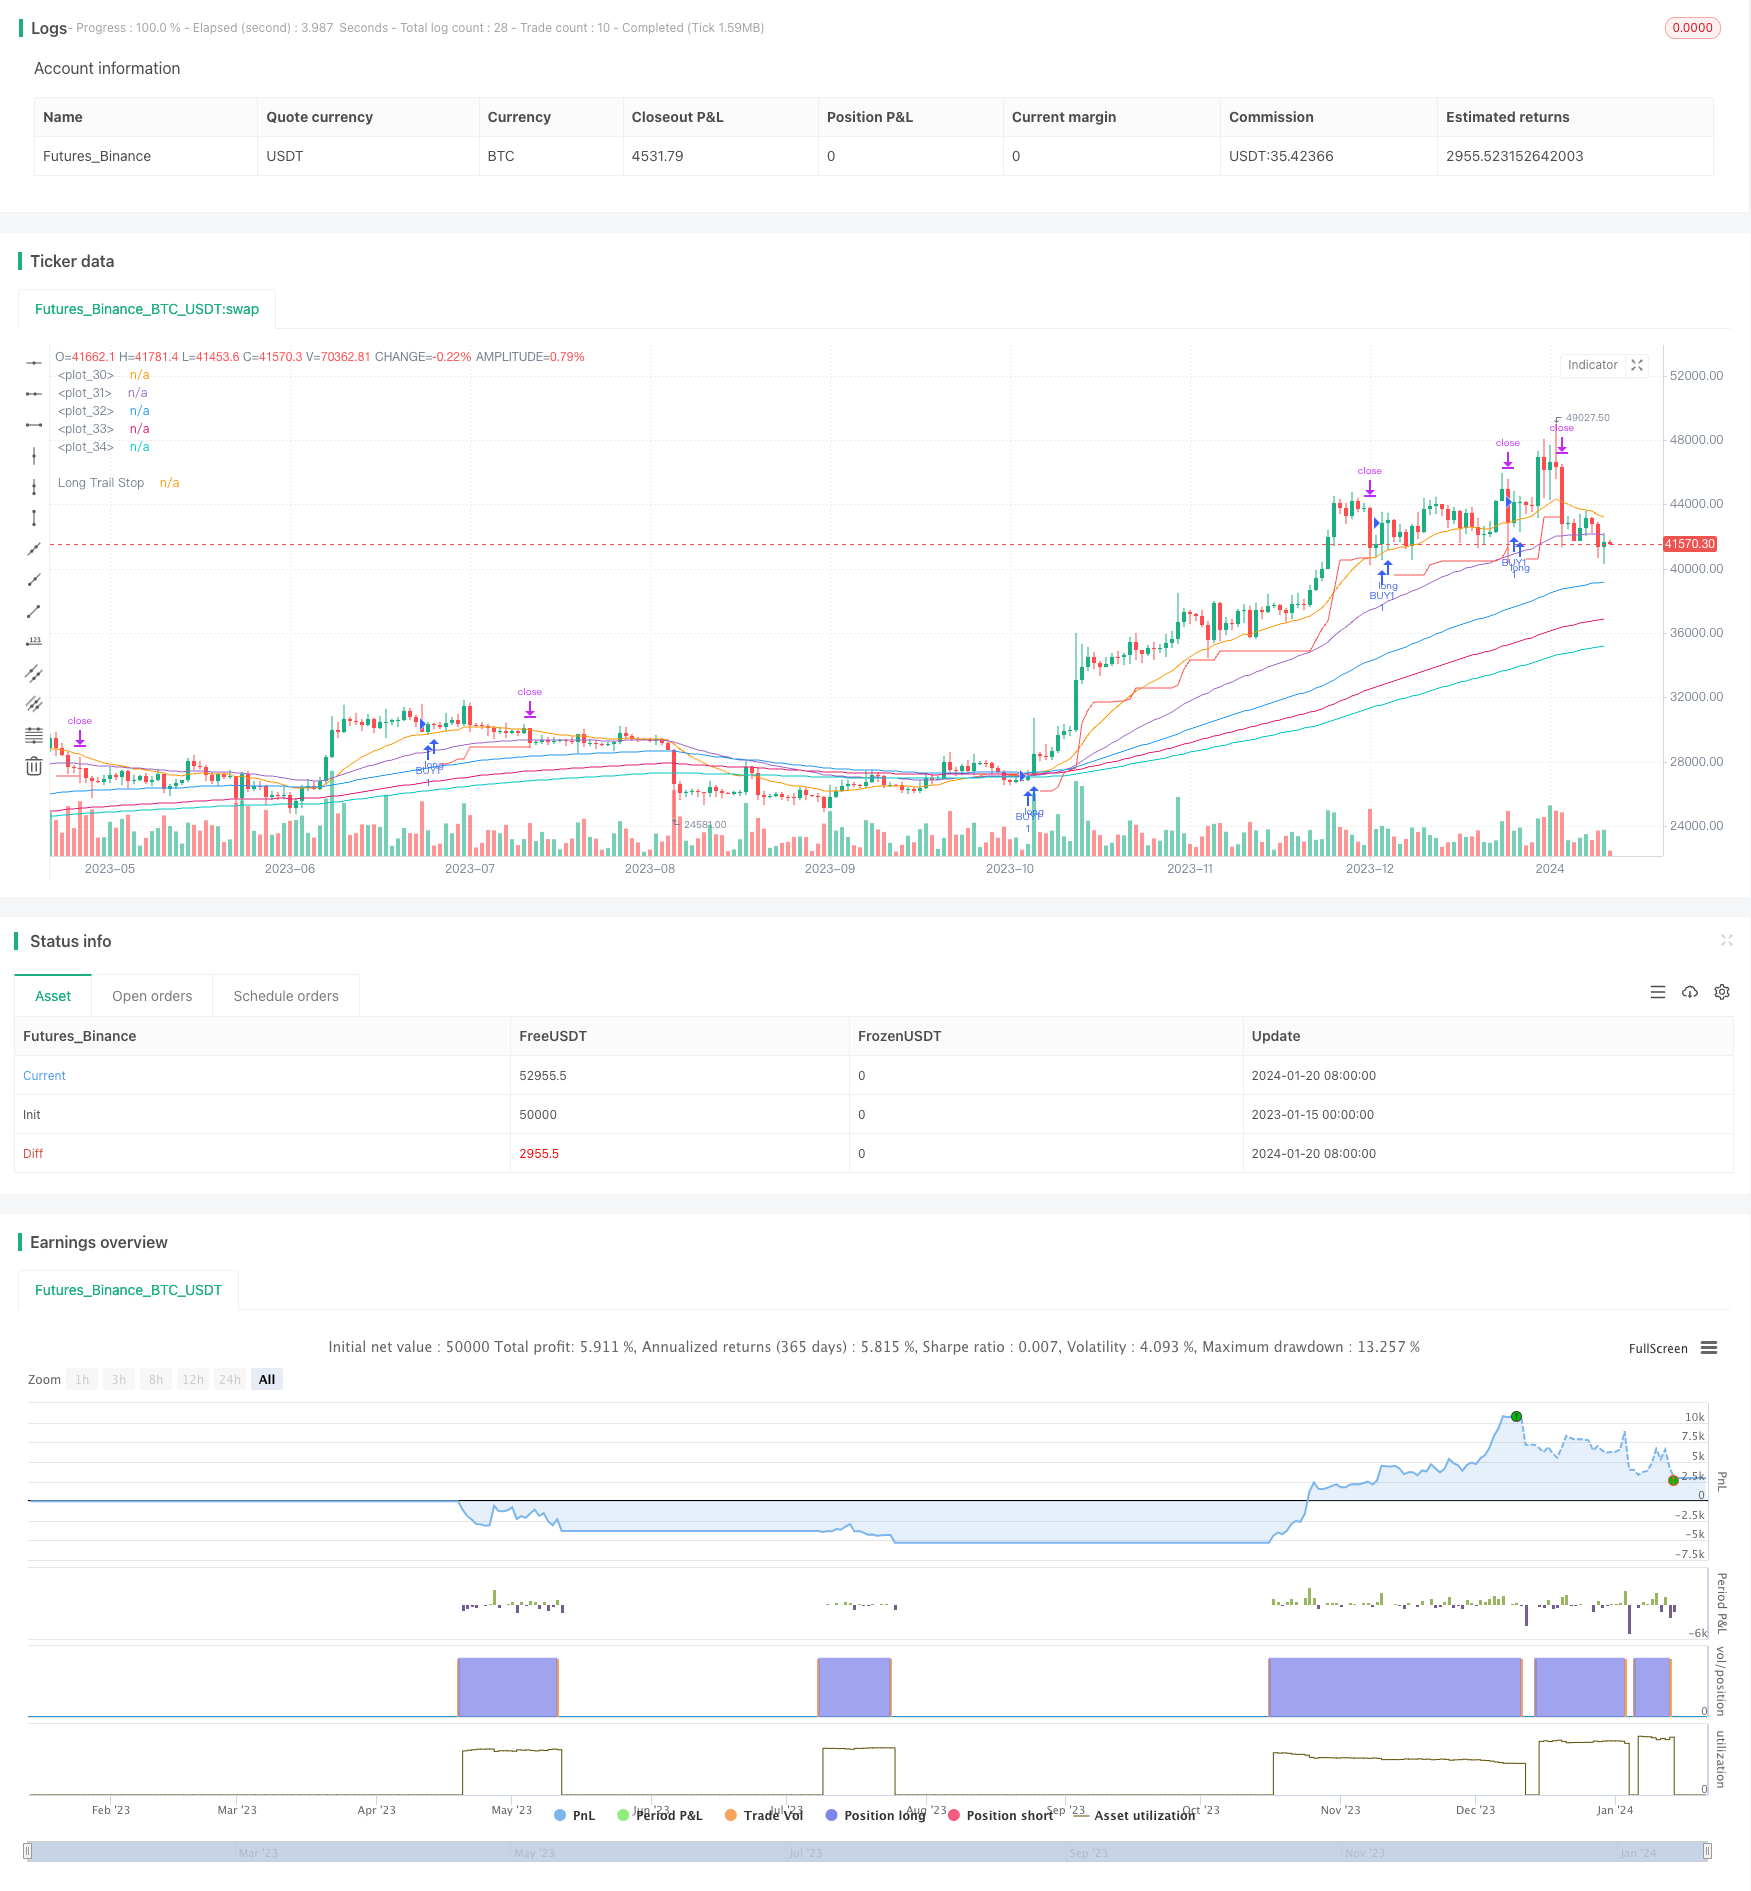
多重均线多头趋势策略是一个基于多条不同周期的指数移动平均线(EMA)构建判断的趋势跟踪策略。它会在价格突破10日EMA并且其他较长周期的EMA线呈多头排列时做多;然后使用8%的尾随止损来锁定利润。
该策略使用了10日、20日、50日、100日、150日和200日六条不同周期的EMA线。这些EMA线被用来判断市场目前所处的周期阶段。当短期EMA线(如10日线)上穿较长周期的EMA线(如20日、50日线)时,被视为市场步入多头趋势的markup阶段。
具体来说,当满足以下几个条件时,策略会开仓做多:
- 10日EMA线高于20日EMA线
- 20日EMA线高于50日EMA线
- 100日EMA线高于150日EMA线
- 150日EMA线高于200日EMA线
- 收盘价上穿10日EMA线
做多开仓后,策略会使用8%的尾随止损来锁定利润。也就是说,只要股票价格没有回落超过购买价格的8%,那么就会继续持有该头寸。一旦出现超过8%的回撤,就会停止损失。
总的来说,该策略的核心思路是:使用EMA多重筛选条件判断进入多头趋势后,尾随止损来锁定利润。
这种多重均线多头趋势策略具有以下几点主要优势:
- 可以有效过滤假突破,确保抓住价格循环的markup阶段,减少不必要的交易次数。
- EMA线的多重过滤可以减少止损被击穿的可能性,可以更安全的持仓。
- 8%的尾随止损 neither too tight nor too loose,既可以很好的锁定利润,也可以避免过于频繁的止损。
- 该策略对参数调优灵活,可以根据不同品种找到最佳参数组合。
该策略也存在一些风险需要注意:
- EMA线排列顺序并不能百分之百判断行情趋势,仍存在一定被套的可能。
- 8%的尾随止损在大幅行情中可能会损失一部分利润。
- EMA均线系统本身滞后于价格变化,转折点判定可能会有点滞后。
针对以上风险,我们可以通过适当调整EMA周期参数或者引入其他指标作为辅助判断来进行优化和改进。
考虑到该策略的特点,未来可以从以下几个方面进行优化:
- 测试不同的EMA组合和周期参数,找到最优参数。
- 增加volatility index类指标来判断趋势强度,避免不必要开仓。
- 增加更多过滤指标,如MACD, KDJ等判断多头排列。
- 引入机器学习算法,实现动态止损。
多重均线多头趋势策略整体来说是一个较为稳健可靠的趋势跟踪策略。它同时兼顾了趋势判断和风险控制。通过参数调优和算法优化还具有很大的改进空间。总的来说这是一个值得尝试使用和研究的有效策略。
||
The Multi-EMA Bullish Trend Strategy is a trend following strategy based on multiple exponential moving averages (EMA) of different periods for trend determination. It goes long when price breaks above 10-day EMA and other longer period EMAs are in bullish alignment; and uses 8% trailing stop loss to lock in profits.
The strategy employs 6 EMAs of periods 10, 20, 50, 100, 150 and 200 days. These EMAs are used to determine the current cyclical stage of the market. When shorter period EMAs (e.g. 10-day) cross over longer period ones (e.g. 20-, 50-day), it signals the market has entered the markup phase of a bull trend.
Specifically, the strategy will go long when the following conditions are met:
- 10-day EMA is higher than 20-day EMA
- 20-day EMA is higher than 50-day EMA
- 100-day EMA is higher than 150-day EMA
- 150-day EMA is higher than 200-day EMA
- Close price crosses over 10-day EMA
After opening long position, an 8% trailing stop loss is used to lock in profits. That means the position will be kept open as long as the price does not fall more than 8% from the entry price. Once the drawdown exceeds 8%, the position will be closed to stop loss.
In summary, the key idea of this strategy is to enter bull trend when confirmed by multiple EMA alignment, and use trailing stop loss to lock in profits.
The Multi-EMA bull trend strategy has the following major strengths:
- It can effectively filter false breakouts and ensure catching the markup cycles, reducing unnecessary trades.
- The multiple EMA filters lower the chance of stop loss being hit, allowing safer holding of positions.
- The 8% trailing stop loss is neither too tight nor too loose, balancing profit-taking and loss-stopping.
- The strategy allows flexible parameter tuning for optimization across different products.
There are also some risks to note for this strategy:
- EMA sequence cannot guarantee trend direction for 100% cases, some whipsaws can still occur.
- The 8% trailing stop may give up some profits during huge trends.
- EMA systems have inherent laggingness, turning points confirmation can be slightly delayed.
To address these risks, we can optimize by adjusting EMA periods or incorporating auxiliary indicators for improved judgment.
Considering the characteristics of this strategy, future optimizations can focus on the following aspects:
- Test different EMA combinations and period sets to find optimal parameters.
- Add volatility index indicators to gauge trend strength for avoiding unnecessary entries.
- Include more filtering indicators like MACD, KDJ for bullish alignment confirmation.
- Employ machine learning algorithms for dynamic stop loss implementation.
Overall, the Multi-EMA Bull Trend Strategy is a robust and reliable trend following system, balancing trend determination and risk control. There is still great potential for improvement via parameter tuning and algorithm optimization. It is an effective strategy worth trying out and researching on.
[/trans]
Strategy Arguments
| Argument | Default | Description |
|---|---|---|
| v_input_1 | 2000 | Backtest Start Year |
| v_input_2 | true | Backtest Start Month |
| v_input_3 | true | Backtest Start Day |
| v_input_4 | 2100 | Backtest Stop Year |
| v_input_5 | 12 | Backtest Stop Month |
| v_input_6 | 30 | Backtest Stop Day |
| v_input_float_1 | 8 | Long Trailing Stop (%) |
Source (PineScript)
/*backtest
start: 2023-01-15 00:00:00
end: 2024-01-21 00:00:00
period: 1d
basePeriod: 1h
exchanges: [{"eid":"Futures_Binance","currency":"BTC_USDT"}]
*/

//@version=5
strategy('SirSeff\'s EMA Rainbow', overlay=true)
// Testing Start dates
testStartYear = input(2000, 'Backtest Start Year')
testStartMonth = input(1, 'Backtest Start Month')
testStartDay = input(1, 'Backtest Start Day')
testPeriodStart = timestamp(testStartYear, testStartMonth, testStartDay, 0, 0)
//Stop date if you want to use a specific range of dates
testStopYear = input(2100, 'Backtest Stop Year')
testStopMonth = input(12, 'Backtest Stop Month')
testStopDay = input(30, 'Backtest Stop Day')
testPeriodStop = timestamp(testStopYear, testStopMonth, testStopDay, 0, 0)

testPeriod() =>
    time >= testPeriodStart and time <= testPeriodStop ? true : false
// Component Code Stop

//TSP
trailStop = input.float(title='Long Trailing Stop (%)', minval=0.0, step=0.1, defval=8) * 0.01

longStopPrice = 0.0
longStopPrice := if strategy.position_size > 0
    stopValue = close * (1 - trailStop)
    math.max(stopValue, longStopPrice[1])
else
    0

//PLOTS
plot(series=strategy.position_size > 0 ? longStopPrice : na, color=color.new(color.red, 0), style=plot.style_linebr, linewidth=1, title='Long Trail Stop', offset=1, title='Long Trail Stop')
plot(ta.ema(close, 20))
plot(ta.ema(close, 50))
plot(ta.ema(close, 100))
plot(ta.ema(close, 150))
plot(ta.ema(close, 200))

//OPEN
longCondition =  ta.ema(close, 10) > ta.ema(close, 20) and ta.ema(close, 20) > ta.ema(close, 50) and ta.ema(close, 100) > ta.ema(close, 150) and ta.ema(close, 150) > ta.ema(close, 200)
if longCondition and ta.crossover(close,ta.ema(close,10)) and testPeriod()
    strategy.entry("BUY1", strategy.long)

if longCondition and ta.crossover(ta.ema(close,10),ta.ema(close,20)) and testPeriod()
    strategy.entry("BUY2'", strategy.long)

//CLOSE @ TSL
if strategy.position_size > 0 and testPeriod()
    strategy.exit(id='TSP', stop=longStopPrice)
Detail
https://www.fmz.com/strategy/439620
Last Modified
2024-01-22 12:04:05
