Name
多时间框架趋势跟踪策略Swing-High-Low-Price-Channel-Strategy-V1
Author
ChaoZhang
Strategy Description
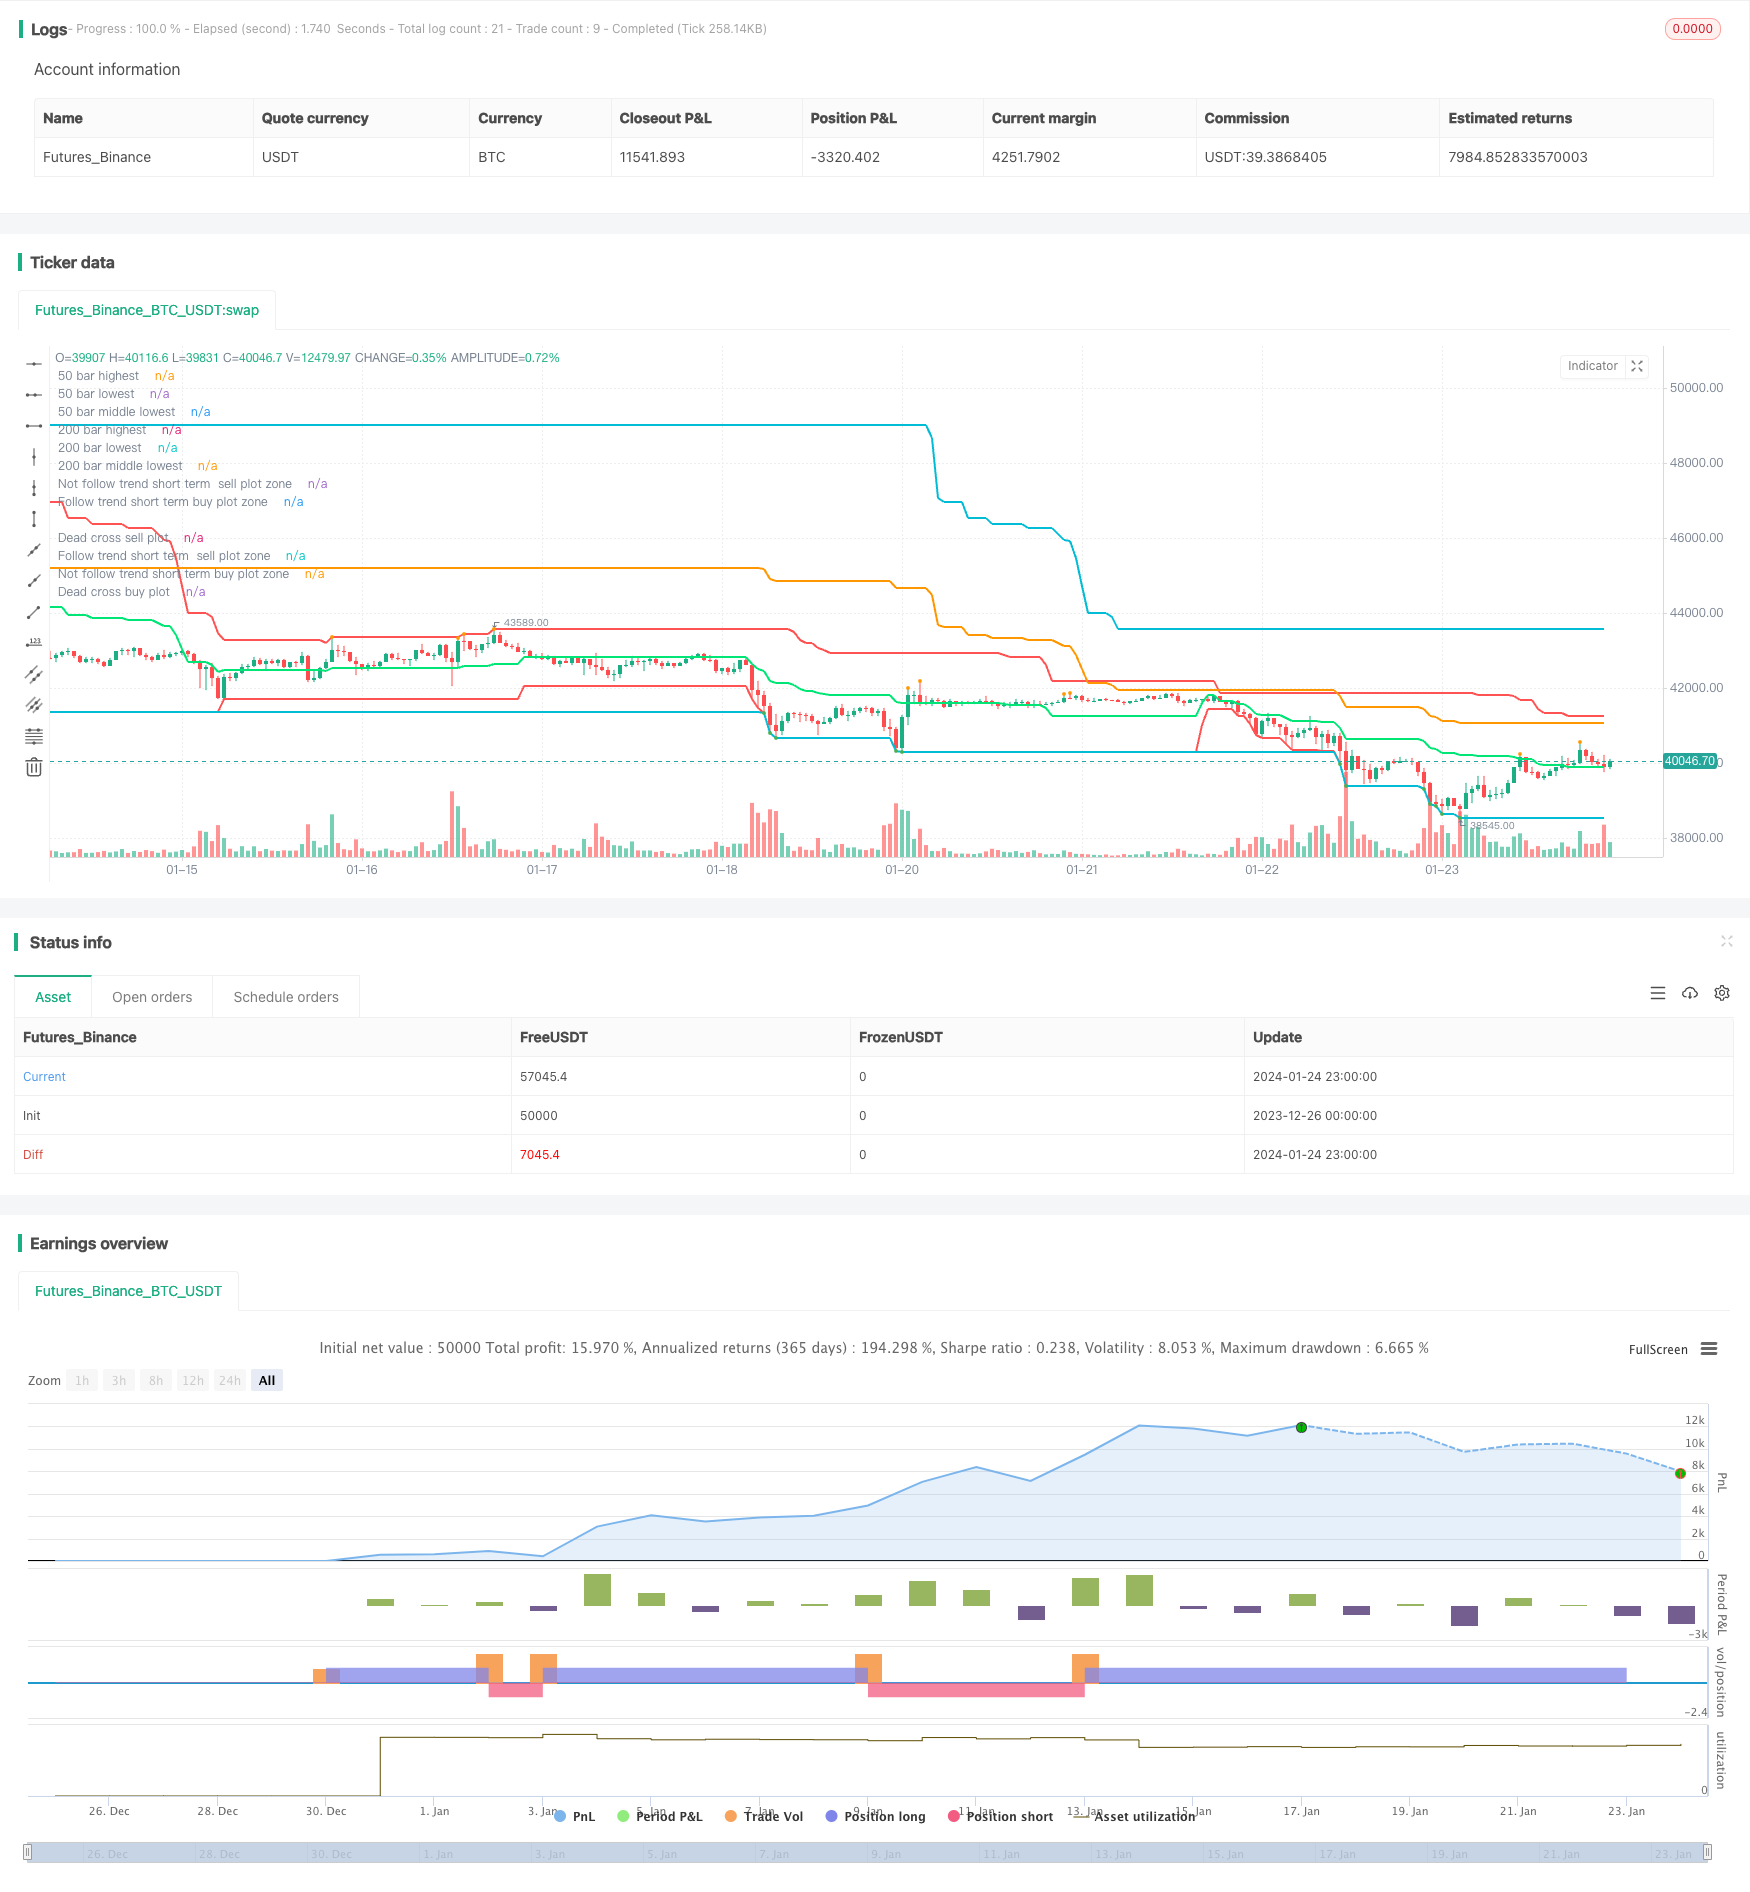
该策略通过计算不同时间周期(50个bar和200个bar)内的最高价和最低价,形成主要的价格通道,代表长期趋势方向。同时结合快速信号线和慢速信号线判断短期趋势方向。策略会在长短期趋势方向一致时提示入场。
首先,通过计算最后50个bar内的最高价、最低价,以及最后200个bar内的最高价、最低价,形成两个价格通道代表长期趋势方向。
其次,计算最后7个bar的最高价、最低价形成快速信号通道判断短期趋势;计算最后20个bar内的最高价、最低价形成慢速信号通道判断较短期的趋势。
最后,当快速信号通道、慢速信号通道以及长期价格通道的方向一致时提示入场信号。例如所有通道均处于上升趋势,则提示买入;所有通道均处于下降趋势,则提示卖出。
该策略最大的优势在于能够识别长短期统一的趋势方向。通过不同时间周期价格通道的确认,可以有效避免被短期市场噪音所迷惑。
另外,策略采用多时间框架判断,即使短期价格出现反转也不会轻易改变信号,保证了信号稳定性。
该策略主要风险在于长短期趋势反转时,由于需要多个时间周期通道确认,信号产生会有一定滞后。这时如果盲目跟进可能造成损失扩大。
此外,对高频交易不友好,无法对短期价格波动做出快速反应。如果遇到剧烈行情,停损条件设定不当也会造成较大亏损。
可以考虑加入自适应动态止损策略,当价格向不利方向突破某个比例时止损出场,可有效控制风险。
另外可以增加更多不同长度的价格通道,通过投票方式决定最终信号,可提高判断准确率。
或者采用机器学习算法自动优化各通道参数,使得参数更加符合当前市场环境。
该策略整体思路清晰易懂,通过多时间框架价格通道判断市场趋势,可有效滤除短期市场噪音。但对反转行情的处理及风险控制都有待加强。若结合止损策略及参数优化,可以进一步增强策略稳定性和实战效果。
||
This strategy calculates the highest and lowest prices within different timeframes (50 bars and 200 bars) to form the main price channel representing the long-term trend. It also uses fast and slow signal lines to determine the short-term trend direction. The strategy will prompt entry signals when the long-term and short-term trend directions are consistent.
Firstly, by calculating the highest and lowest prices of the last 50 bars and the last 200 bars, two price channels are formed to represent the long-term trend direction.
Secondly, the highest and lowest prices of the last 7 bars are calculated to form a fast signal channel to judge the short-term trend; The highest and lowest prices of the last 20 bars are calculated to form a slow signal channel to judge the shorter-term trend.
Finally, entry signals are prompted when the directions of the fast signal channel, slow signal channel and long-term price channel are consistent. For example, when all channels are in an upward trend, it will prompt to buy; when all channels are in a downward trend, it will prompt to sell.
The biggest advantage of this strategy is that it can identify a unified trend direction in both long and short terms. By confirming the price channels of different time frames, it can effectively avoid being misled by short-term market noise.
In addition, the multi-timeframe judgement ensures signal stability even if short-term price reversal occurs.
The main risk of this strategy is that when long and short term trend reversal occurs, there will be a certain lag in signal generation due to the need for confirmation of multiple time frame channels. Blindly following at this time may lead to greater losses.
In addition, it is unfriendly to high frequency trading and unable to respond quickly to short-term price fluctuations. In case of violent market conditions, improper stop loss settings can also lead to large losses.
Consider joining an adaptive dynamic stop loss strategy that stops loss when the price breaks through a certain percentage in an unfavorable direction to effectively control risks.
Also, more price channels of different lengths could be added and the final signal could be decided by voting to improve accuracy.
Alternatively, machine learning algorithms could be used to automatically optimize various channel parameters to better suit the current market environment.
The overall idea of this strategy is clear and easy to understand. By judging market trends through multi-timeframe price channels, it can effectively filter out short-term market noise. However, its handling of reversal trends and risk control need improvement. By combining stop loss strategies and parameter optimization, strategy stability and practical effects can be further enhanced.
[/trans]
Strategy Arguments
| Argument | Default | Description |
|---|---|---|
| v_input_1 | 0 | Main swing channel source: H/L |
| v_input_2 | 7 | Fast Slow Length |
| v_input_3 | 20 | Slow Slow Length |
| v_input_4 | true | Show main channel only |
| v_input_5 | 2 | Main line width |
| v_input_6 | true | Signal line width |
Source (PineScript)
/*backtest
start: 2023-12-26 00:00:00
end: 2024-01-25 00:00:00
period: 1h
basePeriod: 15m
exchanges: [{"eid":"Futures_Binance","currency":"BTC_USDT"}]
*/

// This source code is subject to the terms of the Mozilla Public License 2.0 at https://mozilla.org/MPL/2.0/
// © ZoomerXeus

//@version=4
strategy("Swing High Low Price Channel V.1", overlay=true)

//========================= variable =================================//
dead_channel_source = input(title="Main swing channel source", defval="H/L", options=["H/L"])
fast_signal_length = input(title="Fast Slow Length", type=input.integer, defval=7, maxval=49, minval=1)
slow_signal_length = input(title="Slow Slow Length", type=input.integer, defval=20, maxval=49, minval=1)
is_show_only_dead_channel = input(title="Show main channel only", defval=true)
main_channel_width = input(title="Main line width", defval=2, minval=1)
signal_channel_width = input(title="Signal line width", defval=1, minval=1)

//========================= indicator function =================================//
dead_cross_high_50 = highest(high, 50)
dead_cross_high_200 = highest(high, 200)
//========================================
dead_cross_low_50 = lowest(low, 50)
dead_cross_low_200 = lowest(low, 200)
//========================================
medain_dead_cross_50 = ((dead_cross_high_50-dead_cross_low_50)*0.5)+dead_cross_low_50
medain_dead_cross_200 = ((dead_cross_high_200-dead_cross_low_200)*0.5)+dead_cross_low_200


//========================================
fasthighest = highest(high, fast_signal_length)
fastlowest = lowest(low, fast_signal_length)
//========================================
slowhighest = highest(high, slow_signal_length)
slowlowest = lowest(low, slow_signal_length)
//========================================


//========================= plot =================================//
plot(dead_channel_source == "H/L" ? dead_cross_high_50 : na,title="50 bar highest", color=color.red, linewidth=main_channel_width)
plot(dead_channel_source == "H/L" ? dead_cross_high_200 : na,title="200 bar highest", color=color.aqua, linewidth=main_channel_width)
plot(dead_channel_source == "H/L" ? dead_cross_low_50 : na,title="50 bar lowest", color=color.red, linewidth=main_channel_width)
plot(dead_channel_source == "H/L" ? dead_cross_low_200 : na,title="200 bar lowest", color=color.aqua, linewidth=main_channel_width)
plot(dead_channel_source == "H/L" ? medain_dead_cross_200 : na,title="200 bar middle lowest", color=color.orange, linewidth=main_channel_width)
plot(dead_channel_source == "H/L" ? medain_dead_cross_50 : na,title="50 bar middle lowest", color=color.lime, linewidth=main_channel_width)
//===========================================
plot(is_show_only_dead_channel == false ? fasthighest : na,title="fast signal highest", color=#ff00f9, linewidth=signal_channel_width)
plot(is_show_only_dead_channel == false ? fastlowest : na,title="fast signal lowest", color=#ff00f9, linewidth=signal_channel_width)
plot(is_show_only_dead_channel == false ? slowhighest : na,title="slow signal highest", color=color.white, linewidth=signal_channel_width)
plot(is_show_only_dead_channel == false ? slowlowest : na,title="slow signal lowest", color=color.white, linewidth=signal_channel_width)
//===========================================
plot(crossover(medain_dead_cross_50, medain_dead_cross_200) ? medain_dead_cross_200 : na, title="Dead cross buy plot", style=plot.style_circles, linewidth=6, color=color.lime)
plot(crossunder(medain_dead_cross_50, medain_dead_cross_200) ? medain_dead_cross_200 : na, title="Dead cross sell plot", style=plot.style_circles, linewidth=6, color=color.red)
plot(is_show_only_dead_channel and (medain_dead_cross_50 < medain_dead_cross_200) and high == slowhighest ? high : na, title="Follow trend short term  sell plot zone", style=plot.style_circles, linewidth=3, color=color.orange)
plot(is_show_only_dead_channel and (medain_dead_cross_50 > medain_dead_cross_200) and low == slowlowest ? low : na, title="Follow trend short term buy plot zone", style=plot.style_circles, linewidth=3, color=color.green)
plot(is_show_only_dead_channel and high == slowhighest and (high == dead_cross_high_200) ? high : na, title="Not follow trend short term  sell plot zone", style=plot.style_circles, linewidth=3, color=color.orange)
plot(is_show_only_dead_channel and low == slowlowest and (low == dead_cross_low_200) ? low : na, title="Not follow trend short term buy plot zone", style=plot.style_circles, linewidth=3, color=color.green)

//===================== open close order condition =========================================================//
strategy.entry("strong buy", true, 1, when=low == dead_cross_low_200)
strategy.exit("close strong buy 50%", "strong buy", qty_percent=50, when=high==slowhighest)
strategy.entry("strong sell", false, 1, when=high == dead_cross_high_200)
strategy.exit("close strong sell 50%", "strong sell", qty_percent=50, when=low==slowlowest)
Detail
https://www.fmz.com/strategy/440098
Last Modified
2024-01-26 15:54:45