Name
基于Renko和相对活力指数的趋势跟踪策略Renko-and-Relative-Vigor-Index-Trend-Following-Strategy
Author
ChaoZhang
Strategy Description
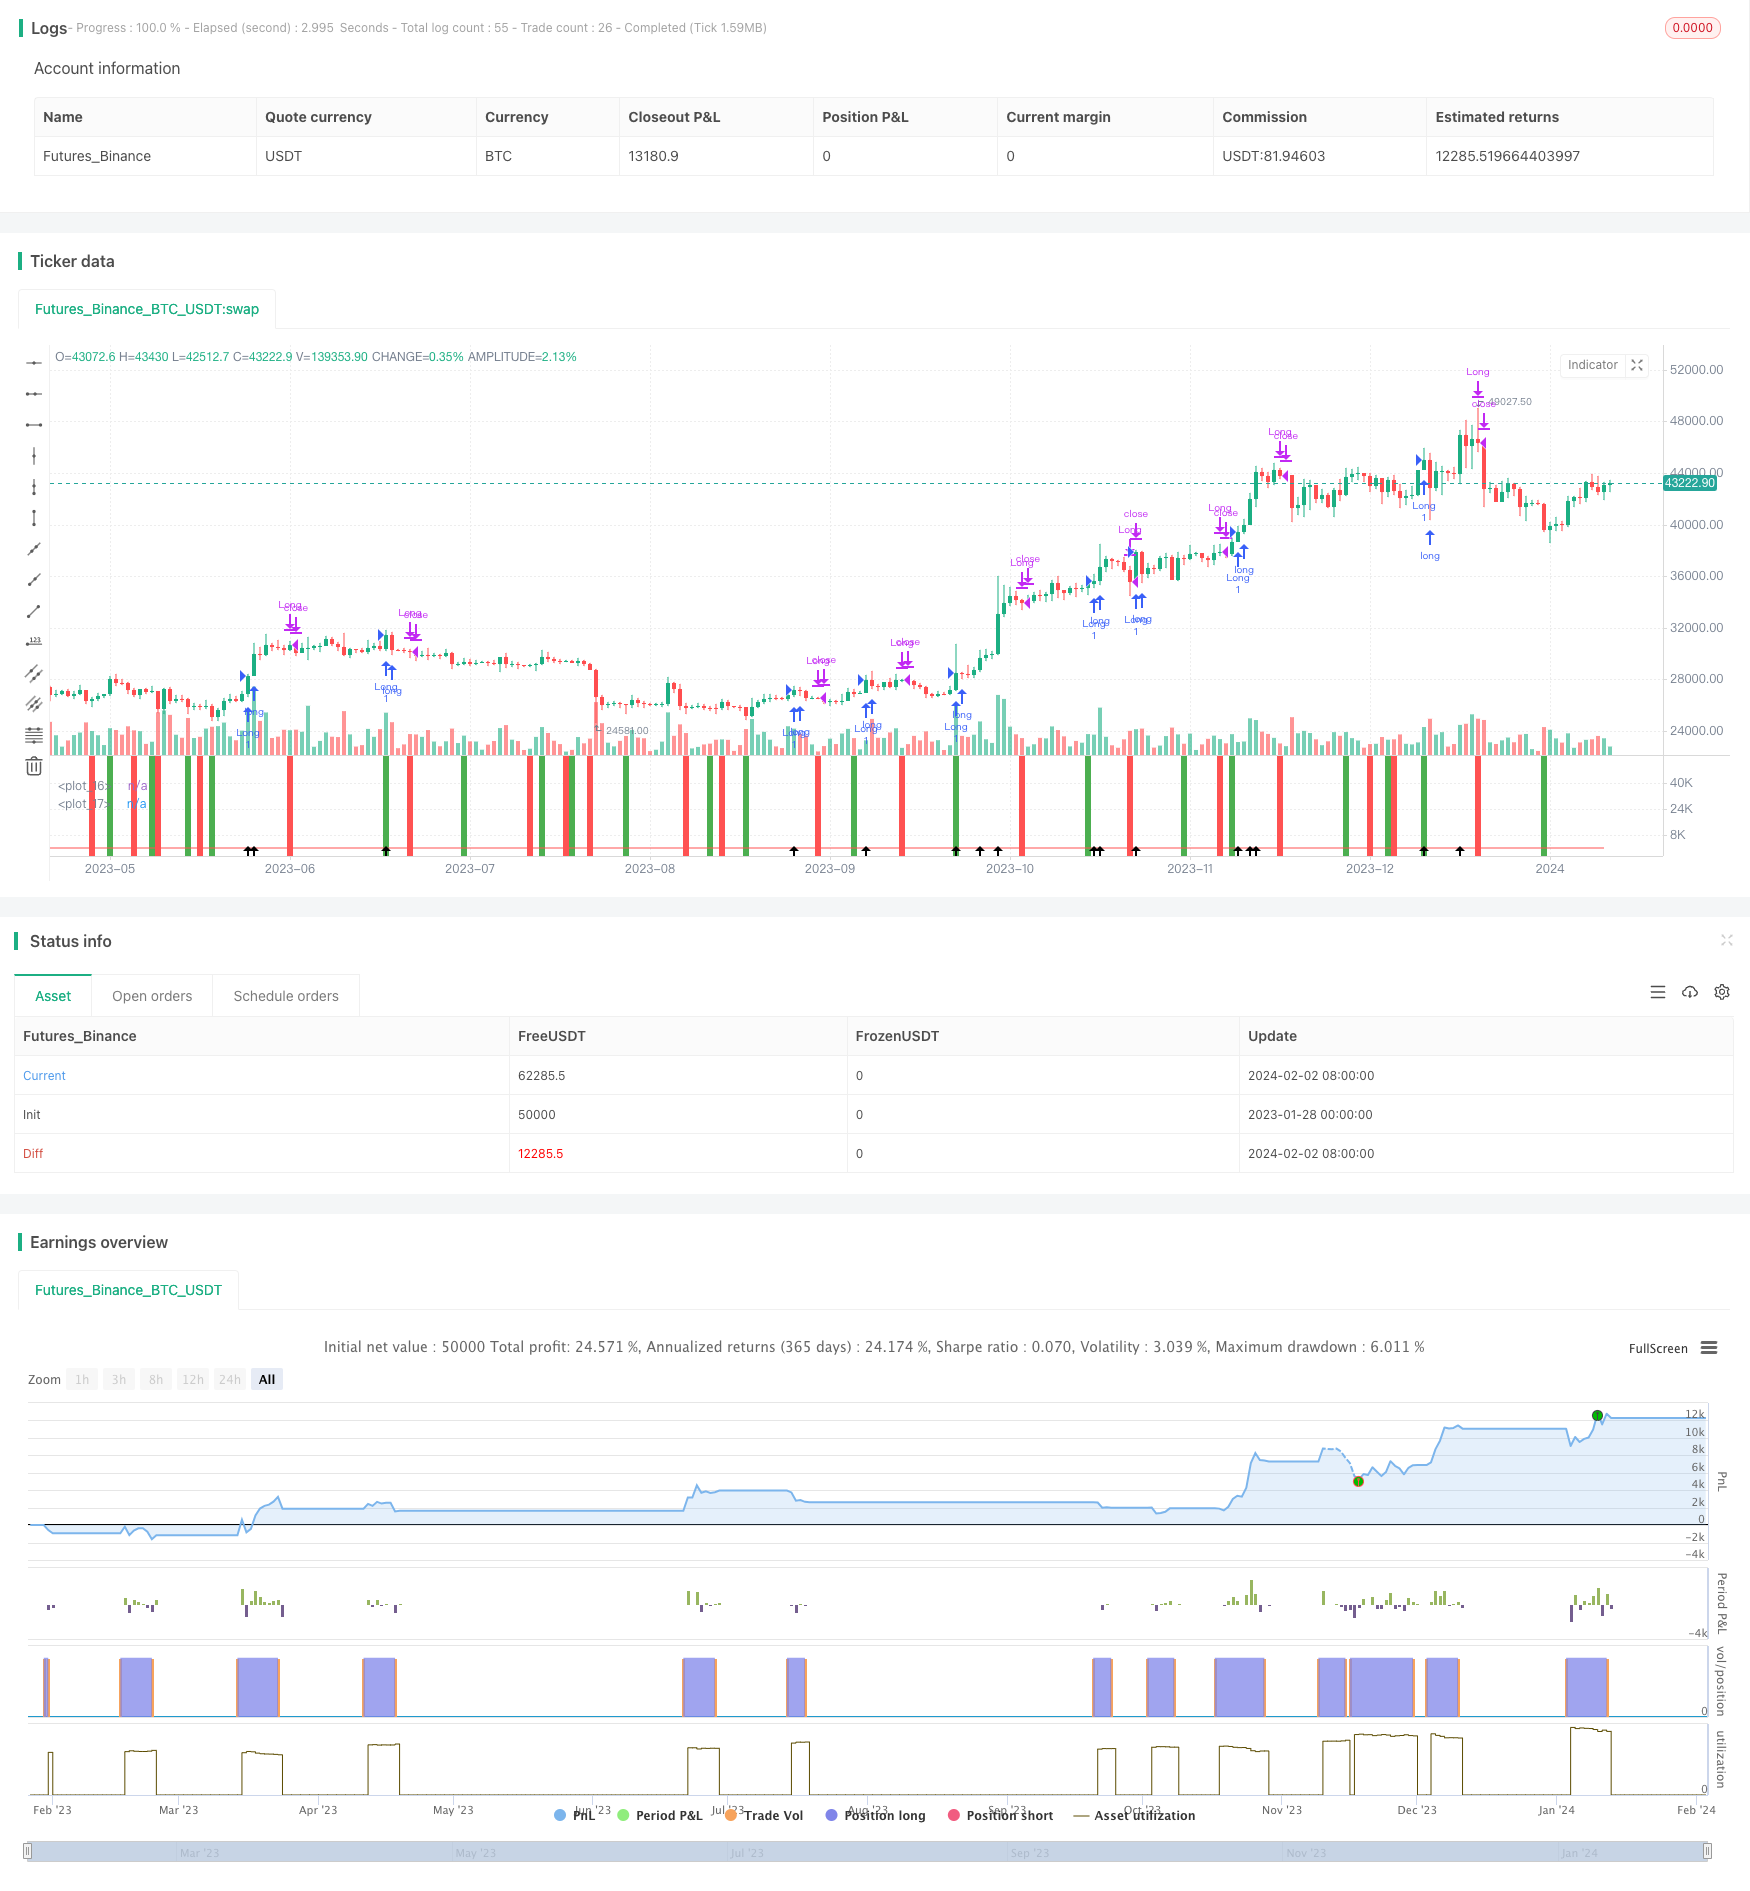
该策略融合了Renko图和相对活力指数(RVI)两个指标,目标是捕捉市场主要趋势的大部分行情。适用于比特币、恒指等主流品种。
策略使用9期ATR构建Renko砖,当收盘价格超过上一Renko砖高点时构建新砖,颜色为绿色;当收盘价格低于上一Renko砖低点时构建新砖,颜色为红色。结合RVI指标判定趋势方向。
RVI指标用于判断多头力量和空头力量的相对强度。RVI数值在0-1之间波动,高于0.5代表多头力量强于空头;低于0.5代表空头力量强于多头。当RVI上穿其平滑移动平均线时,代表空头力量减弱,多头力量增强,给出做多信号;当RVI下穿其平滑移动平均线时,代表多头力量减弱,空头力量增强,给出做空信号。
综合Renko砖方向和RVI指标的做多做空信号,进入相应的多头或空头仓位。
- Renko砖隔离正常的市场波动,只关注更大幅度的价格变动,避免被套。
- RVI指标判断趋势发生反转的时机,进一步锁定交易信号。
- 结合两种指标进行过滤,可有效抓住市场主要趋势,过滤掉部分噪音。
- Renko砖的大小直接影响交易频率,砖太大会错过机会,砖太小则会增加交易频率和手续费。
- RVI指标参数设置不当也会导致错过信号或增大假信号。
- 双重指标过滤会错过一定信号,无法抓住全部行情。
- 动态优化Renko砖大小,让其自适应市场波动率。
- 优化RVI指标参数,寻找最佳平衡点。
- 尝试不同品种和周期参数组合,评估稳定性。
该策略综合了两种不同类型指标的优点,目标是抓住市场主流趋势。通过对Renko和RVI参数的优化,可以获得更高的稳定性。但任何模型都无法完美,错过一定信号在所难免,关键是要把握主要方向。使用者需要清楚评估自身的风险偏好,选择适合自己的品种和参数。
||
This strategy combines the Renko charts and Relative Vigor Index (RVI) to capture most of the major market trends. It works well on major symbols like BTCUSD, HSI etc.
The strategy constructs Renko bricks based on 9 period ATR. A new green brick is constructed when close price exceeds the previous brick's high. A new red brick is constructed when close price falls below the previous brick's low. The trend direction is determined by RVI indicator.
RVI oscillates between 0-1 to measure the relative strength between buying and selling pressure. Above 0.5 represents stronger buying pressure while below 0.5 represents stronger selling pressure. RVI crossing above its smooth moving average gives buy signal as selling pressure eases. RVI crossing below gives sell signal as buying pressure eases.
Combine the Renko brick direction and RVI signals to enter long or short positions accordingly.
- Renko bricks filter out normal market noise and only react to significant price movement, avoiding whipsaws.
- RVI helps identifying trend reversal, further confirming trading signals.
- Combining two indicators filters out some noise and enables capturing major trends.
- Brick size directly affects trading frequency. Bricks too large may miss opportunity while too small increases costs.
- Improper RVI parameters may cause missing signals or more false signals.
- Double filtering misses some trading opportunity.
- Dynamic brick size to adapt changing volatility.
- Optimize RVI parameters to find best balance.
- Test stability across different symbols and timeframes.
This strategy combines two different types of indicators to capture major trends. Further optimization on Renko and RVI parameters can improve stability. No model is perfect and missing some trades is inevitable. Users need to assess their own risk preference and choose proper symbol/parameter combo.
[/trans]
Strategy Arguments
| Argument | Default | Description |
|---|---|---|
| v_input_1 | D | TimeFrame |
| v_input_2 | 9 | ATR length |
| v_input_3 | 5 | SMA length |
| v_input_4 | 20 | SMA CurTF length |
Source (PineScript)
/*backtest
start: 2023-01-28 00:00:00
end: 2024-02-03 00:00:00
period: 1d
basePeriod: 1h
exchanges: [{"eid":"Futures_Binance","currency":"BTC_USDT"}]
*/

//@version=3
strategy("Lancelot RR Strategy", overlay=false)
p=9
CO=close-open
HL=high-low
value1 = (CO + 2*CO[1] + 2*CO[2] + CO[3])/6
value2 = (HL + 2*HL[1] + 2*HL[2] + HL[3])/6
num=sum(value1,p)
denom=sum(value2,p)
RVI=denom!=0?num/denom:0
RVIsig=(RVI+ 2*RVI[1] + 2*RVI[2] + RVI[3])/6

rvicloselongcondition = crossunder(RVI, RVIsig)
rvicloseshortcondition = crossover(RVI, RVIsig)

plot(RVI,color=green,style=line,linewidth=1)
plot(RVIsig,color=red,style=line,linewidth=1)
bgcolor(rvicloseshortcondition ? green : na, transp = 75)
bgcolor(rvicloselongcondition ? red : na, transp = 75)

///Renko///
TF = input(title='TimeFrame', defval="D")
ATRlength = input(title="ATR length",  defval=9, minval=2, maxval=100)
SMAlength = input(title="SMA length",  defval=5, minval=2, maxval=100)
SMACurTFlength = input(title="SMA CurTF length",  defval=20, minval=2, maxval=100)

HIGH = request.security(syminfo.tickerid, TF, high)
LOW = request.security(syminfo.tickerid, TF, low)
CLOSE = request.security(syminfo.tickerid, TF, close)
ATR = request.security(syminfo.tickerid, TF, atr(ATRlength))
SMA = request.security(syminfo.tickerid, TF, sma(close, SMAlength))
SMACurTF = sma(close, SMACurTFlength)

RENKOUP = na
RENKODN = na
H = na
COLOR = na
BUY = na
SELL = na
UP = na
DN = na
CHANGE = na

RENKOUP := na(RENKOUP[1]) ? ((HIGH+LOW)/2)+(ATR/2) : RENKOUP[1]
RENKODN := na(RENKOUP[1]) ? ((HIGH+LOW)/2)-(ATR/2) : RENKODN[1]
H := na(RENKOUP[1]) or na(RENKODN[1]) ? RENKOUP-RENKODN : RENKOUP[1]-RENKODN[1]
COLOR := na(COLOR[1]) ? white : COLOR[1]
BUY := na(BUY[1]) ? 0 : BUY[1]
SELL := na(SELL[1]) ? 0 : SELL[1]
UP := false
DN := false
CHANGE := false

if(not CHANGE and close >= RENKOUP[1]+H*3)
    CHANGE := true
    UP := true
    RENKOUP := RENKOUP[1]+ATR*3
    RENKODN := RENKOUP[1]+ATR*2
    COLOR := lime
    SELL := 0
    BUY := BUY+3

if(not CHANGE and close >= RENKOUP[1]+H*2)
    CHANGE := true
    UP := true
    RENKOUP := RENKOUP[1]+ATR*2
    RENKODN := RENKOUP[1]+ATR
    COLOR := lime
    SELL := 0
    BUY := BUY+2

if(not CHANGE and close >= RENKOUP[1]+H)
    CHANGE := true
    UP := true
    RENKOUP := RENKOUP[1]+ATR
    RENKODN := RENKOUP[1]
    COLOR := lime
    SELL := 0
    BUY := BUY+1

if(not CHANGE and close <= RENKODN[1]-H*3)
    CHANGE := true
    DN := true
    RENKODN := RENKODN[1]-ATR*3
    RENKOUP := RENKODN[1]-ATR*2
    COLOR := red
    BUY := 0
    SELL := SELL+3

if(not CHANGE and close <= RENKODN[1]-H*2)
    CHANGE := true
    DN := true
    RENKODN := RENKODN[1]-ATR*2
    RENKOUP := RENKODN[1]-ATR
    COLOR := red
    BUY := 0
    SELL := SELL+2

if(not CHANGE and close <= RENKODN[1]-H)
    CHANGE := true
    DN := true
    RENKODN := RENKODN[1]-ATR
    RENKOUP := RENKODN[1]
    COLOR := red
    BUY := 0
    SELL := SELL+1

plotshape(UP, style=shape.arrowup, location=location.bottom, size=size.normal)

renkolongcondition = UP
renkoshortcondition = DN

///Long Entry///
longcondition = UP
if (longcondition)
    strategy.entry("Long", strategy.long)

///Long exit///
closeconditionlong = rvicloselongcondition
if (closeconditionlong)
    strategy.close("Long")
Detail
https://www.fmz.com/strategy/440997
Last Modified
2024-02-04 15:49:19
