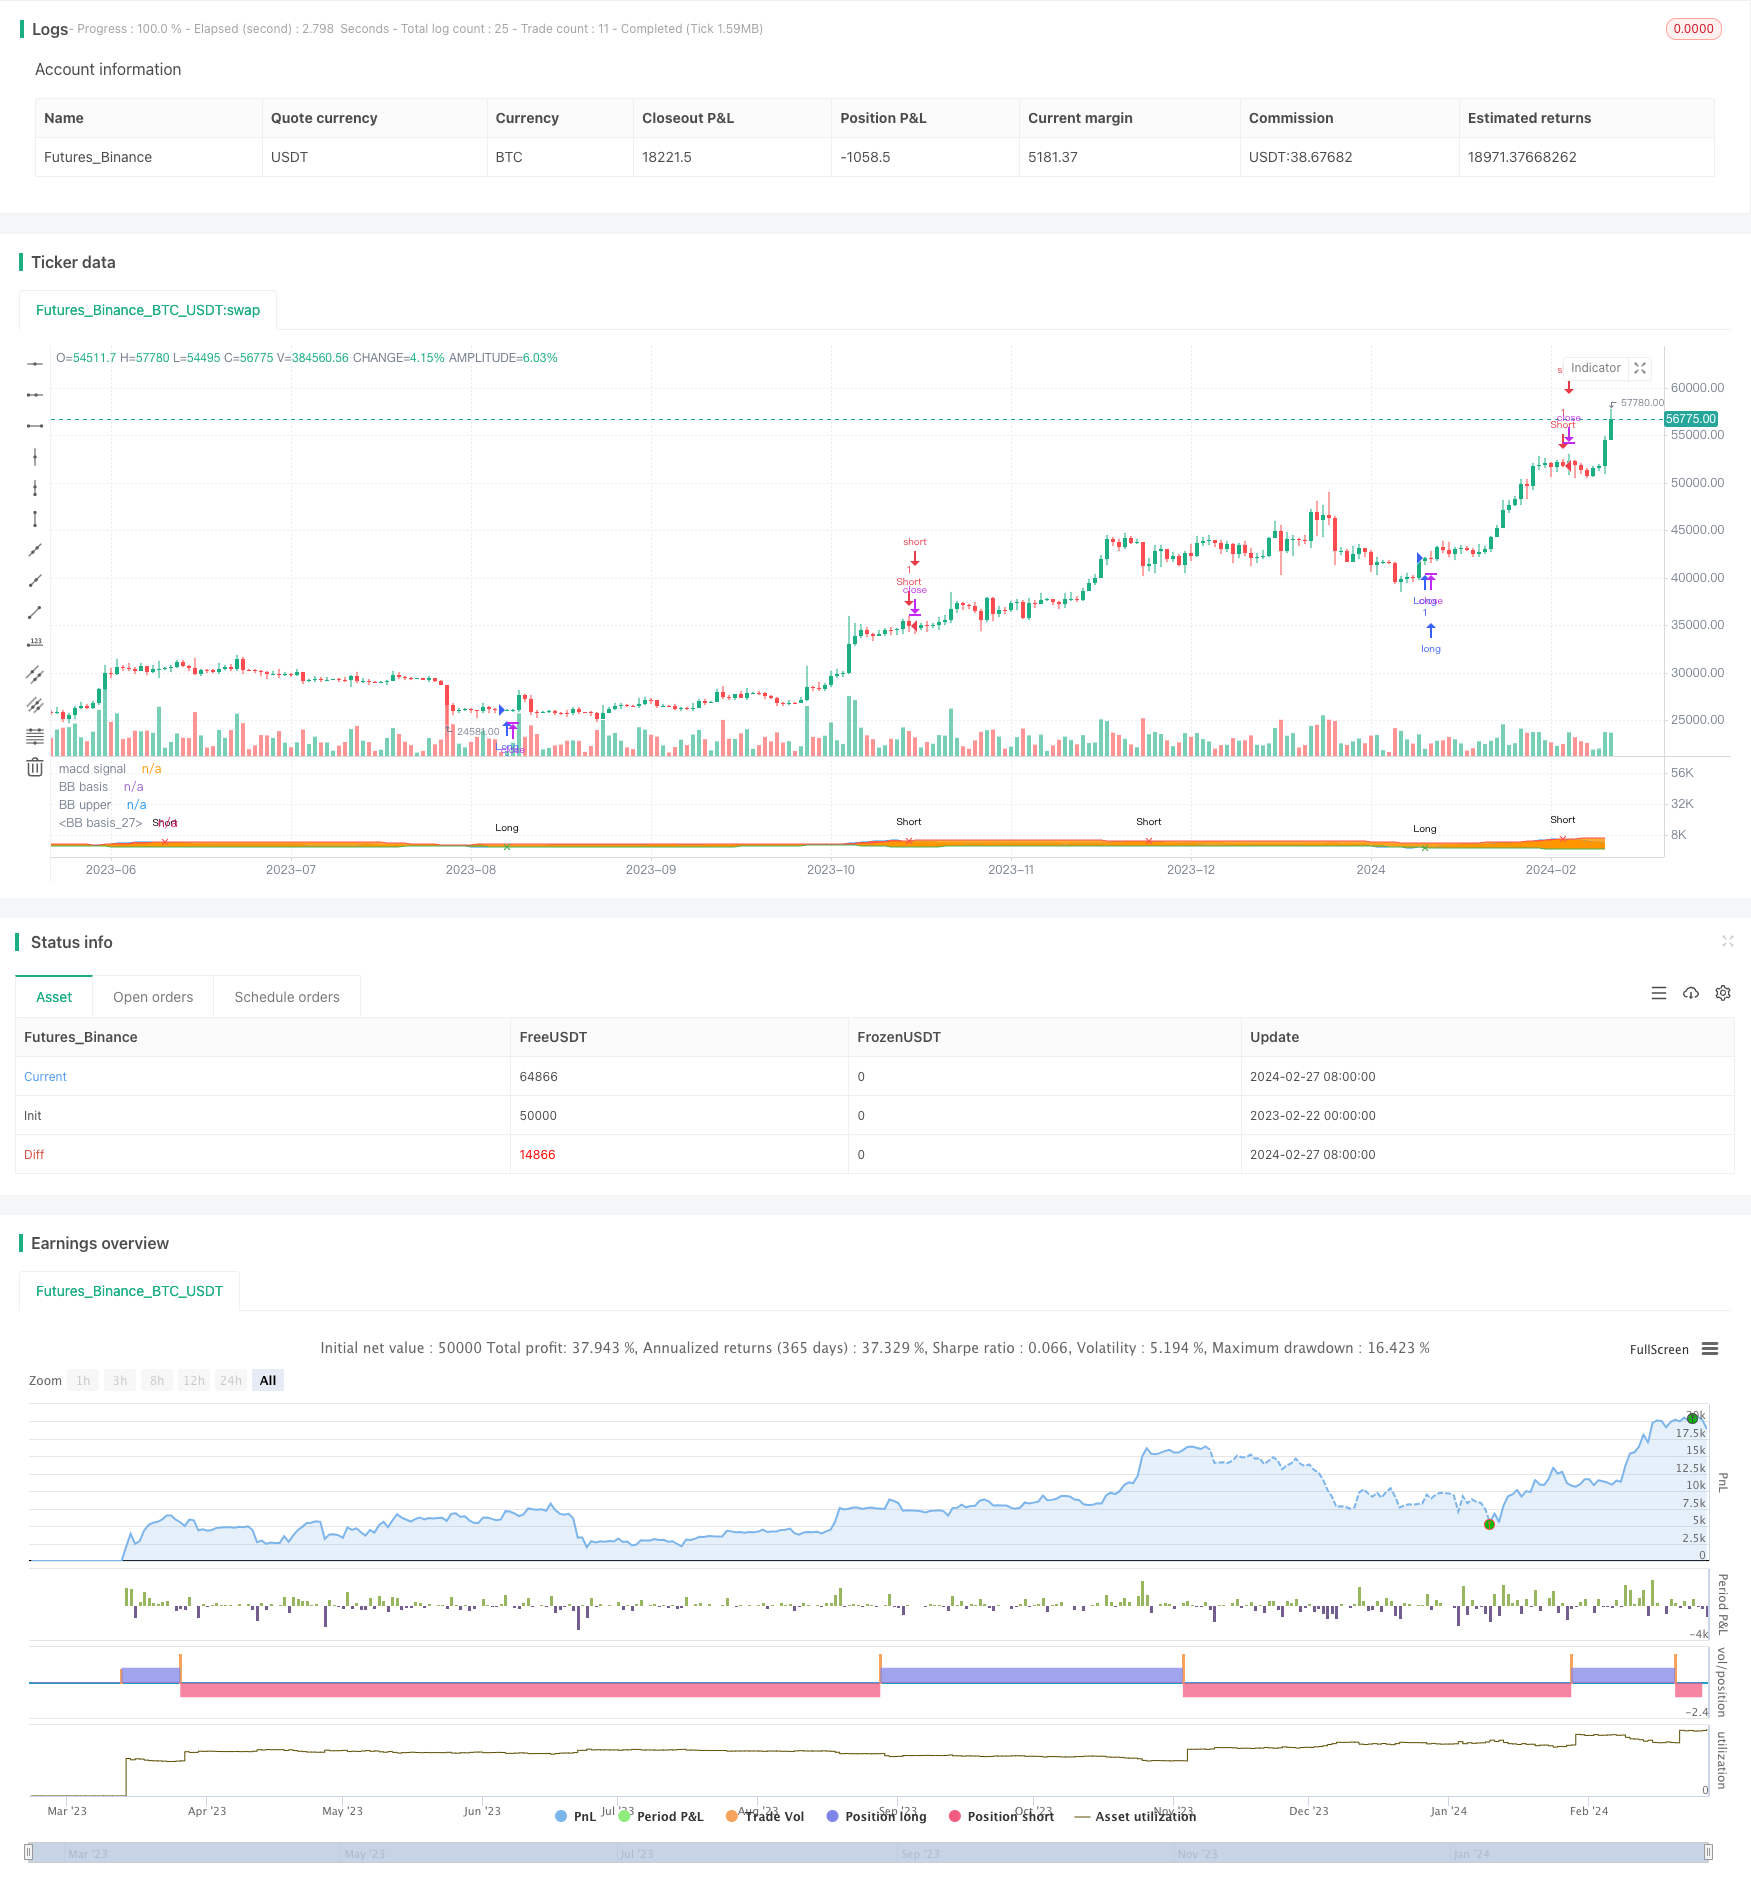
Name
基于MACD和布林带的Momentum-Trend策略Momentum-Trend-Strategy-Based-on-MACD-and-Bollinger-Bands
Author
ChaoZhang
Strategy Description
本策略名称为“Momentum Trend”,它结合了MACD指标和布林带指标的优势,实现了一个趋势跟踪策略。该策略使用MACD的快线和慢线构建布林带,布林带的中线为MACD的信号线。当价格突破布林带上轨时看空,当价格突破布林带下轨时看多。它等待价格回调测试布林带中线附近再入场,以追踪中长线趋势。
该策略的核心指标为MACD和布林带。其中,MACD指标由快线、慢线和MACD差值组成。快线一般取12日EMA,慢线取26日EMA。它们的差值就是MACD柱子。该策略则利用快线和慢线的差值作为布林带的基础中线,中线周围设定上下轨,并绘制布林带。
当价格从下向上突破布林带下轨时产生买入信号;当价格从上向下突破布林带上轨时产生卖出信号。为了减少被套和错失反转机会的可能性,本策略并不在轨道突破时立即入场,而是等待价格回调测试布林带中线时再入场。
此外,布林带上轨和下轨也可作为阻力位和支撑位来利用。当价格上涨时上轨是阻力,下轨是支撑;当价格下跌时上轨是支撑,下轨是阻力。
该策略结合MACD和布林带两个指标的优势实现了趋势追踪,具有如下优势:
-
MACD具有较强的趋势判断能力,布林带带有自适应性调整,两者组合可以有效判断趋势转折点。
-
回调入场可以有效规避止损风险,追踪中长线趋势。
-
利用布林带上的阻力和支撑可以进一步锁定获利。
-
MACD和布林带参数可以灵活调整,适用于多种市场环境。
该策略也存在一些风险需要注意:
-
在震荡趋势中,MACD和布林带可能出现多次失效信号。这时需要降低仓位规模避免巨额亏损。
-
回调入场时需要设定止损,避免回调过深导致亏损扩大。
-
布林带参数需要根据市场波动率调整,如果参数设置不当则会增加假突破概率。
-
良好的风险管理和仓位控制是该策略取得持续盈利的关键。单纯依赖策略信号容易忽视总体风险。
该策略还可从以下几个方向进行优化:
-
优化MACD的参数,改为8日快线,20日慢线,根据不同品种和周期调整,提高指标灵敏度。
-
增加向上向下趋势判断,优化布林带参数,降低震荡市假信号率。
-
增加止损策略,利用布林带上下轨位设置止损线,控制风险。
-
结合其他指标框架进行验证,提高策略稳定性。
基于MACD和布林带的Momentum Trend策略,通过指标组合追踪中长线趋势,回调入场降低风险。它优化了参数设置,控制了风险,在趋势品种中表现较佳。但任何策略都无法完美,需要我们从多个角度不断优化和改进,使之适应多变的市场环境。
||
The strategy is named "Momentum Trend". It combines the advantages of MACD indicator and Bollinger Bands to implement a trend tracking strategy. The strategy uses MACD fast line and slow line to build Bollinger Bands. The middle line of Bollinger Bands is the MACD signal line. It goes short when price breaks through the upper rail of Bollinger Bands and goes long when price breaks through the lower rail of Bollinger Bands. It waits for the pullback to test the middle line of Bollinger Bands before entering the market to track medium-long term trends.
The core indicators of this strategy are MACD and Bollinger Bands. MACD indicator consists of fast line, slow line and MACD histogram. The fast line is usually 12-day EMA and slow line is 26-day EMA. The difference between them is the MACD histogram. This strategy uses the difference between fast line and slow line as the base middle line of Bollinger Bands. Upper and lower rails are set around the middle line to construct Bollinger Bands.
A buy signal is generated when the price breaks through the lower rail of Bollinger Bands upwards. A sell signal is generated when the price breaks through the upper rail of Bollinger Bands downwards. To reduce the risk of being trapped and missing reversal opportunities, this strategy does not enter the market immediately after the breakout. Instead, it waits for the pullback to test the middle line of Bollinger Bands before entering.
In addition, the upper and lower rails can also be used as resistance and support respectively. When price goes up, the upper rail is resistance and the lower rail is support. When price goes down, the upper rail becomes support and lower rail becomes resistance.
This strategy combines the advantages of MACD and Bollinger Bands to achieve trend tracking, with the following strengths:
-
MACD has strong trend judgment capability. Bollinger Bands can adaptively adjust itself. The combination can effectively determine trend reversal points.
-
Pullback entry can effectively avoid stop loss risk and track medium-long term trends.
-
Utilizing resistance and support on Bollinger Bands can further lock in profits.
-
MACD and Bollinger Bands parameters can be flexibly adjusted to suit different market environments.
There are also some risks to note for this strategy:
-
In oscillating trends, MACD and Bollinger Bands may generate multiple invalid signals. Position size needs to be reduced then to avoid huge losses.
-
Stop loss should be set during pullback entry to avoid loss enlargement from overdeep pullback.
-
Bollinger Bands parameters need to be adjusted based on market volatility. Improper parameter setting increases false breakout probability.
-
Good risk management and position sizing are the key to sustain profits for this strategy. Purely relying on strategy signals tends to neglect overall risks.
The strategy can also be optimized in the following aspects:
-
Optimize MACD parameters to 8-day fast line and 20-day slow line. Adjust based on different products and timeframes to improve indicator sensitivity.
-
Add upwards and downwards trend judgment to optimize Bollinger Bands parameters, reducing false signals in oscillating markets.
-
Add stop loss strategy. Set stop loss line with Bollinger Bands upper and lower rails to control risks.
-
Incorporate other indicators for verification to improve strategy stability.
The Momentum Trend strategy based on MACD and Bollinger Bands tracks medium-long term trends through indicator combo and enters on pullbacks to reduce risks. It optimizes parameter settings and controls risks. It performs well on trending products. But no strategy is perfect. We need to keep optimizing and improving from multiple perspectives for adapting to the ever-changing market environments.
[/trans]
Strategy Arguments
| Argument | Default | Description |
|---|---|---|
| v_input_1 | 8 | Fast MA period |
| v_input_2 | 21 | Slow MA period |
| v_input_3_close | 0 | Source: close |
| v_input_4 | true | Moving Average Calculation: (1 = SMA), (2 = EMA), (3 = WMA), (4 = Linear) |
| v_input_5 | 40 | length |
| v_input_6 | 2 | BB multiplier |
Source (PineScript)
/*backtest
start: 2023-02-22 00:00:00
end: 2024-02-28 00:00:00
period: 1d
basePeriod: 1h
exchanges: [{"eid":"Futures_Binance","currency":"BTC_USDT"}]
*/

//@version=4
//Simple strategy based on MACD and Bollinger Bands, where BBs are calculatend from macd signal.
strategy("Strategy MACD vs BB", overlay=false)

fast_length = input(title="Fast MA period", type=input.integer, defval=8)
slow_length = input(title="Slow MA period", type=input.integer, defval=21)
src = input(close,"Source")


// ----------MA calculation - ChartArt-------------
smoothinput = input(1, minval=1, maxval=4, title='Moving Average Calculation: (1 = SMA), (2 = EMA), (3 = WMA), (4 = Linear)')

fast_ma = smoothinput == 1 ? sma(src, fast_length):smoothinput == 2 ? ema(src, fast_length):smoothinput == 3 ? wma(src, fast_length):smoothinput == 4 ? linreg(src, fast_length,0):na
slow_ma = smoothinput == 1 ? sma(src, slow_length):smoothinput == 2 ? ema(src, slow_length):smoothinput == 3 ? wma(src, slow_length):smoothinput == 4 ? linreg(src, slow_length,0):na
//----------------------------------------------
macd = fast_ma - slow_ma
p1=plot(macd,"macd signal",color=color.blue)
length = input(40, minval=1)
mult = input(2.0,"BB multiplier")

basis = sma(macd, length)
dev = mult * stdev(macd, length)
plot(basis,"BB basis",color=color.orange)
upper = basis + dev
lower = basis - dev
p2=plot(upper,"BB upper",color=color.red)
p3=plot(lower,"BB basis",color=color.green)

longCondition = crossover(macd, lower)
shortCondition = crossunder(macd, upper)

plotshape(longCondition?lower:na, title="Long", style=shape.xcross, location=location.absolute, text="Long", color=color.green, transp=0, size=size.tiny)
plotshape(shortCondition?upper:na, title="Short", style=shape.xcross, location=location.absolute, text="Short", color=color.red, transp=0, size=size.tiny)
fill(p1,p3,color=macd<lower?color.green:na,transp=90,title="support")
fill(p1,p2,color=macd>upper?color.red:na,transp=90,title="resistance")

if longCondition
    strategy.entry("Long",strategy.long)
if shortCondition
    strategy.entry("Short",strategy.short)
Detail
https://www.fmz.com/strategy/443118
Last Modified
2024-02-29 13:49:03
