Name
基于K线收盘价的买卖策略Buy-Sell-on-Candle-Close-Strategy
Author
ChaoZhang
Strategy Description
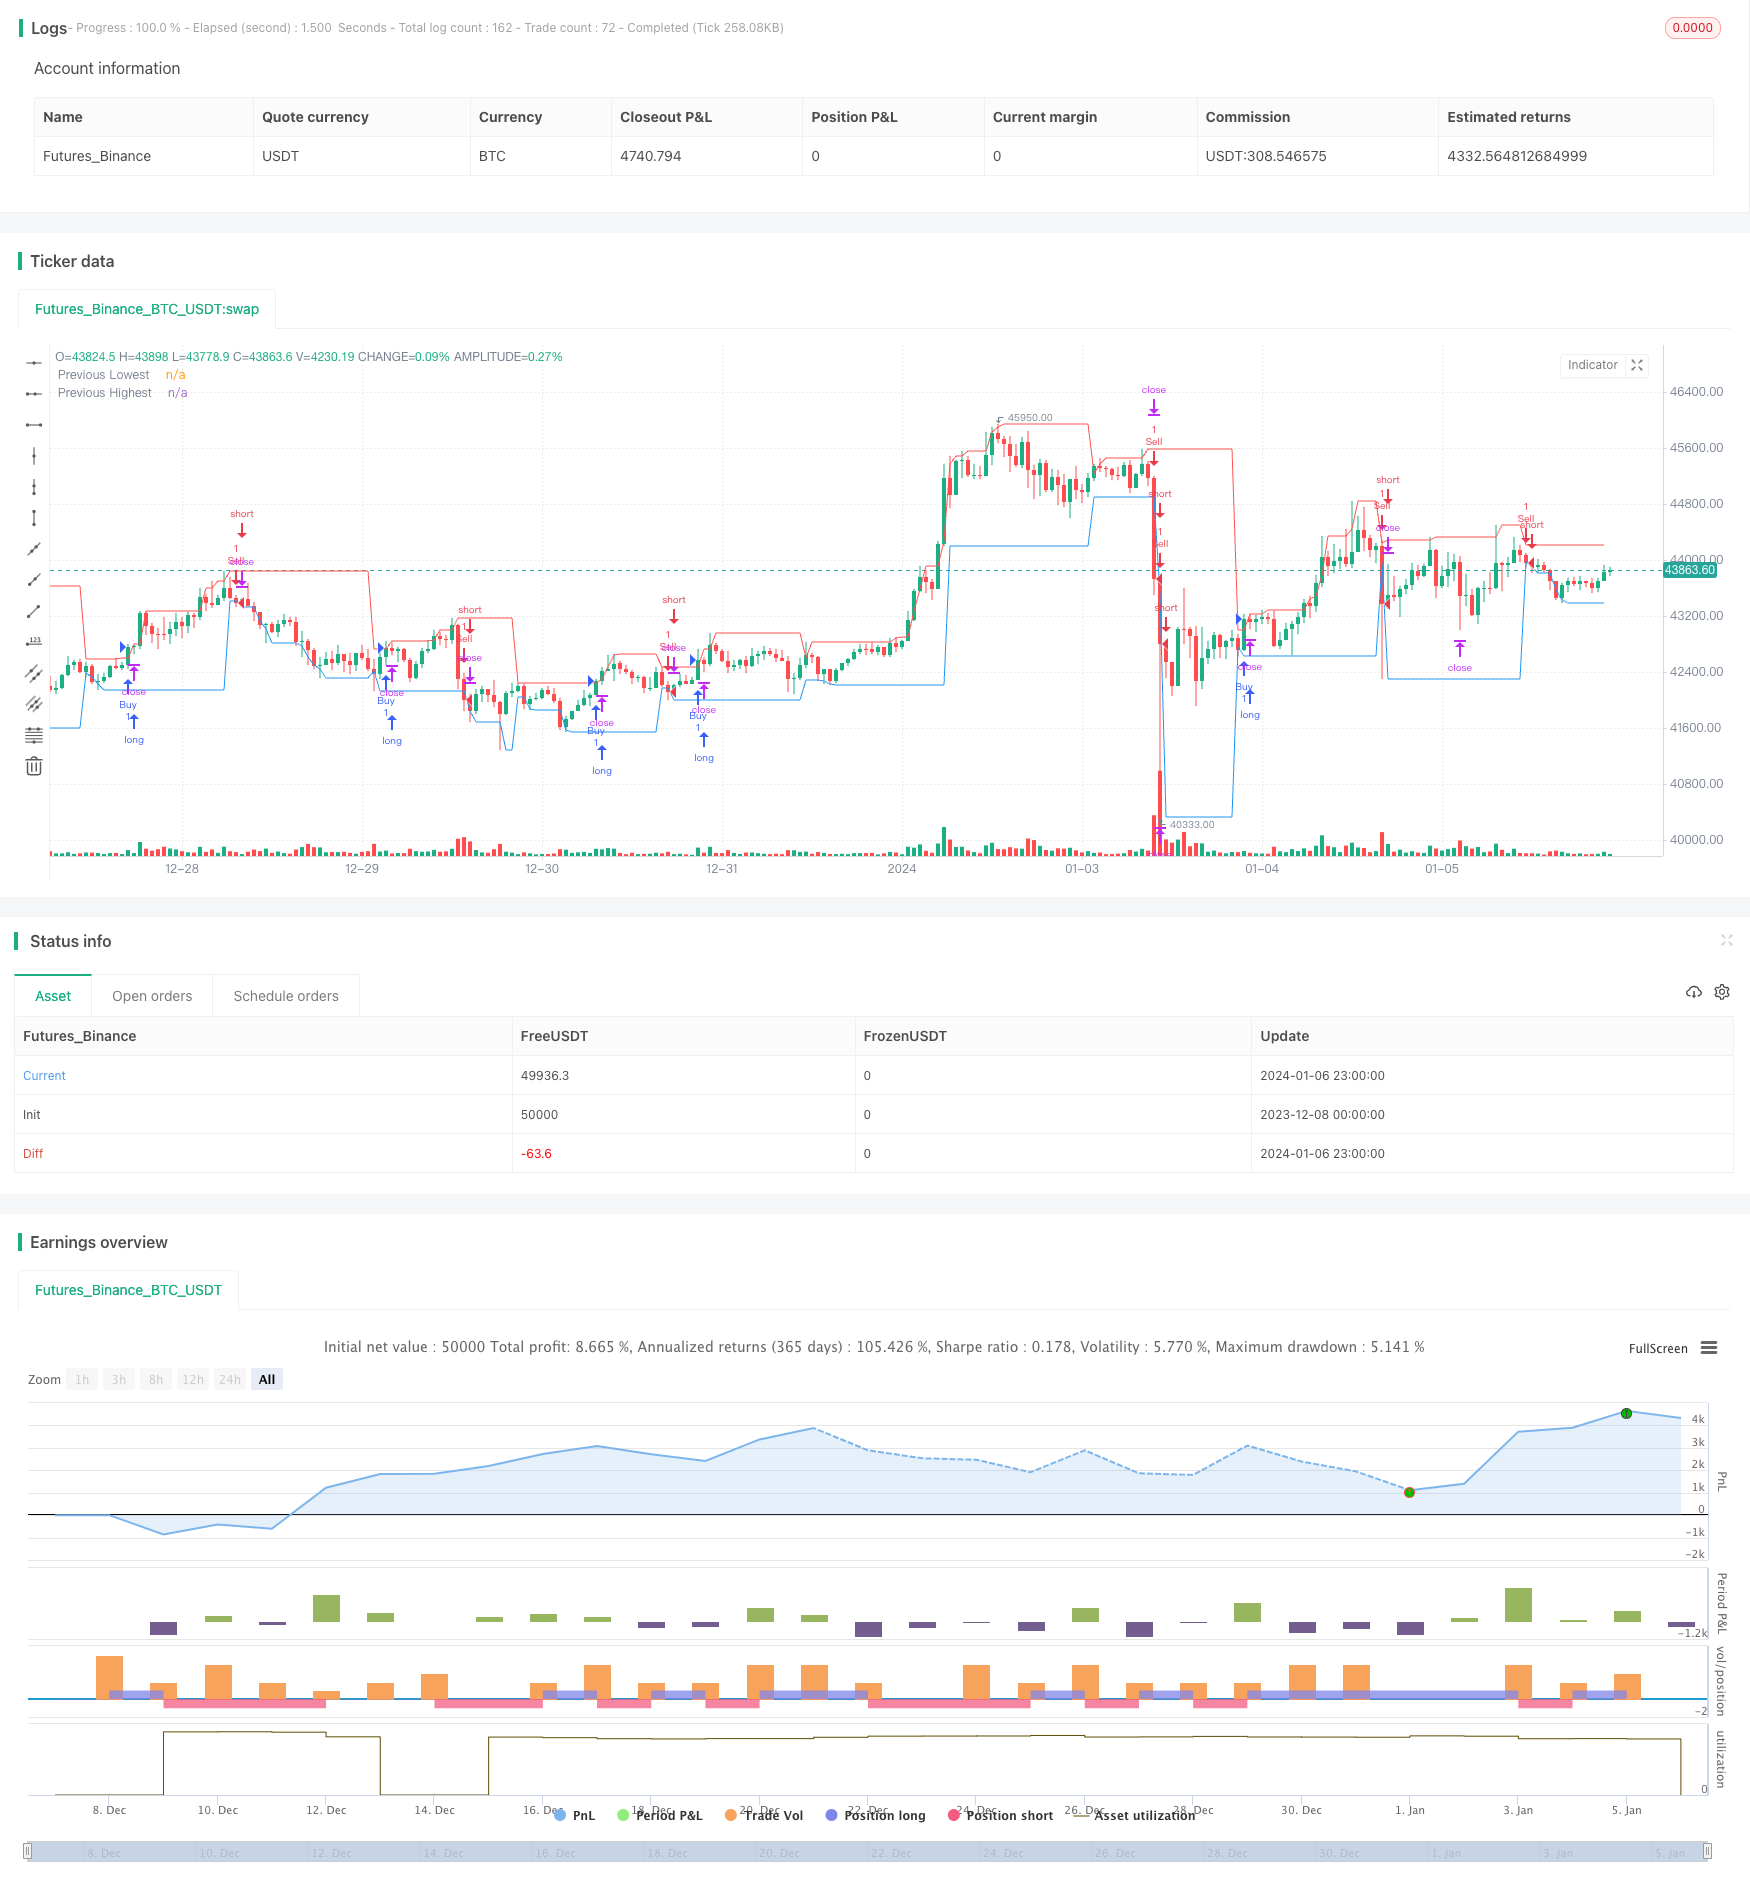
该策略通过比较当前K线和上一根K线的收盘价,来判断是否触发买入或卖出信号。
具体来说,如果当前K线收盘价高于上一根K线的最高价,则触发买入信号;如果当前K线收闭价低于上一根K线的最低价,则触发卖出信号。
- 获取指定时间周期(如日线、小时线等)的历史最高价和最低价
- 计算止损距离和止盈距离
- 止损距离 = 上一根K线最高价 - 上一根K线最低价
- 止盈距离 = 止损距离 * 3(设置为1:3的止损止盈比例)
- 判断当前K线收盘价与上一根K线最高价和最低价的关系
- 如果当前收盘价 > 上一根K线最高价,则触发买入信号
- 如果当前收盘价 < 上一根K线最低价,则触发卖出信号
- 入场后设置止损和止盈
- 买入后,设置止损为上一根K线最低价 - 止损距离,止盈为上一根K线最高价 + 止盈距离
- 卖出后,设置止损为上一根K线最高价 + 止损距离,止盈为上一根K线最低价 - 止盈距离
以上就是该策略的基本交易逻辑。
- 策略思路清晰简单,容易理解实现
- 利用K线信息判断趋势方向
- 有止损止盈机制控制风险
- 仅基于一个时间周期K线形态判断,可能产生更多假信号
- 没有考虑更多因素,如交易量变化、波动率等
- 止损止盈设定可能不当,距离过大过小都有风险
- 结合更多因素确认入场信号,如交易量、均线等
- 优化止损止盈算法,使止损更合理、止盈更充分
- 不同品种参数设置可能需要调整
- 可以测试更长线周期的效果
该策略整体思路简单清晰,利用K线收盘价信息判断趋势方向,同时设置止损止盈控制风险,可以作为股票、数字货币交易的基础策略。但仅仅基于单个时间周期K线形态,容易产生假信号,优化空间还很大,需要进一步考虑结合更多因素以及参数调整,从而改进策略效果。
||
This strategy triggers buy/sell signals by comparing the closing prices of the current candle and previous candle.
Specifically, if the current candle closes above the highest price of the previous candle, a buy signal is triggered. If the current candle closes below the lowest price of the previous candle, a sell signal is triggered.
- Get historical highest and lowest prices of the specified timeframe (e.g. daily, hourly)
- Calculate stop loss and take profit distances
- Stop loss distance = Previous candle highest - Previous candle lowest
- Take profit distance = Stop loss distance * 3 (1:3 risk-reward ratio)
- Determine the relationship between current close and previous high/low
- If current close > previous candle highest, trigger buy signal
- If current close < previous candle lowest, trigger sell signal
- Set stop loss and take profit after entry
- After buying, set stop loss at previous candle lowest - stop loss distance, take profit at previous candle highest + take profit distance
- After selling, set stop loss at previous candle highest + stop loss distance, take profit at previous candle lowest - take profit distance
The above is the basic trading logic of this strategy.
- Simple and clear strategy idea, easy to understand and implement
- Use candlestick information to determine trend direction
- Have stop loss and take profit mechanism to control risk
- Judgment based solely on one timeframe may generate more false signals
- Does not consider more factors like volume change, volatility etc.
- Stop loss and take profit settings could be inappropriate, too wide or too tight are both risky
- Combine more factors to confirm entry signal, like volume, moving average etc.
- Optimize stop loss and take profit algorithms to have more reasonable stop loss and sufficient take profit
- Parameter tuning may be needed for different products
- Longer timeframe can be tested
The strategy idea is simple and clear overall, using candlestick closing price to determine trend direction and also has stop loss/take profit to control risk, it can serve as a basic strategy for stocks and crypto trading. But with judgment solely based on one timeframe, it tends to generate false signals more easily. There is still much room for improvement by incorporating more factors and tuning parameters to enhance strategy performance.
[/trans]
Source (PineScript)
/*backtest
start: 2023-12-08 00:00:00
end: 2024-01-07 00:00:00
period: 1h
basePeriod: 15m
exchanges: [{"eid":"Futures_Binance","currency":"BTC_USDT"}]
*/

//@version=5
strategy("Buy/Sell on Candle Close", overlay=true)

var float prevLowest = na
var float prevHighest = na
var float slDistance = na
var float tpDistance = na

// Specify the desired timeframe here (e.g., "D" for daily, "H" for hourly, etc.)
timeframe = "D"

// Fetching historical data for the specified timeframe
pastLow = request.security(syminfo.tickerid, timeframe, low, lookahead=barmerge.lookahead_on)
pastHigh = request.security(syminfo.tickerid, timeframe, high, lookahead=barmerge.lookahead_on)

if bar_index > 0
    prevLowest := pastLow[1]
    prevHighest := pastHigh[1]

currentClose = close

if not na(prevLowest) and not na(prevHighest)
    slDistance := prevHighest - prevLowest
    tpDistance := 3 * slDistance // Adjusted for 1:3 risk-reward ratio

// Buy trigger when current close is higher than previous highest
if not na(prevLowest) and not na(prevHighest) and currentClose > prevHighest
    strategy.entry("Buy", strategy.long)
    strategy.exit("Buy TP/SL", "Buy", stop=prevLowest - slDistance, limit=prevHighest + tpDistance)

// Sell trigger when current close is lower than previous lowest
if not na(prevLowest) and not na(prevHighest) and currentClose < prevLowest
    strategy.entry("Sell", strategy.short)
    strategy.exit("Sell TP/SL", "Sell", stop=prevHighest + slDistance, limit=prevLowest - tpDistance)

plot(prevLowest, color=color.blue, title="Previous Lowest")
plot(prevHighest, color=color.red, title="Previous Highest")
Detail
https://www.fmz.com/strategy/438017
Last Modified
2024-01-08 11:11:18
