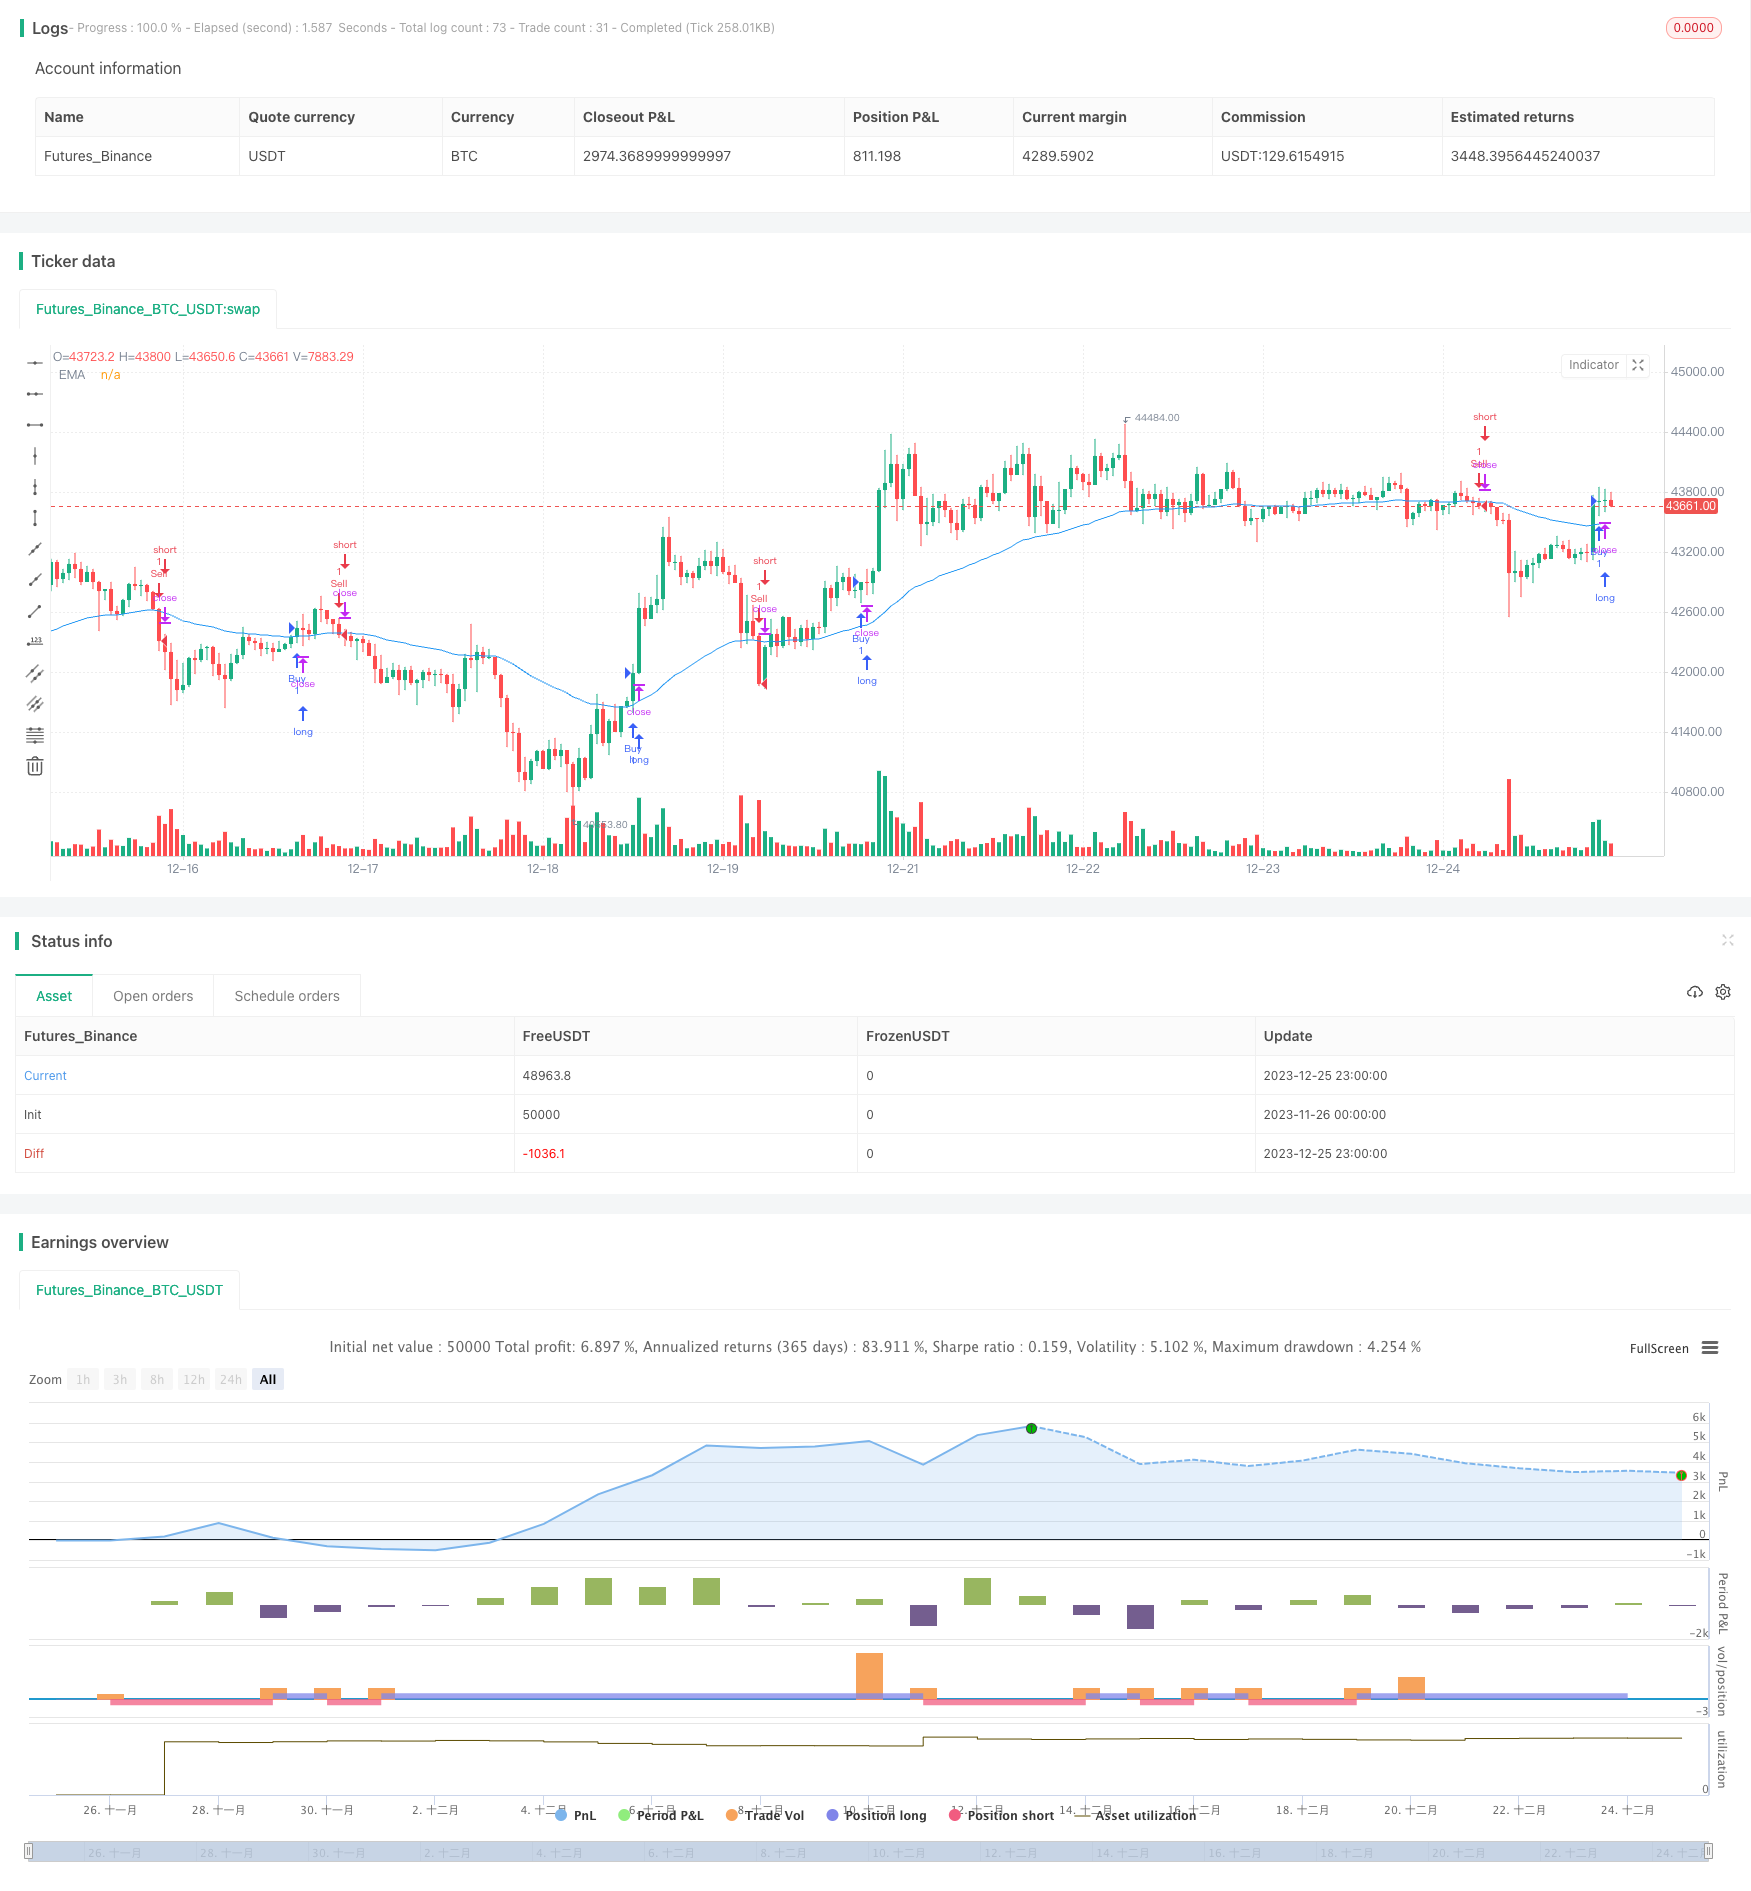
Name
基于K线收盘价多空比较与EMA过滤的量化交易策略Up-versus-Down-Close-Candles-Strategy-with-EMA-filter-and-Session-Timeframes
Author
ChaoZhang
Strategy Description
本策略名称为“基于K线收盘价多空比较与EMA过滤的量化交易策略”。该策略通过统计最近一定周期内K线的收盘价构成的多头K线和空头K线的数量,结合EMA的过滤,在符合交易时间段的情况下判断做多做空信号。
该策略的核心逻辑是统计最近lookback周期内出现上涨收盘的K线数量upCloseCount和下跌收盘的K线数量downCloseCount,如果上涨收盘的数量更多则判断为多头市场,如果下跌收盘的数量更多则判断为空头市场。同时结合EMA指标判断价格趋势和作为过滤器,只有当价格高于EMA时才考虑做多,价格低于EMA时才考虑做空。此外,策略还设置了交易时间段session1和session2,只在这两个时间段内交易。
具体判断逻辑是:
多头信号触发条件:inSession为true(在交易时间段内)且upCloseCount > downCloseCount(上涨收盘K线数量较多)且close > ema(收盘价高于EMA)且currentSignal不为"long"(当前无持仓)
空头信号触发条件:inSession为true且downCloseCount > upCloseCount(下跌收盘K线数量较多)且close < ema(收盘价低于EMA)且currentSignal不为"short"(当前无持仓)
- 通过统计一定历史周期内K线收盘价的多空比较判断价格趋势和市场心理,具有一定的趋势跟随效果
- 结合EMA指标对价格趋势进行过滤,避免在震荡行情中错误交易
- 设置特定的交易时间段,避免在非主要交易时间段的杂音行情中交易
- 兼顾趋势和频繁交易之间的平衡
- 在横盘整理的行情中,收盘价的多空比较容易受到误导,导致不必要的亏损
- EMA参数设置不当也会导致滤波效果不佳
- 交易时间段设置不当,会失去大量交易机会或者误交易
- 突发事件引起的Gap行情无法有效跟踪
对策:
- 优化EMA参数,寻找最佳平衡
- 优化交易时间段
- 结合止损策略控制单笔亏损
- 对交易时间段进行优化,找到最佳交易时间段
- 对EMA周期和平滑度进行参数优化
- 增加基于ATR的止损机制
- 增加对突发事件的识别模块,避免Gap行情的风险
- 考虑与其他指标组合,寻找更好的过滤入场条件
- 测试不同品种表现差异,根据差异调整参数
本策略通过统计一定历史周期内K线收盘价构成的多头和空头K线数量,结合EMA指标的过滤效果,在设置的特定交易时间段识别趋势信号。具有一定的跟踪趋势效果。但也存在一定的误交易风险,需要通过参数优化、止损策略、信号过滤等方法进行改进,在回测中验证效果。
||
This strategy is named "Up versus Down Close Candles Strategy with EMA filter and Session Timeframes". It counts the number of up close and down close candles in a certain lookback period to determine the market sentiment, combined with EMA filter and trading in specific sessions, to identify long and short signals.
The core logic is to count the number of up close candles (upCloseCount) and down close candles (downCloseCount) in the recent lookback period. If upCloseCount is larger, it indicates a bullish market. If downCloseCount is larger, it indicates a bearish market. EMA indicator is used as a filter, only considering long when price > EMA, and short when price < EMA. It also sets session1 and session2 as trading sessions.
Detailed logic:
Long signal triggers when: inSession is true (in trading sessions) and upCloseCount > downCloseCount (more up close candles) and close > ema (close price higher than EMA) and currentSignal is not "long" (no existing position).
Short signal triggers when: inSession is true and downCloseCount > upCloseCount (more down close candles) and close < ema (close price lower than EMA) and currentSignal is not "short" (no existing position).
- Captures market sentiment and trend by comparing up close/down close candles history
- Use EMA filter to avoid trading in ranging markets
- Avoid noise in non-major trading hours by setting sessions
- Balance between trend following and trading frequency
- Can be misled in sideways markets
- Improper EMA parameter may cause ineffective filter
- Missing opportunities if session set inappropriately
- Unable to capture gap caused by events
Solutions:
- Optimize EMA parameter
- Optimize trading sessions
- Add stop loss based on ATR
- Identify events, avoid gaps
- Optimize trading sessions
- Optimize EMA parameters
- Add ATR based stop loss
- Identify events, avoid gaps
- Combining with other indicators for better filter
- Test and adjust across products
This strategy identifies trend signals by comparing up close and down close candles and using EMA filter, within preset trading sessions. It has some trend following effect but also risks of false signals. Improve by optimizing parameters, adding stop loss, enhancing filters etc. Evaluate thoroughly in backtest.
[/trans]
Strategy Arguments
| Argument | Default | Description |
|---|---|---|
| v_input_1 | 20 | Lookback Period |
| v_input_2 | 50 | EMA Period |
| v_input_3 | 0900-1200 | Time Frame 1 Session |
| v_input_4 | 1300-1600 | Time Frame 2 Session |
Source (PineScript)
/*backtest
start: 2023-11-26 00:00:00
end: 2023-12-26 00:00:00
period: 1h
basePeriod: 15m
exchanges: [{"eid":"Futures_Binance","currency":"BTC_USDT"}]
*/

//@version=5
strategy("Up vs Down Close Candles Strategy with EMA and Session Time Frames", shorttitle="UvD Strat EMA Session", overlay=true)

// User input to define the lookback period, EMA period, and session strings for time frames
int lookback = input(20, title="Lookback Period")
int emaPeriod = input(50, title="EMA Period")
string session1 = input("0900-1200", title="Time Frame 1 Session")
string session2 = input("1300-1600", title="Time Frame 2 Session")

// Calculate the EMA
float ema = ta.ema(close, emaPeriod)

// State variable to track the current signal
var string currentSignal = na

// Counting up-close and down-close candles within the lookback period
int upCloseCount = 0
int downCloseCount = 0

if barstate.isnew
    upCloseCount := 0
    downCloseCount := 0
    for i = 0 to lookback - 1
        if close[i] > close[i + 1]
            upCloseCount += 1
        else if close[i] < close[i + 1]
            downCloseCount += 1

// Define the long (buy) and short (sell) conditions with EMA filter and session time frame
bool inSession = time(timeframe.period, session1) or time(timeframe.period, session2)
bool longCondition = inSession and upCloseCount > downCloseCount and close > ema and currentSignal != "long"
bool shortCondition = inSession and downCloseCount > upCloseCount and close < ema and currentSignal != "short"

// Enter or exit the market based on conditions
if longCondition
    currentSignal := "long"
    strategy.entry("Buy", strategy.long)

if shortCondition
    currentSignal := "short"
    strategy.entry("Sell", strategy.short)

// Exit logic for long and short positions
if currentSignal == "long" and strategy.position_size <= 0
    strategy.close("Sell")

if currentSignal == "short" and strategy.position_size >= 0
    strategy.close("Buy")

plot(ema, color=color.blue, title="EMA")
Detail
https://www.fmz.com/strategy/436755
Last Modified
2023-12-27 14:38:28
