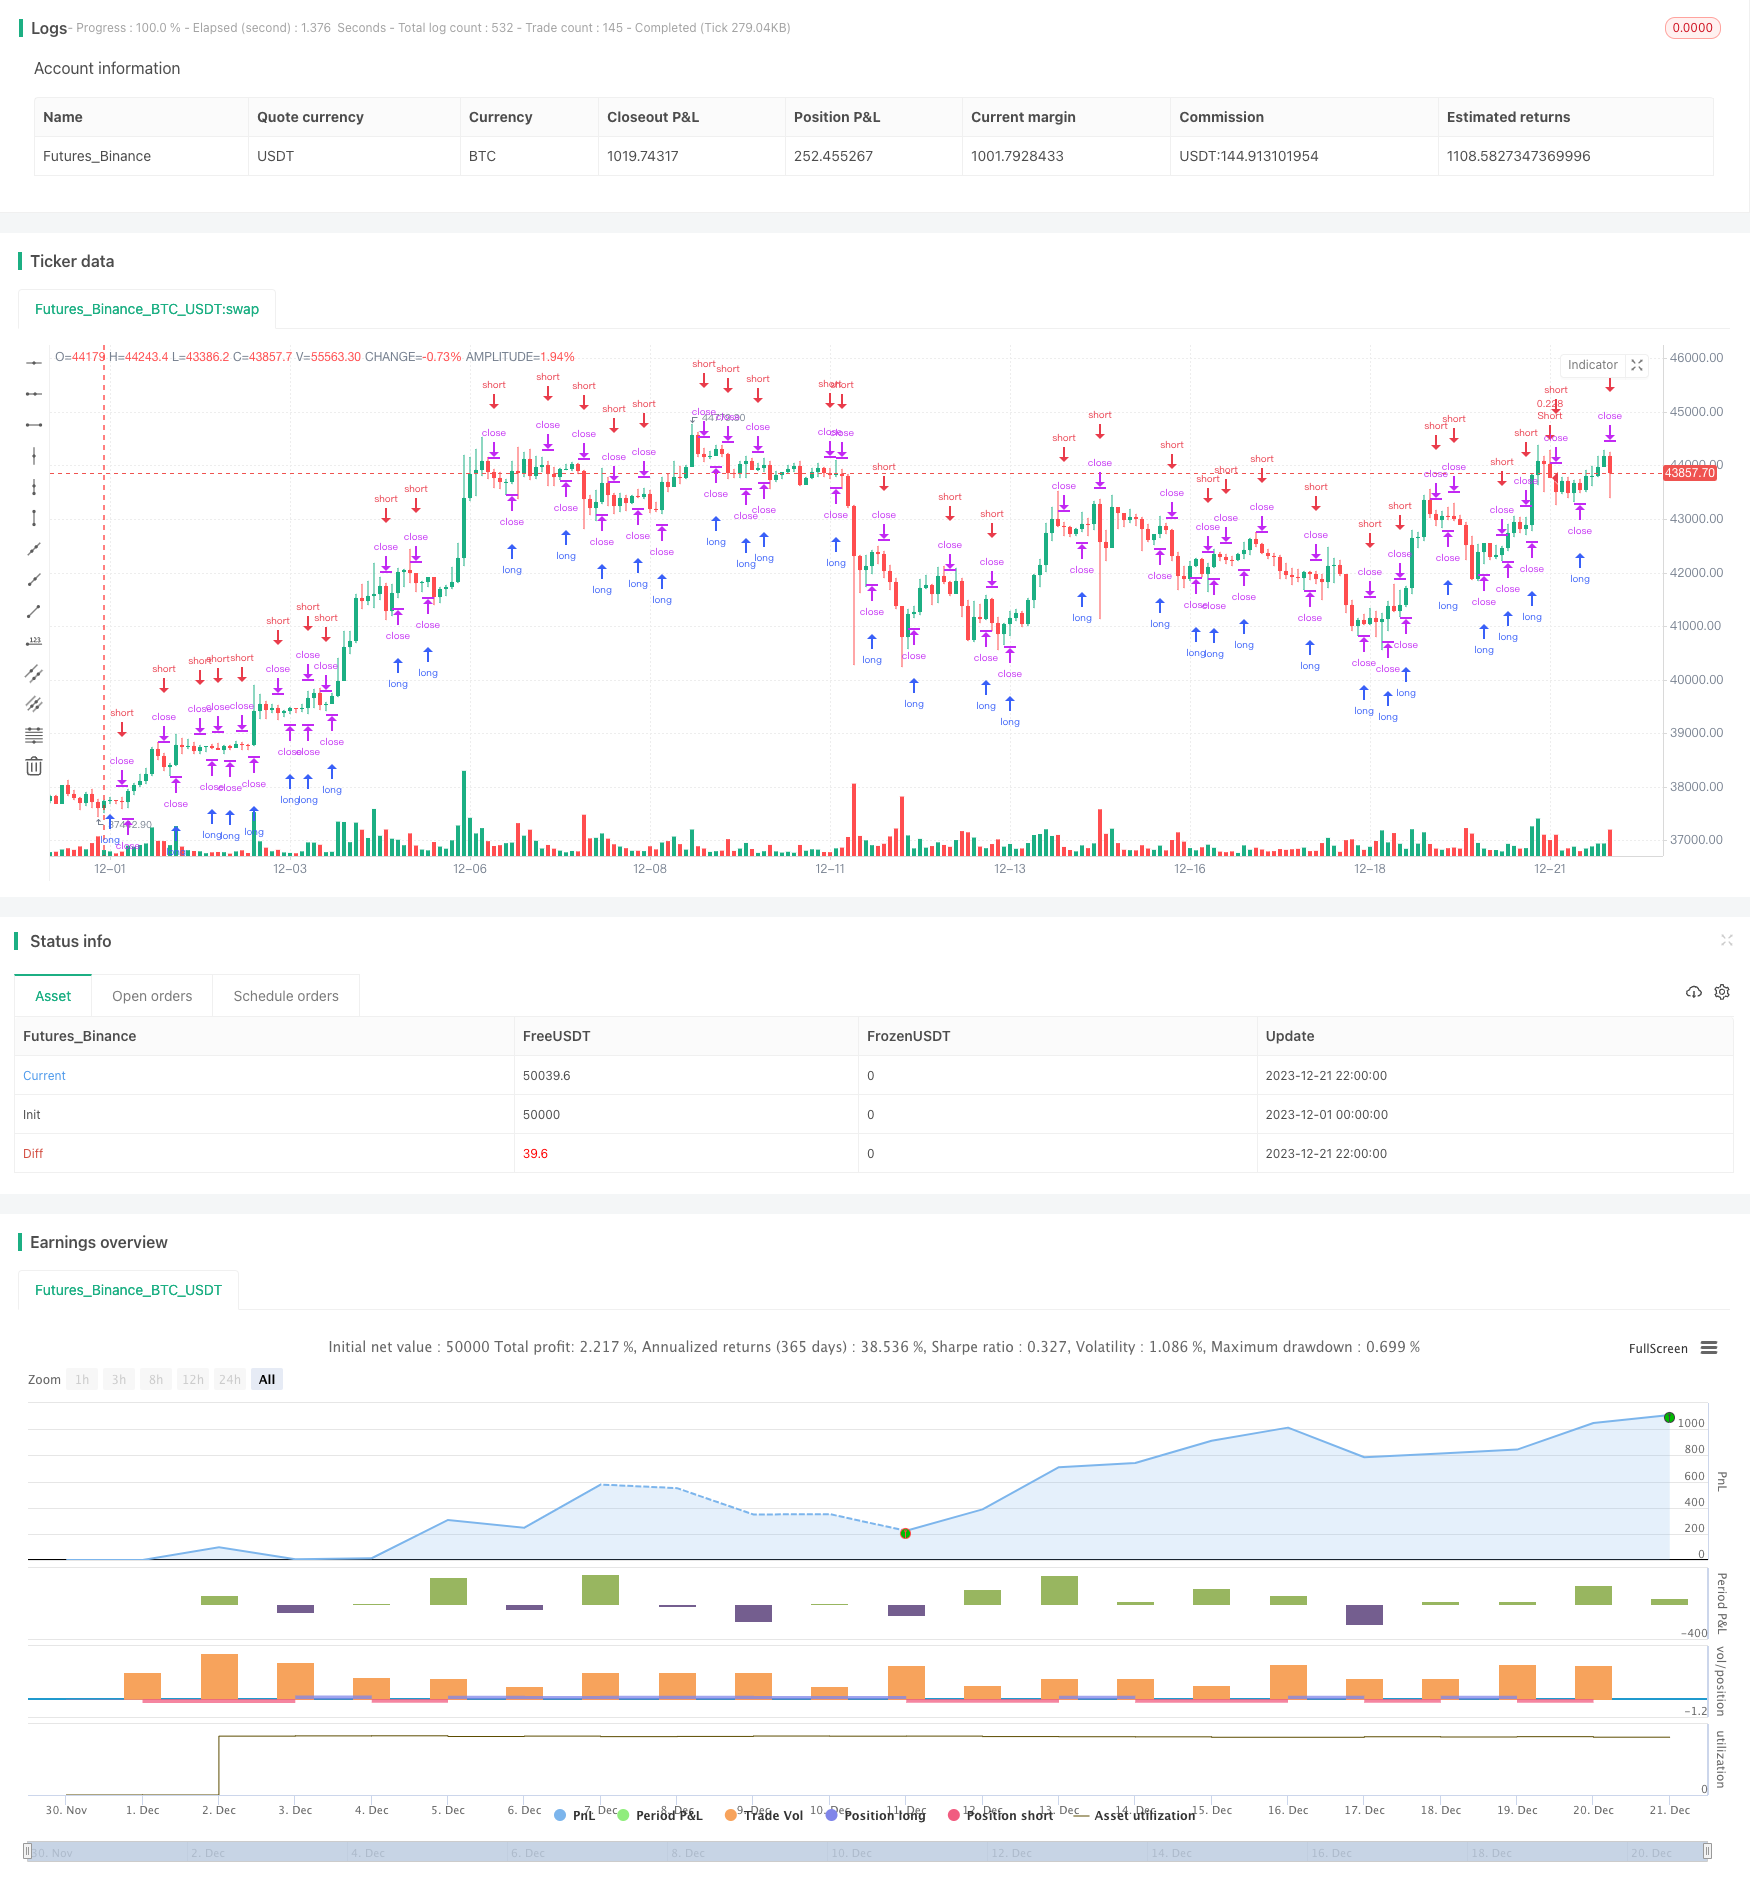
Name
基于K线形态的高频套利策略Up-Down-K-Line-Pattern-High-Frequency-Arbitrage-Strategy
Author
ChaoZhang
Strategy Description
本策略运用基于K线形态判断的方法,实现高频做市商套利。其主要思路是通过判断不同K线时间段内的多空形态,来实现高频做市商的开平交易。具体来说,策略会同时监控多个时间段的K线,当观察到连续上涨K线或连续下跌K线时,会分别做空或做多。
本策略的核心逻辑在于判断不同时间段K线的多空形态。具体来说,它会同时监控1分钟、5分钟和15分钟的K线。策略通过跟踪价格较之前N根K线是否上涨或者下跌,来判断目前的多空形态。如果是连续上涨,则认为目前是多头形态;如果是连续下跌,则认为目前是空头形态。形成多头信号时,策略会做多;形成空头信号时,策略会做空。这样,策略可以在不同时间段捕捉价格波动的趋势和反转机会,实现高频套利。
代码主要通过跟踪ups和dns两个指标来判断K线的多空形态。这两个指标分别统计连续上涨和连续下跌的K线数量。策略允许设置参数consecutiveBarsUp和consecutiveBarsDown来指定判定趋势的K线数量。当ups大于等于consecutiveBarsUp时,表示捕捉到多头形态;当dns大于等于consecutiveBarsDown时,表示捕捉到空头形态。此外,策略还设置了回测的时间范围,以及交易的委托信息等。
本策略具有以下优势:
- 捕捉高频做市商套利机会,实现高频交易
- 基于K线判断形态,简单有效
- 同时监控多个时间段,提高捕捉机会
- 直观的参数设置,容易调整
- 设置回测时间范围,方便测试优化
本策略也存在一些风险:
- 高频交易带来的风险,如数据问题、下单失败等
- 参数设置不当可能导致交易频繁或者错过良好机会
- 不能应对更加复杂的行情,如价格震荡等
为降低风险,可以从以下几个方面进行优化:
- 加入更多逻辑判断交易时机,避免盲目交易
- 优化参数设置,平衡交易频率和收益率
- 结合更多因素判断走势,如交易量变化、波动率等
- 测试不同的止损方式,控制单笔损失
本策略可以从以下几个方向进行优化:
- 增加判断形态的因素,不仅看涨跌数量,还考虑振幅、量能等指标
- 尝试不同的开平仓判断指标,如MACD、KD等
- 结合均线、通道等技术指标过滤信号
- 优化参数设置,评估不同K线时间段的参数组合
- 开发止损和止盈机制,提高策略稳定性
- 加入量化风控,如最大持仓、交易频率等限制
- 测试不同品种的效果,寻找最佳策略适配品种
本策略通过基于K线形态判断的方法,实现了一个简单有效的高频套利策略。策略的核心在于捕捉不同时间段价格的多空趋势,进而获得套利机会。尽管存在一些风险,但本策略成熟简单,非常适用于量化交易的入门。通过进一步的优化,可以使策略更加稳定、高效,从而获得更好的投资回报。
||
This strategy utilizes a K-line pattern based judgment method to implement high frequency market making arbitrage. Its main idea is to open and close trades for high frequency market making by judging bullish/bearish patterns across different K-line timeframes. Specifically, the strategy concurrently monitors multiple K-line timeframes and takes corresponding long or short positions when it observes consecutive rising or falling K-lines.
The core logic of this strategy lies in judging bullish/bearish patterns across different K-line timeframes. Specifically, it concurrently tracks 1-min, 5-min and 15-min K-lines. The strategy determines current sentiment by checking if prices have risen or fallen compared to N previous K-lines. If prices consecutively rise, it indicates a bullish sentiment; if prices consecutively fall, it signals a bearish view. Upon bullish signals, the strategy goes long; upon bearish signals, the strategy goes short. In this way, the strategy could capture trend and mean-reversion opportunities across different timeframes for high frequency arbitrage.
The core logic is implemented by tracking two indicators ups and dns, which record the number of consecutive rising and falling K-lines. Parameters consecutiveBarsUp and consecutiveBarsDown allow customization of the threshold for determining a trend. When ups is greater than or equal to consecutiveBarsUp, it signals a bullish pattern; when dns exceeds consecutiveBarsDown, it indicates a bearish pattern. In addition, the strategy specifies back-testing time range and order execution messages etc.
The advantages of this strategy include:
- Capture high frequency arbitrage opportunities for market making
- Simple and effective logic based on K-line patterns
- Concurrent monitoring of multiple timeframes improves capture rate
- Intuitive parameter tuning
- Configurable back-testing time range for optimization
There are also several risks to be aware of:
- General risks of high frequency trading like data issues, order failures etc.
- Improper parameter tuning might lead to over-trading or missing good chances
- Cannot handle more complex market conditions like whipsaws
Possible ways to mitigate the risks include:
- Incorporate more logic to determine prudent entry/exit
- Optimize parameter to balance trade frequency and profitability
- Consider more factors like volume, volatility to judge trends
- Test different stop loss mechanism to limit per trade loss
This strategy can be enhanced from the following dimensions:
- Add more factors to judge patterns beyond simple rise/fall counts, like amplitude, energy etc.
- Evaluate other entry/exit indicators like MACD, KD etc.
- Incorporate technical factors like MA, channels to filter signals
- Optimize parameters across timeframes to find best combinations
- Develop stop loss and take profit mechanisms to improve stability
- Introduce quant risk controls like maximum positions, trade frequency etc.
- Test across different products to find best fitting
This strategy realizes a simple yet effective high frequency arbitrage strategy based on K-line pattern judgment. Its core lies in capturing intraday bullish/bearish trends across timeframes for arbitrage. Despite some inherent risks, this easy to understand strategy serves a good starting point for algorithmic trading. Further enhancements around optimization and risk management will likely generate more stable and profitable results.
[/trans]
Strategy Arguments
| Argument | Default | Description |
|---|---|---|
| v_input_1 | true | consecutiveBarsUp |
| v_input_2 | true | consecutiveBarsDown |
| v_input_3 | timestamp(2021-01-01T00:00:00) | startDate |
| v_input_4 | timestamp(2021-12-31T00:00:00) | finishDate |
| v_input_5 | {{strategy.order.alert_message}} | Buy message |
| v_input_6 | {{strategy.order.alert_message}} | Sell message |
Source (PineScript)
/*backtest
start: 2023-12-01 00:00:00
end: 2023-12-21 23:59:59
period: 2h
basePeriod: 15m
exchanges: [{"eid":"Futures_Binance","currency":"BTC_USDT"}]
*/

//@version=4

// Strategy
strategy("Up/Down Strategy", initial_capital = 10000, default_qty_value = 10000, default_qty_type = strategy.cash)

consecutiveBarsUp = input(1)
consecutiveBarsDown = input(1)

price = close

ups = 0.0
ups := price > price[1] ? nz(ups[1]) + 1 : 0

dns = 0.0
dns := price < price[1] ? nz(dns[1]) + 1 : 0

// Strategy Backesting
startDate  = input(timestamp("2021-01-01T00:00:00"), type = input.time)
finishDate = input(timestamp("2021-12-31T00:00:00"), type = input.time)

time_cond  = true

// Messages for buy and sell
message_buy  = input("{{strategy.order.alert_message}}", title="Buy message")
message_sell = input("{{strategy.order.alert_message}}", title="Sell message")

// Strategy Execution

if (ups >= consecutiveBarsUp) and time_cond
    strategy.entry("Long", strategy.long, stop = high + syminfo.mintick, alert_message = message_buy)

if (dns >= consecutiveBarsDown) and time_cond
    strategy.entry("Short", strategy.short, stop = low + syminfo.mintick, alert_message = message_sell)

//plot(strategy.equity, title="equity", color=color.red, linewidth=2, style=plot.style_areabr)
Detail
https://www.fmz.com/strategy/438044
Last Modified
2024-01-08 15:47:41
