Name
基于FRAMA指标的MA均线交叉策略FraMA-and-MA-Crossover-Trading-Strategy-Based-on-FRAMA-Indicator
Author
ChaoZhang
Strategy Description
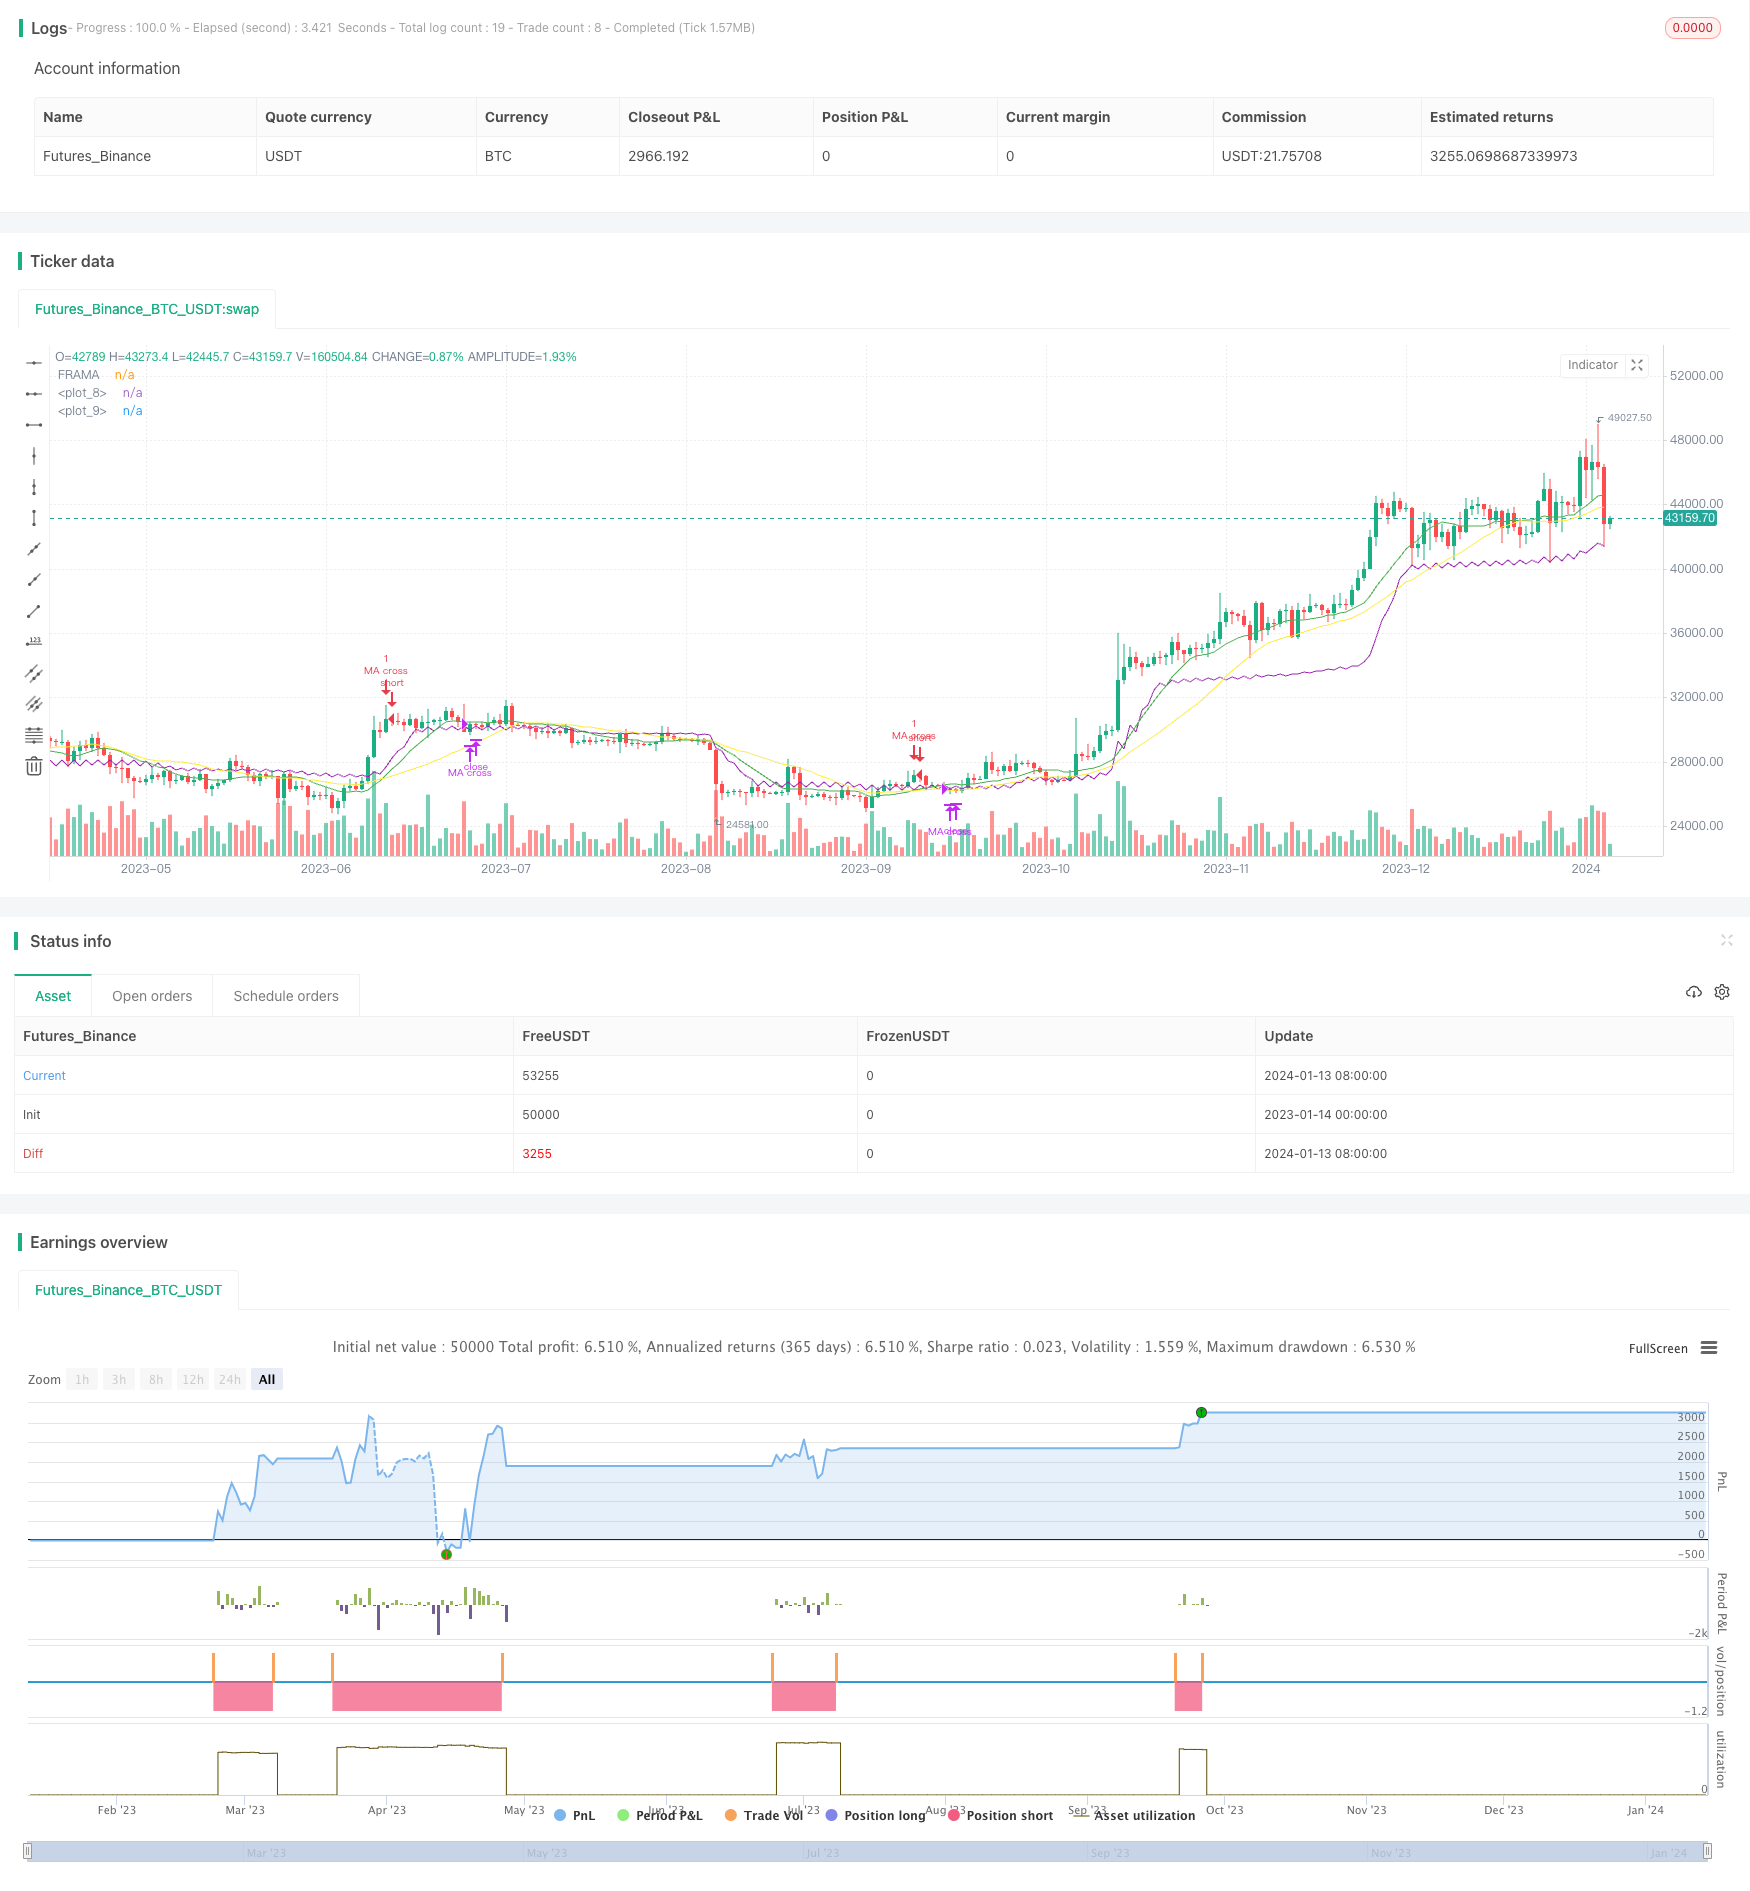
本策略首先计算快速移动平均线ma_fast和慢速移动平均线ma_slow,然后结合FRAMA自适应移动平均线,在ma_fast上穿ma_slow时做多,在ma_slow下穿ma_fast时或FRAMA下穿收盘价时平仓。
-
计算13日简单移动平均线ma_fast和26日简单移动平均线ma_slow。
-
计算FRAMA自适应移动平均线out。FRAMA的计算公式较复杂,主要思想是根据价格的最高值、最低值和波动性动态调整均线的平滑度α。
-
在ma_fast上穿ma_slow时做多。这表示短期均线开始上行,并跑赢长期均线,符合趋势的特征。
-
在ma_slow下穿ma_fast时或FRAMA下穿收盘价时平仓。这表示趋势反转信号。
-
结合双均线系统和自适应均线系统的优点。双均线系统擅长捕捉趋势,自适应均线系统可以更好地滤波噪音。
-
FRAMA指标可以自动调整参数,避免人工选择参数的主观性。
-
同时使用两个退出信号,可以及时捕捉趋势反转。
-
双均线交叉存在错位的可能,可能产生间歇性亏损。
-
自适应移动平均线会增加策略的参数量,可能导致过度优化。
-
仅考虑价格因素,没有结合交易量做过滤,可能错过机会。
-
可以测试不同周期的均线组合,寻找最佳参数。
-
可以加入成交量的确认,避免无效信号。例如增加成交量突增的条件。
-
可以优化开仓和平仓条件,使策略更稳定。例如只在延续形态突破时开仓。
本策略结合双均线交叉和FRAMA自适应均线,通过动态调整参数自动适应市场环境。双均线擅长捕捉趋势,FRAMA可以滤波噪音。同时使用两个平仓信号使策略更稳健。下一步可以进一步优化参数,加入成交量的确认,使策略更加完善。
||
This strategy calculates the fast moving average line ma_fast and slow moving average line ma_slow first, and then combines with the FRAMA adaptive moving average line. It goes long when ma_fast crosses over ma_slow, and closes position when ma_slow crosses below ma_fast or FRAMA falls below close price.
-
Calculate the 13-day simple moving average ma_fast and 26-day simple moving average ma_slow.
-
Calculate the FRAMA adaptive moving average line out. The FRAMA formula is complex, the main idea is to dynamically adjust the smoothness α of the moving average based on the highest, lowest and volatility of prices.
-
Go long when ma_fast crosses over ma_slow. This indicates the short-term moving average starts to move up and runs faster than the long-term one, matching the trending characteristics.
-
Close position when ma_slow crosses below ma_fast or FRAMA falls below close price. These indicate trend reversal signals.
-
Combines the advantages of dual moving average system and adaptive moving average system. Dual MA system is good at catching trends, while adaptive MA system filters out noises better.
-
FRAMA indicator automatically adjusts parameters, avoiding the subjectivity of manual parameter tuning.
-
Using two exit signals enables timely catching trend reversals.
-
Dual moving average crossovers can have whipsaws, resulting in intermittent losses.
-
Adaptive moving averages introduce more parameters, risking overfitting.
-
Only considers price factors without trading volume filter, hence may miss opportunities.
-
Test different MA periods to find the optimal combination.
-
Add volume confirmation to avoid false signals, e.g. requiring volume spikes.
-
Optimize entry and exit rules to make the strategy more robust, e.g. only taking signals in continuation patterns.
This strategy combines dual moving average crossover and FRAMA adaptive moving average, automatically adapting to market conditions by dynamically adjusting parameters. Dual MAs are good at catching trends while FRAMA filters out noises. Using two exit signals also makes the strategy more robust. Next steps could be further parameter optimization and adding volume filter to improve it.
[/trans]
Strategy Arguments
| Argument | Default | Description |
|---|---|---|
| v_input_1_hl2 | 0 | price: hl2 |
| v_input_2 | 16 | len |
| v_input_3 | true | FC |
| v_input_4 | 198 | SC |
Source (PineScript)
/*backtest
start: 2023-01-14 00:00:00
end: 2024-01-14 00:00:00
period: 1d
basePeriod: 1h
exchanges: [{"eid":"Futures_Binance","currency":"BTC_USDT"}]
*/

//@version=2
strategy("Fractal Adaptive Moving Average",shorttitle="FRAMA",overlay=true)


ma_fast = sma(close,13)

ma_slow = sma(close,26)
plot(ma_fast,color = green)
plot(ma_slow, color = yellow)
price = input(hl2)
len = input(defval=16,minval=1)
FC = input(defval=1,minval=1)
SC = input(defval=198,minval=1)
len1 = len/2
w = log(2/(SC+1))
H1 = highest(high,len1)
L1 = lowest(low,len1)
N1 = (H1-L1)/len1
H2 = highest(high,len)[len1]
L2 = lowest(low,len)[len1]
N2 = (H2-L2)/len1
H3 = highest(high,len)
L3 = lowest(low,len)
N3 = (H3-L3)/len
dimen1 = (log(N1+N2)-log(N3))/log(2)
dimen = iff(N1>0 and N2>0 and N3>0,dimen1,nz(dimen1[1]))
alpha1 = exp(w*(dimen-1))
oldalpha = alpha1>1?1:(alpha1<0.01?0.01:alpha1)
oldN = (2-oldalpha)/oldalpha
N = (((SC-FC)*(oldN-1))/(SC-1))+FC
alpha_ = 2/(N+1)
alpha = alpha_<2/(SC+1)?2/(SC+1):(alpha_>1?1:alpha_)
out = (1-alpha)*nz(out[1]) + alpha*price
plot(out,title="FRAMA",color=purple,transp=0)
entry() => crossover(ma_fast, ma_slow) and (out < close)
exit() => crossover(ma_slow, ma_fast) or crossunder(out, close)

strategy.entry(id= "MA cross", long = true, when = entry())
strategy.close(id= "MA cross", when = exit())
Detail
https://www.fmz.com/strategy/438806
Last Modified
2024-01-15 14:38:48
