Name
基于EMA均线的短线交易策略Short-term-Trading-Strategy-Based-on-EMA
Author
ChaoZhang
Strategy Description
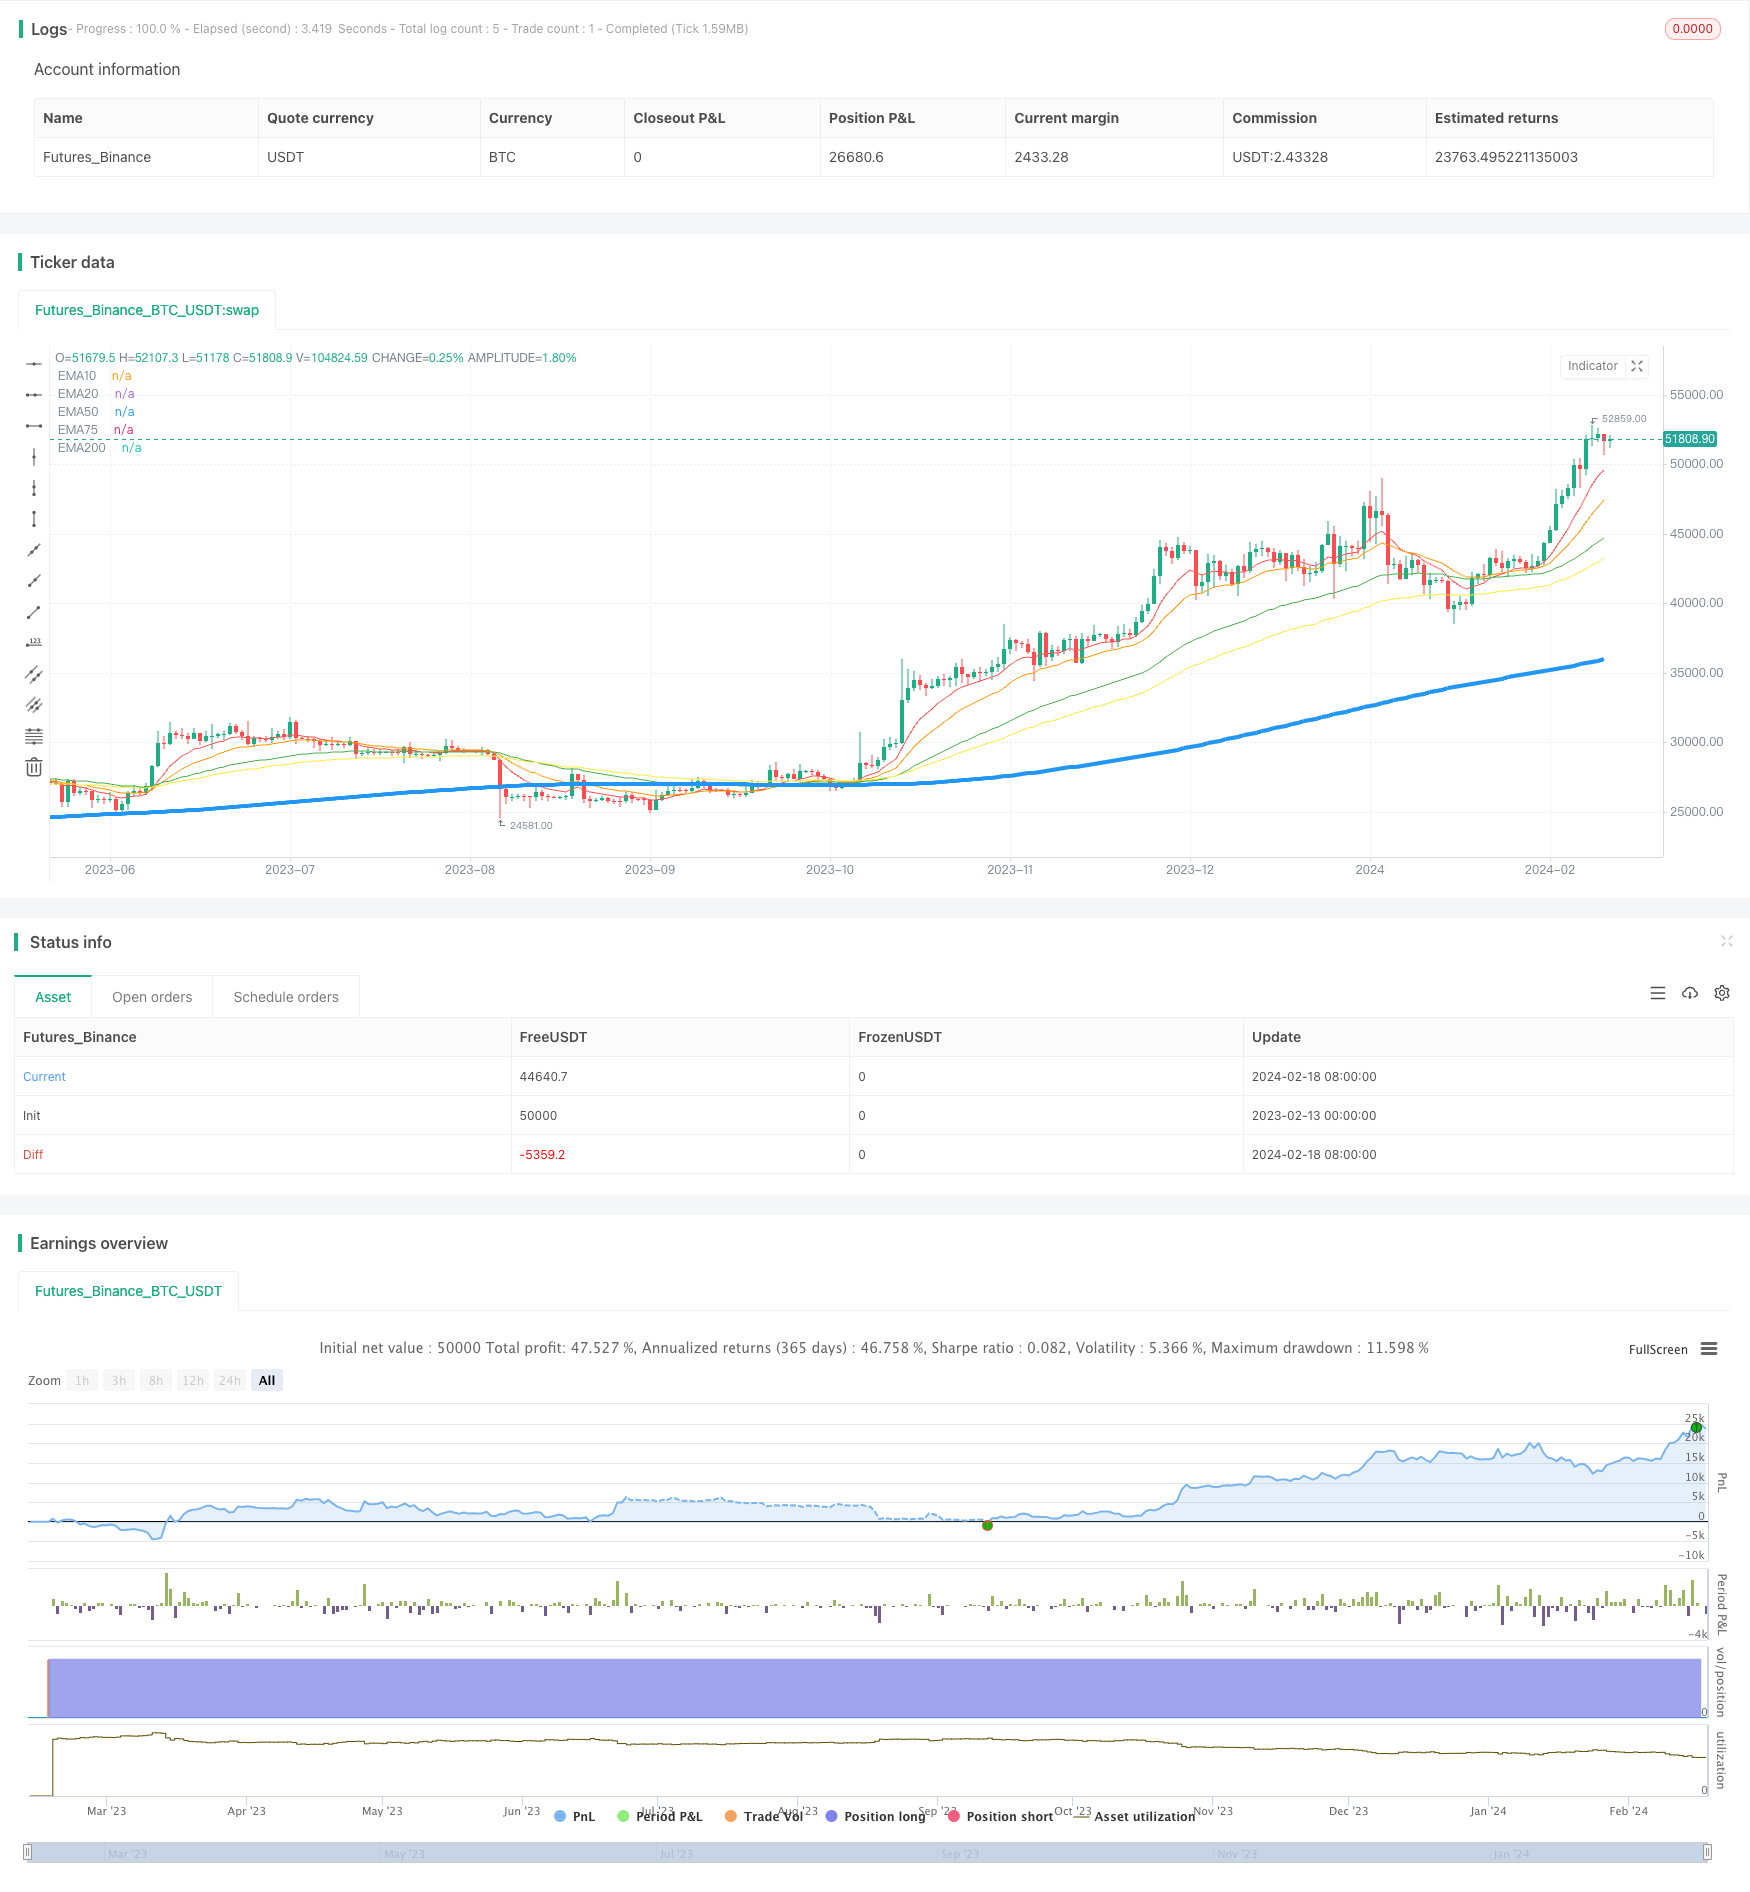
本策略基于EMA均线的交叉原理,设计了一个短线交易策略,可以在股价出现一定程度回调时,进行适当的短线交易,以期获得较好的收益。
该策略使用5种不同参数的EMA均线,具体为10日线、20日线、50日线、75日线和200日线。其交易信号的生成逻辑是:
-
当价格上穿75日线,且下穿50日线时,视为股价出现一定幅度的短线回调信号,可以考虑做空;
-
在做空后,如果10日线下穿20日线,则继续持有空单;当10日线重新上穿20日线时,则平仓买入,结束该轮的短线交易。
通过这样的交易逻辑设计,可以抓住股价短期内的较大波动,在回调阶段赚取证券差价。
该策略最大的优势在于交易信号生成简单清晰,容易实施。仅仅依靠几条移动平均线的交叉情况,就可以完成交易决策。无需复杂的模型和大量历史数据,降低了实施难度。
另外,策略采用多组EMA均线进行组合,可以有效过滤市场噪音,识别出中短期趋势反转的时点,从而精确做出交易决策。
该策略主要风险在于股价短期内的剧烈波动。若股价出现失控的快速上涨或下跌,将导致止损或止盈线被突破,造成较大的亏损。此外,若选取的参数不当,则交易信号可能过于频繁,也会影响策略收益。
为控制风险,应适当调整均线参数,使交易频率维持在适度水平;同时设置合理的止损止盈幅度,避免单笔亏损过大。当面对特殊的市场情况时,也需要人工干预,暂停策略交易。
该策略主要优化空间在参数调整上。可以测试更多组合的参数,寻找最优的参数组合。例如可以引入更多平均线,如60日线、120日线等,组成更丰富的交易信号源。
另外也可以在止损、止盈等维度进行优化。适当放宽止损幅度,可能可以减少错止损的概率;收紧止盈幅度,可能可以提高盈利能力。这些参数的调整都需要根据回测结果,选择最优参数。
本策略整体而言较为简单,以EMA均线交叉为基础,设计了一个简单可行的短线交易策略。该策略信号清晰,易于实施,能够有效抓取中短期趋势反转带来的交易机会。通过参数调整与止损、止盈设置的优化,可以使该策略获得更好的效果。
||
This strategy is designed with the crossover principles of EMA lines to make appropriate short-term trades and gain decent profits when prices fall back to some extent.
The strategy adopts 5 EMA lines with different parameters, specifically the 10-day, 20-day, 50-day, 75-day and 200-day lines. The logic for generating trading signals is:
-
When the price crosses above the 75-day line and falls below the 50-day line, it is considered a signal for a proper short-term pullback to take a short position.
-
After going short, if the 10-day line crosses below the 20-day line, continue holding the short position. When the 10-day line crosses back above the 20-day line, close the position to complete this round of short-term trade.
Through this logic design, major fluctuations of prices in the short run can be caught to gain from price spreads during pullbacks.
The biggest advantage of this strategy lies in its simple and clear signals that are easy to implement. Just by the crossover situation of several moving averages, trading decisions can be made smoothly, without complex models and loads of historical data, lowering the difficulty of implementation.
In addition, the combo use of multiple EMA lines helps filter out market noise effectively and spot the timing of mid-to-short term trend reversals precisely to make sensible trading decisions.
The major risk of this strategy comes from violent price swings in the short term. Uncontrolled sharp rises or falls may result in stop loss or take profit lines being broken, causing huge losses. Also, improper parameters may lead to overfrequent trading signals that undermine strategy profitability.
To control risks, parameters of moving averages should be adjusted appropriately to maintain signal frequency at a proper level. Reasonable stop loss and take profit ranges should also be set to avoid oversized losses per trade. Manual intervention is needed as well facing special market conditions, suspending strategy trading.
The main optimization space lies in parameter tuning. More combinations can be tested to find the optimal parameter portfolio. For instance, more moving averages can be introduced like 60-day and 120-day lines to form a richer signal source.
Optimization can also be done around aspects like stop loss and take profit. Properly loosening the stop loss range may decrease the probability of wrong stops. Tightening take profit range could increase profitability. These parameter adjustments need to be based on backtest results for optima.
To conclude, this strategy is fairly simple overall. Designed with basic EMA crossover signals, it shapes into a feasible short-term trading tactic. Its advantage lies in clear signals that are easy to carry out, which can effectively seize trading opportunities from mid-to-short term trend reversals. Further improvements can be achieved through parameter tuning and optimizing stop loss, take profit settings.
[/trans]
Source (PineScript)
/*backtest
start: 2023-02-13 00:00:00
end: 2024-02-19 00:00:00
period: 1d
basePeriod: 1h
exchanges: [{"eid":"Futures_Binance","currency":"BTC_USDT"}]
*/

// © theswissguy

//@version=5
strategy("Jan 2024 Daily (Short)", initial_capital = 10000, overlay=true, commission_value = 1)

// use closing prices as data source throughout calcs.
ema_source = close
price = close

// set up the EMA curves.
ema10 = ta.ema(ema_source, 10)
ema20 = ta.ema(ema_source, 20)
ema50 = ta.ema(ema_source, 50)
ema75 = ta.ema(ema_source, 75)
ema200 = ta.ema(ta.ema(ema_source, 200), 35)

plot(ema10, color=color.red, title="EMA10")
plot(ema20, color=color.orange, title="EMA20")
plot(ema50, color=color.green, title="EMA50")
plot(ema75, color=color.yellow, title="EMA75")
plot(ema200, color=color.blue, title="EMA200", linewidth = 4)

// if EMA50 <= price <= EMA75 AND EMA10 < EMA20 - sell
dailySellIndicator = ta.crossover(price, ema75) and ta.crossunder(price, ema50) and ta.crossunder(ema10, ema20)
dailyBuyIndicator = ta.crossover(ema10, ema20)

if(dailySellIndicator)
    strategy.entry("daily", strategy.short)
else if(dailyBuyIndicator)
    strategy.entry("daily", strategy.long)
Detail
https://www.fmz.com/strategy/442225
Last Modified
2024-02-20 14:06:27
