Name
基于EMA均线和MACD指标的BTC交易策略EMA-and-MACD-Based-BTC-Trading-Strategy
Author
ChaoZhang
Strategy Description
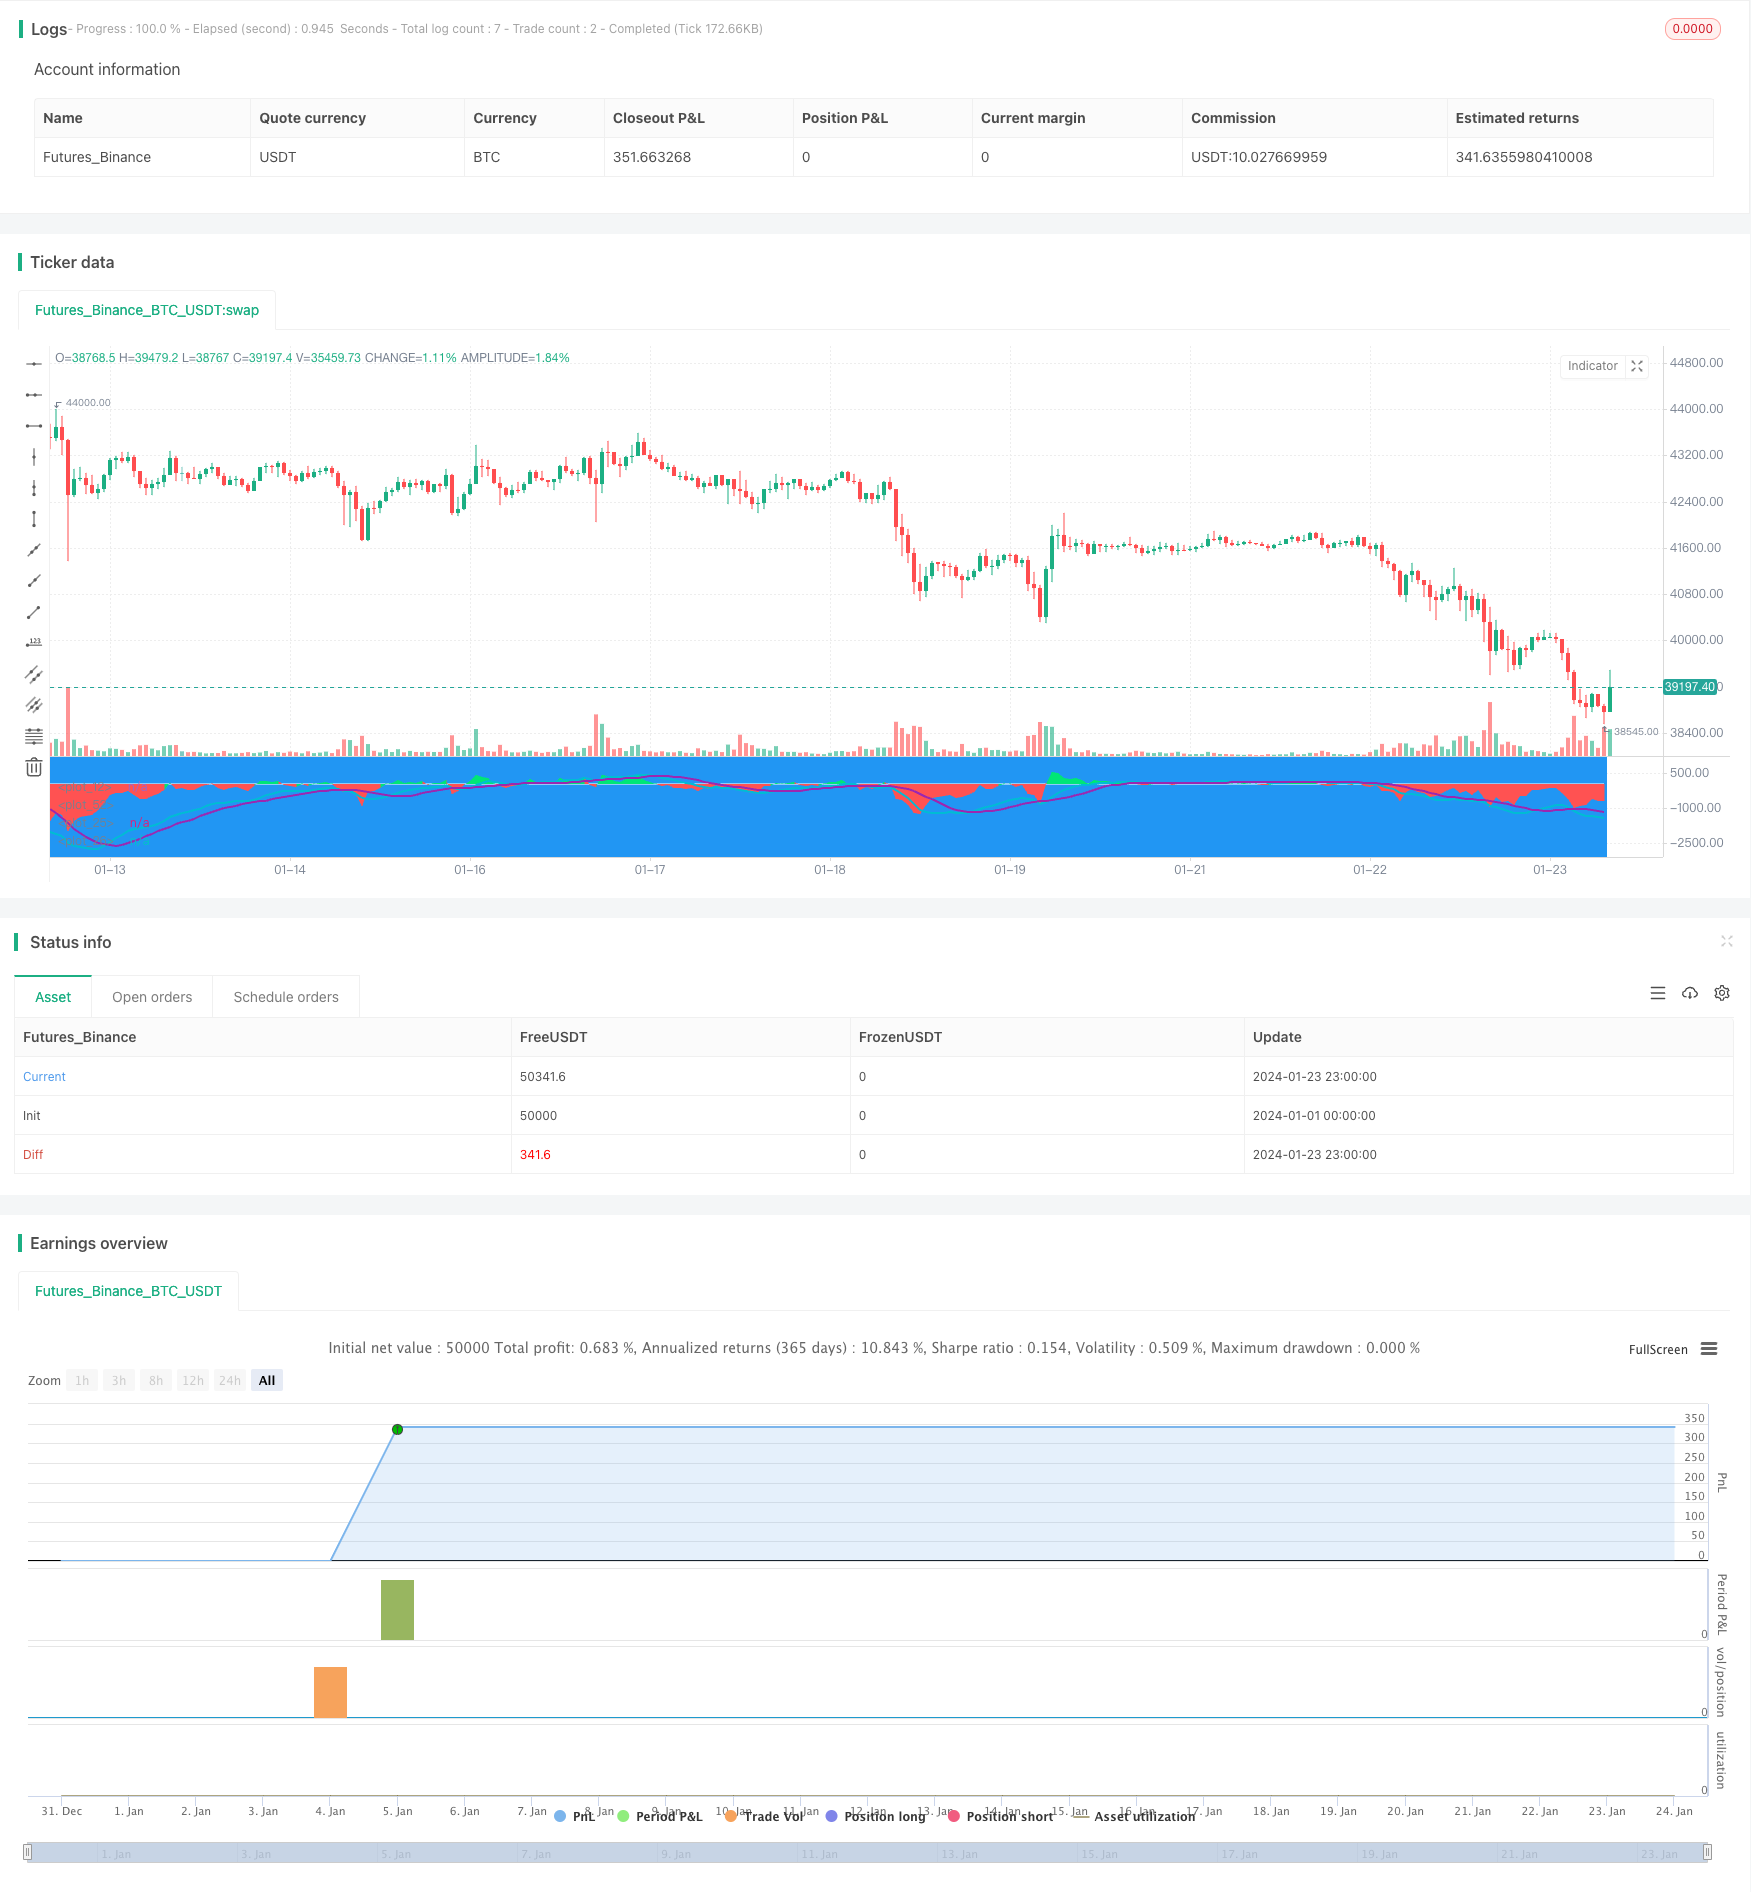
本策略是一种基于EMA均线差值和MACD指标的复合策略,用于BTC的短线交易。它结合了EMA均线和MACD的信号,在特定条件下产生买入和卖出信号。
当差值为负,且小于阈值,并且MACD出现空头交叉时,产生买入信号。当差值为正,且大于阈值,并且MACD出现多头交叉时,产生卖出信号。
通过组合使用EMA均线差值和MACD指标的信号,可以过滤掉一些假信号,提高信号的可靠性。
- 使用了复合指标,信号更可靠
- 采用短周期参数设定,适合短线交易
- 有止损和止盈设置,可以控制风险
- 市场剧烈波动时,止损可能被突破
- 需优化参数,使其更符合不同市场环境
- 需测试不同币种和不同交易所的效果
- 优化EMA和MACD的参数,使其更符合BTC的波动环境
- 增加开仓仓位和加减仓策略,优化资金利用效率
- 增加止损方式,如移动止损、振荡止损等,降低风险
- 测试不同交易所和不同币种的效果
本策略整合了均线和MACD两个指标的优点,使用了复合信号,可以有效过滤虚假信号。通过优化参数和开仓策略,可以得到稳定的收益。但是也需要警惕止损被突破的风险,需要进一步测试和完善。
||
This strategy is a composite strategy based on EMA difference and MACD indicator for short-term BTC trading. It combines the signals from EMA and MACD to generate buy and sell signals under certain conditions.
It generates buy signals when the difference is negative and below a threshold and MACD has a bearish crossover. It generates sell signals when the difference is positive and above a threshold and MACD has a bullish crossover.
By combining the signals from both EMA difference and MACD, some fake signals can be filtered out and the reliability of signals is improved.
- Uses composite indicators, more reliable signals
- Adopts short-term parameters, suitable for short-term trading
- Has stop loss and take profit settings to control risks
- Stop loss may be broken during huge market swings
- Parameters need to be optimized for different market environments
- Effects need to be tested on different coins and exchanges
- Optimize EMA and MACD parameters to fit BTC volatility
- Add position sizing and pyramiding strategies to improve capital efficiency
- Add stop loss methods like trailing stop loss to reduce risks
- Test effects on different exchanges and coins
This strategy integrates the strengths of both EMA and MACD indicators and uses composite signals to effectively filter out false signals. With optimized parameters and position strategies, stable returns can be achieved. But risks like stop loss being hit need attention and further testing and improvement is required.
[/trans]
Strategy Arguments
| Argument | Default | Description |
|---|---|---|
| v_input_1 | 18 | EMA |
| v_input_2 | 12 | MACDfast |
| v_input_3 | 26 | MACDslow |
| v_input_4 | 8 | EMADiffThreshold |
| v_input_5 | 80 | MACDThreshold |
| v_input_6 | 65 | TargetValidityThreshold |
| v_input_7 | 120 | Target |
| v_input_8 | 650 | StopLoss |
Source (PineScript)
/*backtest
start: 2024-01-01 00:00:00
end: 2024-01-24 00:00:00
period: 1h
basePeriod: 15m
exchanges: [{"eid":"Futures_Binance","currency":"BTC_USDT"}]
*/

//@version=3
strategy("EMA50Diff & MACD Strategy", overlay=false)
EMA = input(18, step=1)
MACDfast = input(12)
MACDslow = input(26)
EMADiffThreshold = input(8)
MACDThreshold = input(80)
TargetValidityThreshold = input(65, step=5)
Target = input(120, step=5)
StopLoss = input(650, step=5)
ema = ema(close, EMA)
hl = plot(0, color=white, linewidth=1)
diff = close - ema
clr = color(blue, transp=100)
if diff>0
    clr := lime
else
    if diff<0
        clr := red

fastMA = ema(close, MACDfast)
slowMA = ema(close, MACDslow)
macd = (fastMA - slowMA)*3
signal = sma(macd, 9)
plot(macd, color=aqua, linewidth=2)
plot(signal, color=purple, linewidth=2)

macdlong = macd<-MACDThreshold and signal<-MACDThreshold and crossover(macd, signal)
macdshort = macd>MACDThreshold and signal>MACDThreshold and crossunder(macd, signal)
position = 0.0
position := nz(strategy.position_size, 0.0)
long = (position < 0 and close < strategy.position_avg_price - TargetValidityThreshold and macdlong) or
     (position == 0.0 and diff < -EMADiffThreshold and diff > diff[1] and diff[1] < diff[2] and macdlong)

short = (position > 0 and close > strategy.position_avg_price + TargetValidityThreshold and macdshort) or
      (position == 0.0 and diff > EMADiffThreshold and diff < diff[1] and diff[1] > diff[2] and macdshort)
amount = (strategy.equity / close) //- ((strategy.equity / close / 10)%10)
bgclr = color(blue, transp=100) //#0c0c0c
if long
    strategy.entry("long", strategy.long, amount)
    bgclr := green
if short
    strategy.entry("short", strategy.short, amount)
    bgclr := maroon
bgcolor(bgclr, transp=20)
strategy.close("long", when=close>strategy.position_avg_price + Target)
strategy.close("short", when=close<strategy.position_avg_price - Target)
strategy.exit("STOPLOSS", "long", stop=strategy.position_avg_price - StopLoss)
strategy.exit("STOPLOSS", "short", stop=strategy.position_avg_price + StopLoss)
//plotshape(long, style=shape.labelup, location=location.bottom, color=green)
//plotshape(short, style=shape.labeldown, location=location.top, color=red)
pl = plot(diff, style=histogram, color=clr)
fill(hl, pl, color=clr)
Detail
https://www.fmz.com/strategy/439963
Last Modified
2024-01-25 12:54:16
