Name
基于EMA回调的Pullback空头策略Emma-Pullback-Short-Strategy
Author
ChaoZhang
Strategy Description
该策略利用50周期的EMA均线和K线的收盘价进行判断,在价格向下突破EMA均线时做空,等待价格回调2-3根K线后,如果出现吞噬形态的K线,则在该K线收盘后开仓做空,进行短线操作。
首先计算50周期的EMA均线,然后判断价格是否从上向下突破该EMA均线,如果突破则记录为空头冲动。然后判断后续K线是否出现向上的回调,如果回调幅度超过上一根K线的最低价,则记为回调信号。在回调后,进一步判断后续1-2根K线是否形成吞噬形态,如果形成吞噬则记录为吞噬信号。当同时满足空头冲动、回调和吞噬3个条件时,在该吞噬K线收盘后开仓做空,进行短线操作。
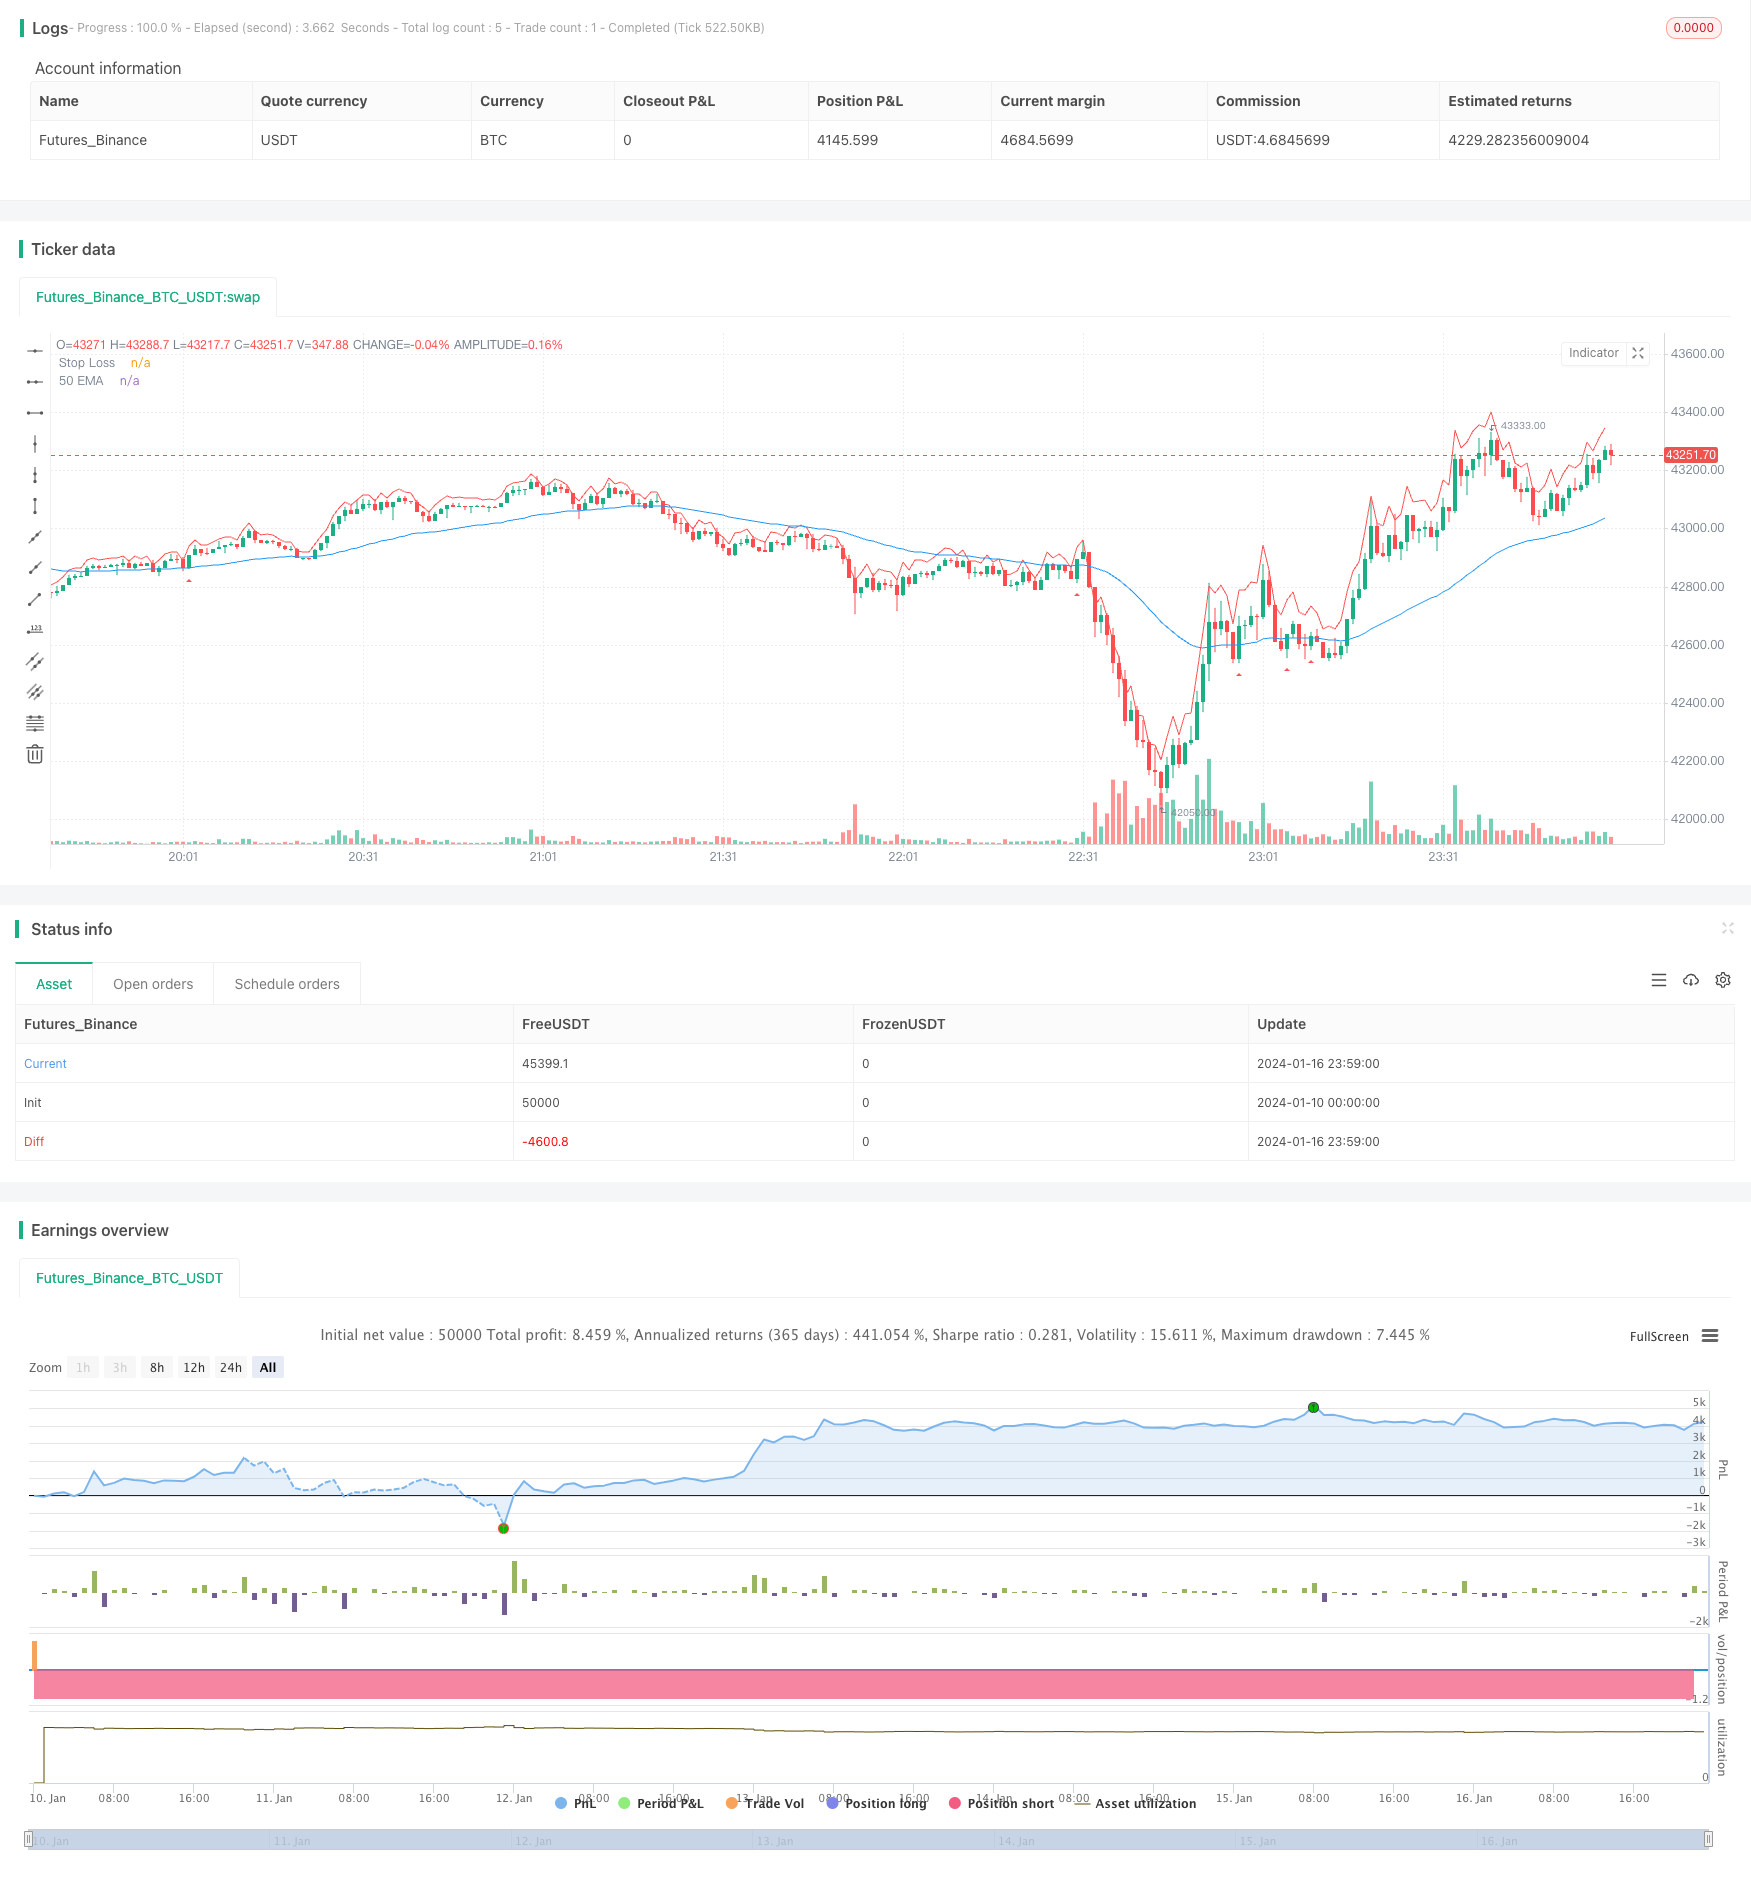
策略会绘制50周期EMA均线,在发出做空信号时,在K线下方绘制向下红色三角标记。同时给出止损位,绘制红色的止损线。
该策略結合趋势判断和形态特征,能够有效抓住趋势反转机会。首先利用EMA判别趋势方向,然后在回调过程中利用吞噬形态发出信号,避免被假突破所迷惑。止损清晰,回撤控制到位。适合短线操作。
该策略主要依赖EMA判定趋势方向,如果出现剧烈的突破可能会产生误判。吞噬形态判断有一定主观性,数量和深度都需要参数优化。止损位置也需要根据市场波动程度进行调整。总体来说,该策略更适合稳定运行的股指市场,适合短线操作。
可以通过优化EMA参数、回调K线数量、吞噬K线数量等参数来获得更好的策略效果。此外,还可以考虑结合其他指标判断趋势和回调信号。
-
EMA周期优化:可以测试更多的EMA周期,如30、40或60周期,找到最佳参数。
-
回调K线数量优化:测试2-5根等不同数量,找到最佳回调信号。
-
吞噬K线数量优化:测试1-3根等不同数量,找到最佳吞噬信号。
-
止损倍数优化:可以测试0.5-2倍ATR止损,找到最佳止损位置。
-
考虑加入其他指标判定信号,如MACD、KDJ等,提高信号准确性。
-
可以测试不同的品种,如股指、原油、贵金属等,扩大适用范围。
该策略首先利用EMA判断趋势方向,然后结合回调和吞噬形态发出做空信号,是一种典型的趋势反转策略。它结合趋势判断和形态特征,能够有效抓住反转机会。策略参数优化到位后,可以获得不错的效果。总体来说,该策略操作简单,风险可控,非常适合短线操作。它的优点在于及时抓住反转行情,而且有明确的止损点。总体来说,该策略具有一定的实用价值。
||
This strategy uses the 50-period EMA and the closing price of candlesticks to determine signals. When the price breaks through the EMA line downward, it goes short. After the price pulls back for 2-3 candlesticks, if a candlestick with engulfing pattern appears, it opens a short position after the close of that candlestick for short-term trading.
First, the 50-period EMA line is calculated. Then it judges if the price breaks through this EMA line downward. If broken, it records a bearish impulse signal. Next, it checks if the subsequent candlesticks have an upward pullback, if the pullback amplitude is higher than the lowest price of the previous candlestick, it records a pullback signal. After the pullback, it further judges if the next 1-2 candlesticks form an engulfing pattern. If engulfing formed, it records an engulfing signal. When the bearish impulse, pullback and engulfing signals appear together, it opens a short position after the close of the engulfing candlestick for short-term trading.
The strategy plots the 50-period EMA line. When a short signal triggers, it plots a red downward triangle below the candlestick. It also gives a stop loss level and plots a red stop loss line.
This strategy combines trend judgment and pattern recognition, which can effectively catch trend reversal opportunities. It first uses EMA to determine the trend direction, then uses the engulfing pattern during pullback to avoid being misguided by false breakouts. The stop loss is clear and drawdown is well controlled. It is suitable for short-term trading.
This strategy mainly relies on EMA to determine the trend direction. In case of violent breakout, misjudgment may occur. The engulfing pattern judgment has some subjectivity, the quantity and depth need parameter optimization. The stop loss position also needs adjustment based on market volatility. Overall, this strategy is more suitable for stable index markets and short-term trading.
Parameters like EMA period, number of pullback candles, number of engulfing candles can be optimized for better strategy performance. In addition, other indicators can be considered to determine trend and pullback signals.
-
EMA Period Optimization: Test more EMA periods like 30, 40 or 60 to find the optimal one.
-
Number of Pullback Candles: Test 2-5 candles to find the optimal pullback signal.
-
Number of Engulfing Candles: Test 1-3 candles to find the optimal engulfing signal.
-
Stop Loss Multiple: Test 0.5-2 ATR for optimal stop loss position.
-
Consider adding other indicators like MACD, KDJ to improve signal accuracy.
-
Test on different products like indexes, crude oil, gold to expand scope.
This strategy first uses EMA to determine the trend direction, then combines pullback and engulfing pattern to generate short signals, a typical trend reversal strategy. By combining trend judgment and pattern recognition, it can effectively catch reversal opportunities. After parameter optimization, good results can be achieved. Overall, this strategy has easy operation, controllable risk and is suitable for short-term trading. Its advantage lies in timely catching reversal trends, with a clear stop loss point. In general, this strategy has good practical value.
[/trans]
Strategy Arguments
| Argument | Default | Description |
|---|---|---|
| v_input_1 | 50 | EMA Length |
| v_input_2 | 3 | Number of Pullback Candles |
| v_input_3 | true | Number of Engulfing Candles |
| v_input_4 | true | Stop Loss (in ATR) |
Source (PineScript)
/*backtest
start: 2024-01-10 00:00:00
end: 2024-01-17 00:00:00
period: 1m
basePeriod: 1m
exchanges: [{"eid":"Futures_Binance","currency":"BTC_USDT"}]
*/

//@version=4
strategy(title="Linor Pullback Short Strategy", shorttitle="EMA Pullback", overlay=true)

// Define strategy parameters
ema_length = input(50, title="EMA Length")
pullback_candles = input(3, title="Number of Pullback Candles")
engulfing_candles = input(1, title="Number of Engulfing Candles")
stop_loss = input(1, title="Stop Loss (in ATR)")

// Calculate the EMA
ema = ema(close, ema_length)

// Define bearish impulse condition
bearish_impulse = crossover(close, ema)

// Define pullback condition
pullback_condition = false
for i = 1 to pullback_candles
    if close[i] > close[i - 1]
        pullback_condition := true
    else
        pullback_condition := false

// Define engulfing condition
engulfing_condition = false
for i = 1 to engulfing_candles
    if close[i] < open[i] and close[i-1] > open[i-1]
        engulfing_condition := true
    else
        engulfing_condition := false

// Define the entry condition
entry_condition = bearish_impulse and pullback_condition and engulfing_condition

// Plot the EMA on the chart
plot(ema, color=color.blue, title="50 EMA")

// Plot shapes on the chart to mark entry points
plotshape(entry_condition, style=shape.triangleup, location=location.belowbar, color=color.red, size=size.small)

// Define and plot the stop loss level
atr_value = atr(14)
stop_loss_level = close + atr_value * stop_loss
plot(stop_loss_level, color=color.red, title="Stop Loss")

// Strategy orders
strategy.entry("Short", strategy.short, when=entry_condition)
strategy.exit("Stop Loss/Target", from_entry="Short", stop=stop_loss_level, when=strategy.position_size[1] > 0)

// Plot strategy performance on the chart
Detail
https://www.fmz.com/strategy/439183
Last Modified
2024-01-18 11:02:17
