Name
基于ATR和EMA的趋势跟随策略All-about-the-ATR-and-EMA-based-trend-following-strategy
Author
ChaoZhang
Strategy Description
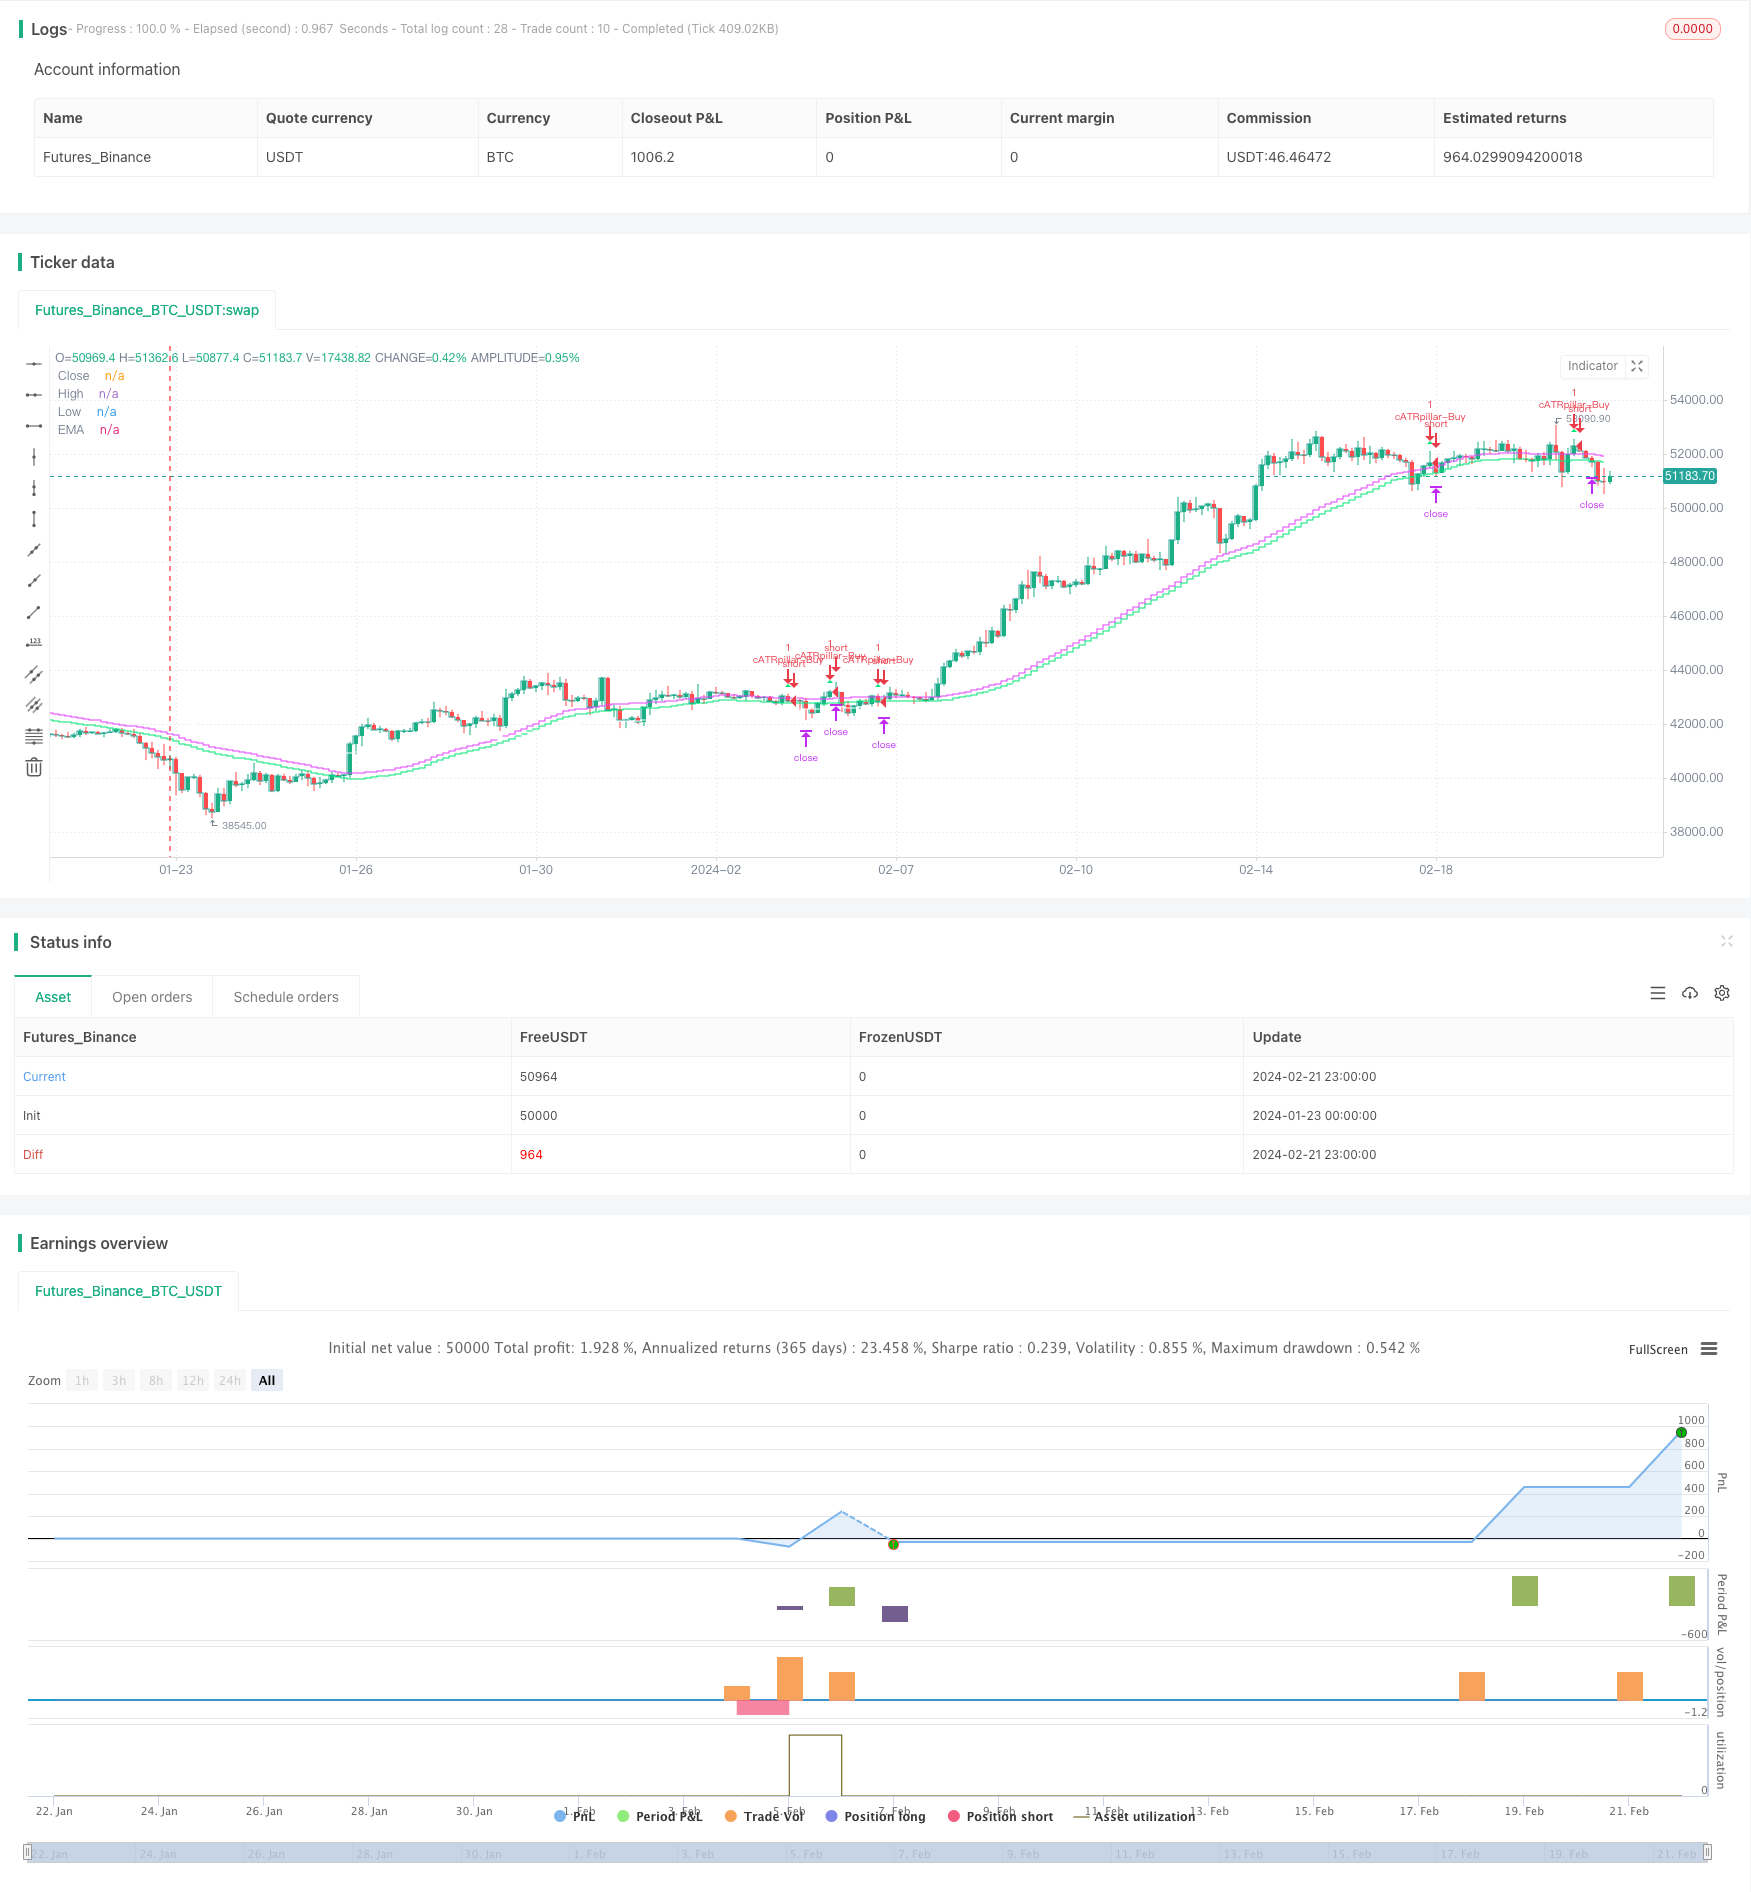
本策略的核心思想是利用ATR指标计算出的价格波动范围来判断价格突破,以及EMA指标判断整体趋势方向,实现趋势跟随交易。当价格从ATR范围上沿或下沿突破时,如果突破方向与EMA方向一致,则入场做多或做空。平仓条件为价格回破ATR范围。
首先,该策略使用ATR指标计算出一定周期内的价格波动范围。ATR范围的上限为SMA+ATR,下限为SMA-ATR。其中SMA代表当日收盘价的简单移动平均,ATR代表真实波幅平均值。
当价格从ATR范围上沿或下沿突破时,就形成交易机会。此时需要判断方向,如果是向上突破则做多,如果是向下突破则做空。为了确保突破方向与趋势方向一致,策略利用EMA指标判断整体趋势方向。只有当突破方向与EMA方向一致时,才会入场。
最后,策略以价格回破ATR范围作为平仓信号。做多后价格跌破下限就平仓;做空后价格涨破上限就平仓。
-
利用ATR指标判断突破,可以有效抓取价格趋势性突破。ATR范围根据波动率设定,不会对正常波动产生过多干扰。
-
增加EMA指标作为方向判断,避免与趋势方向相反交易,可大幅提高获利率。
-
采用价格回破ATR范围作为止损方式,可以最大限度控制亏损风险。
-
在震荡行情中,ATR范围可能被频繁打穿,容易造成过多无效交易和扩大亏损。
-
EMA作为判断趋势方向的指标,存在一定滞后性。所以可能错过价格短期反转的机会。
-
止损方式为价格回破,容易因突发事件造成扩大亏损。
-
可以考虑结合其他指标判断趋势和回撤,避免EMA单一判断错误。例如MACD,KDJ等。
-
可以考虑根据市场波动率实时调整ATR参数,使ATR范围更贴近真实波动。
-
可以结合移动止损方式,实时调整止损点,最大限度控制单笔亏损风险。
本策略整体思路清晰,利用ATR指标判断价格突破并配合EMA判断方向,可以有效跟随趋势;止损方式直接,容易操作。但同时也存在一定风险,优化空间较大,有待进一步测试和调整。总体来说,本策略适合追求高胜率的趋势交易者。
||
The core idea of this strategy is to use the price fluctuation range calculated by the ATR indicator to judge price breakthroughs, and the EMA indicator to judge the overall trend direction, so as to achieve trend following trading. When the price breaks through the upper or lower limit of the ATR range, if the breakthrough direction is consistent with the EMA direction, take long or short positions. The closing condition is that the price breaks through the ATR range again.
Firstly, this strategy uses the ATR indicator to calculate the price fluctuation range over a certain period. The upper limit of the ATR range is SMA+ATR, and the lower limit is SMA-ATR. Where SMA represents the simple moving average of the closing price on the day, and ATR represents the True Range Average.
When the price breaks through the upper or lower limit of the ATR range, a trading opportunity occurs. At this time, it is necessary to judge the direction. If it is an upward breakthrough, go long. If it is a downward breakthrough, go short. To ensure the breakthrough direction is consistent with the trend direction, the strategy uses the EMA indicator to determine the overall trend direction. Only when the breakthrough direction is consistent with the EMA direction will a position be taken.
Finally, the strategy uses the price breaking through the ATR range again as the closing signal. After going long, close the position when the price falls below the lower limit; after going short, close the position when the price rises above the upper limit.
-
Using the ATR indicator to determine breakthroughs can effectively capture price trend breakthroughs. The ATR range is set based on volatility and will not interfere too much with normal fluctuations.
-
Adding the EMA indicator as a directional judgment avoids trading against the trend direction, which can greatly improve the profit rate.
-
Using the price break back above the ATR range as a stop loss method can maximize risk control.
-
In a volatile market, the ATR range may be frequently penetrated, which easily leads to excessive invalid trades and wider losses.
-
The EMA as an indicator for judging trend direction has some lag. So it may miss opportunities for short-term price reversals.
-
The stop loss method is price break back above range, which can easily lead to widened losses due to sudden events.
-
Consider combining other indicators to determine trends and pullbacks to avoid EMA singular judgment errors. Such as MACD, KDJ, etc.
-
Consider adjusting ATR parameters in real time according to market volatility so that the ATR range is closer to the actual fluctuation.
-
Consider incorporating a moving stop loss method to continuously adjust the stop loss point to maximize the risk control of single losses.
The overall idea of this strategy is clear, using the ATR indicator to determine price breakthroughs and cooperating with EMA to determine direction, it can effectively follow trends; The stop loss method is straightforward and easy to operate. But at the same time, there are certain risks and large room for optimization that need further testing and adjustment. In general, this strategy is suitable for trend traders pursuing high win rates.
[/trans]
Strategy Arguments
| Argument | Default | Description |
|---|---|---|
| v_input_1 | 37 | Periods |
| v_input_2 | 0.2 | Range Multiplier |
| v_input_3 | 5000 | Take Profit |
| v_input_4 | 2500 | Stop Loss |
| v_input_5 | true | Lots to Trade |
Source (PineScript)
/*backtest
start: 2024-01-23 00:00:00
end: 2024-02-22 00:00:00
period: 3h
basePeriod: 15m
exchanges: [{"eid":"Futures_Binance","currency":"BTC_USDT"}]
*/

// This source code is subject to the terms of the Mozilla Public License 2.0 at https://mozilla.org/MPL/2.0/
// © cwagoner78
//@version=4
strategy("cATRpillar", overlay=true)
//------------

//inputs
lookback = input(title="Periods", type=input.integer, defval=37)
atrMult = input(title="Range Multiplier", type=input.float, defval=.2)
takeProfit = input(title="Take Profit", type=input.float, defval=5000)
stopLoss = input(title="Stop Loss", type=input.float, defval=2500)
lots = input(title="Lots to Trade", type=input.float, defval=1)
//------------

//indicators
atr=atr(lookback)*atrMult
sma=sma(close, lookback)
ema=ema(close,lookback*2)
rangeLo=sma-atr
rangeHi=sma+atr
//------------

//draw objects
p0 =plot(close, title="Close", color=#26A69A, linewidth=0, transp=80,style=plot.style_stepline)
p1 =plot(rangeHi, title="High", color=color.fuchsia, linewidth=0, transp=80,style=plot.style_stepline)
p2 =plot(rangeLo, title="Low", color=color.lime, linewidth=0, transp=80,style=plot.style_stepline)
p3 =plot(ema, title="EMA", color=color.white, linewidth=0, transp=80, style=plot.style_stepline)
fill(p1, p0, color=color.fuchsia)
fill(p0, p2, color=color.lime)
//------------

//Trading
atrShort=open[1] > rangeHi and open < rangeLo
atrLong=open[1] < rangeLo and open > rangeHi
exitLong=open>rangeLo
exitShort=open<rangeHi

//Long
longCondition=atrLong and open>ema+atr
strategy.entry(id="cATRpillar-Buy", long=true, when=longCondition)
longCloseCondition=exitLong
strategy.exit(id="cATRpillar-Exit", qty=lots, profit=takeProfit, loss=stopLoss, when=longCloseCondition)

//Short
shortCondition=atrShort and open<ema-atr
strategy.entry(id="cATRpillar-Sell", long=false, when=shortCondition)
shortCloseCondition=exitShort
strategy.exit(id="cATRpillar-Exit",  qty=lots, profit=takeProfit, loss=stopLoss, when=shortCloseCondition)

plotshape(shortCondition,  title= "Short", location=location.belowbar, color=color.fuchsia, transp=80, style=shape.triangledown, size=size.tiny)
plotshape(longCondition,  title= "Long", location=location.abovebar, color=color.lime, transp=80, style=shape.triangleup, size=size.tiny)
//------------
Detail
https://www.fmz.com/strategy/442644
Last Modified
2024-02-23 14:34:24
