Name
基于金叉死叉交易策略Golden-Cross-Dead-Cross-Trading-Strategy
Author
ChaoZhang
Strategy Description
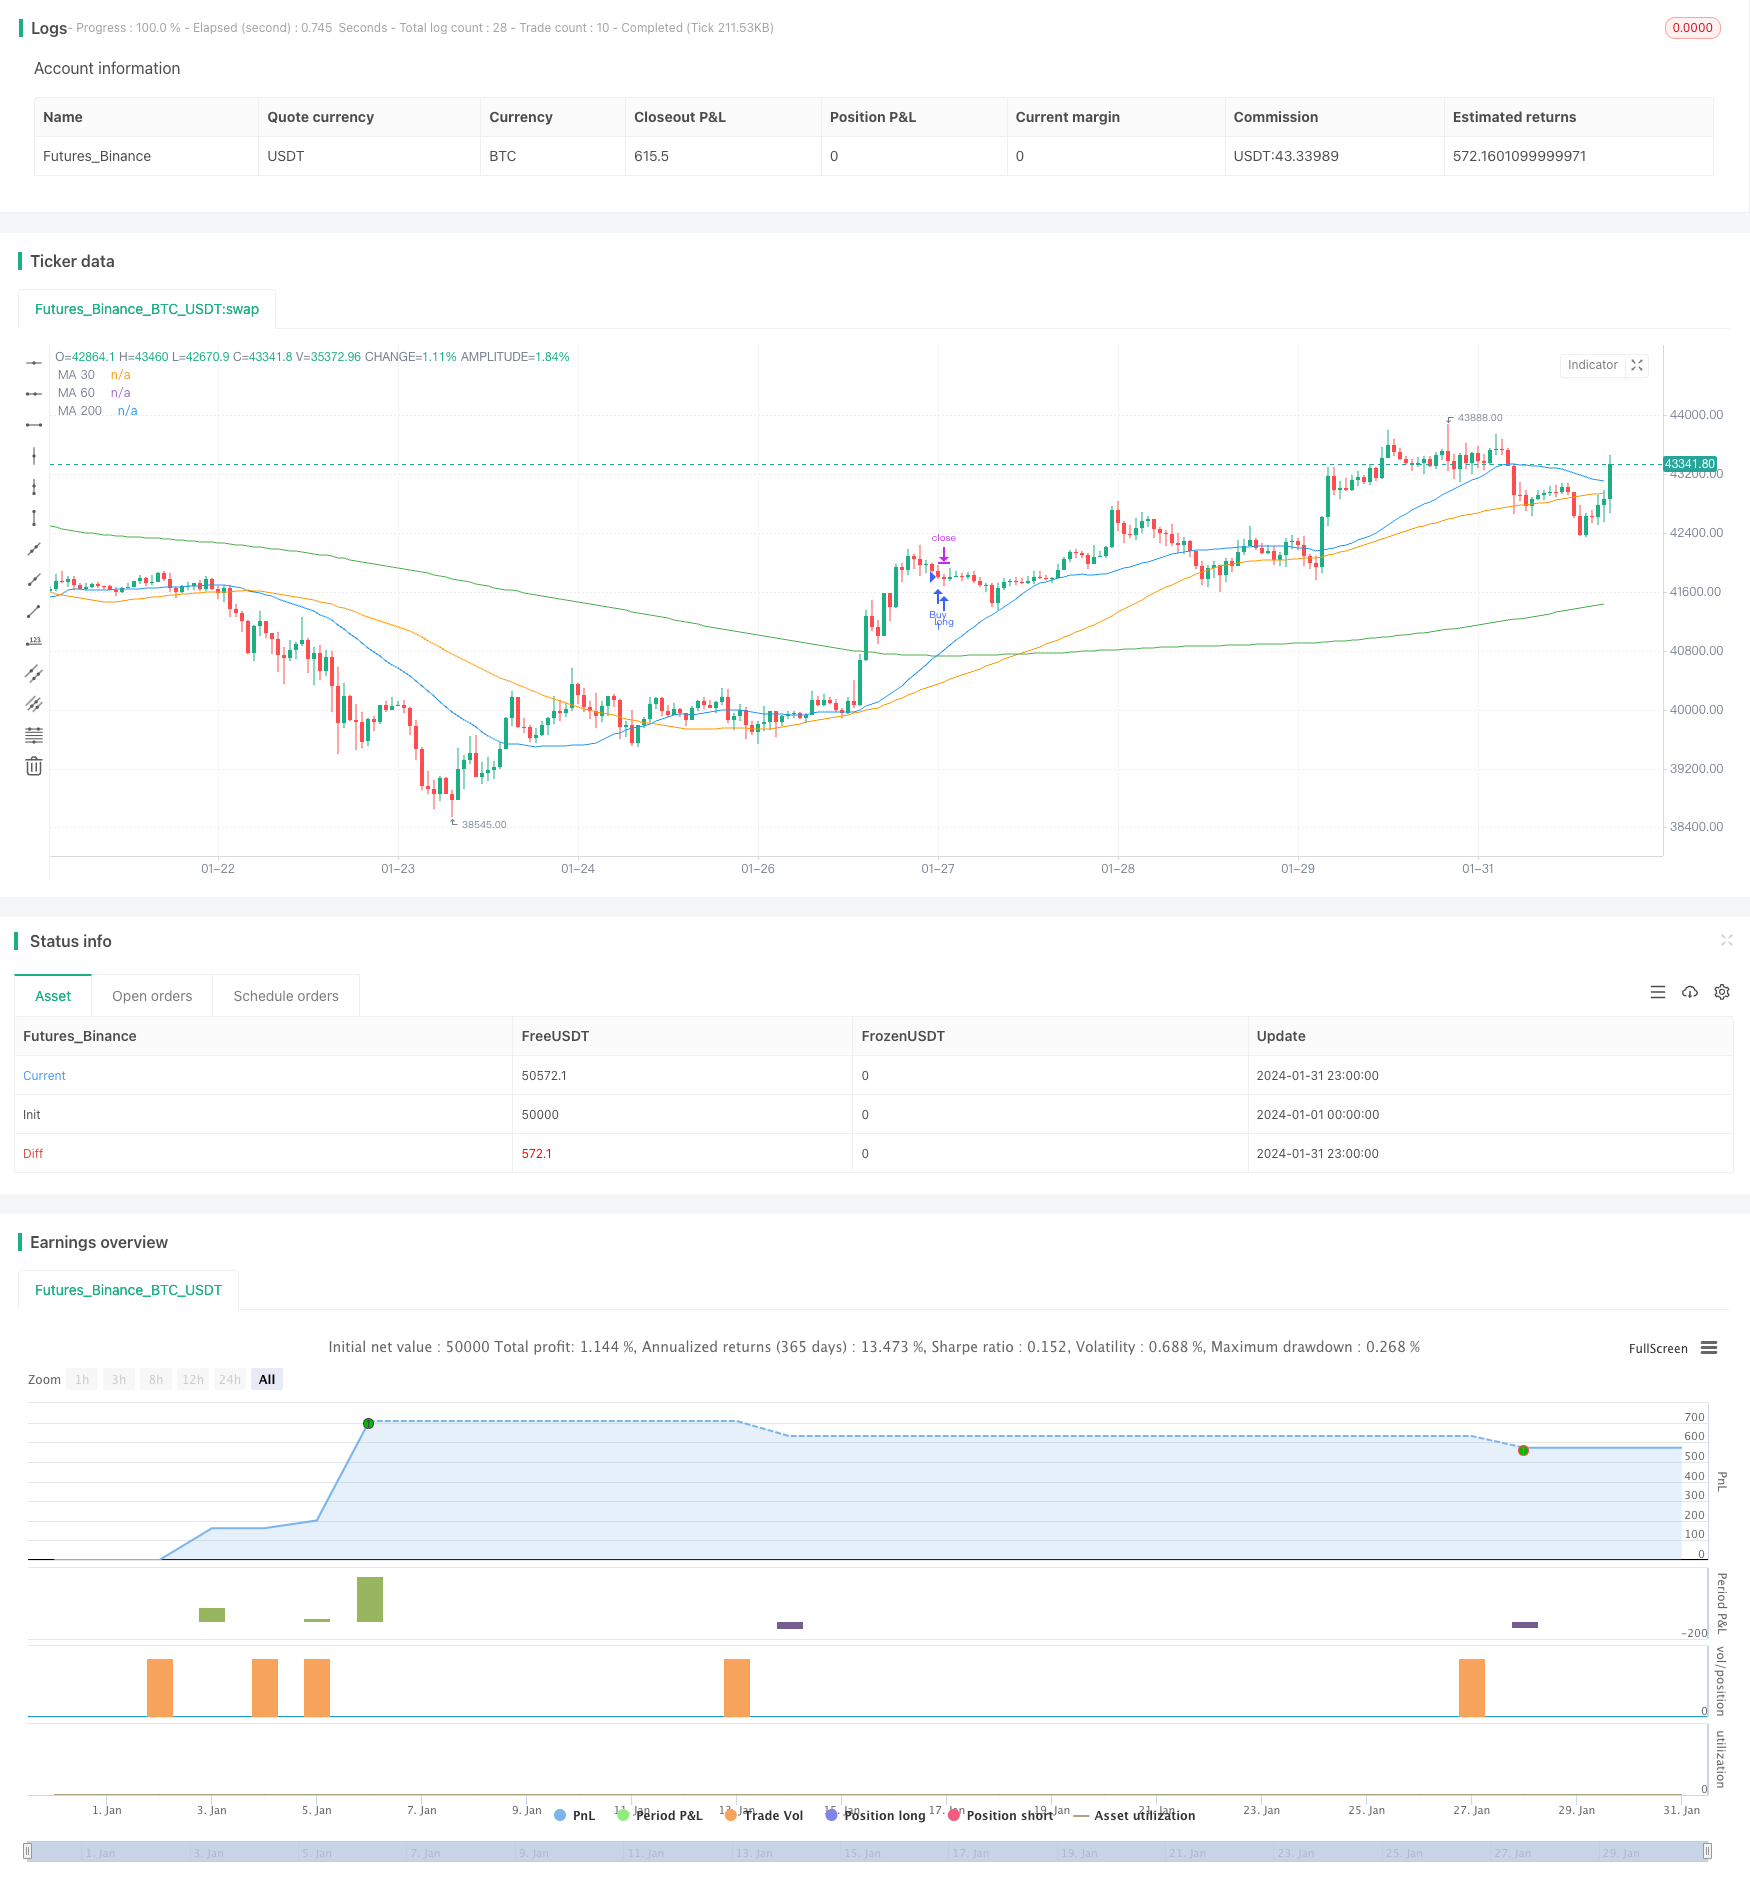
本策略基于30日、60日和200日简单移动平均线的金叉和死叉形成交易信号。当短期移动平均线上穿长期移动平均线时,形成买入信号;当短期移动平均线下穿长期移动平均线时,形成卖出信号。该策略结合了趋势跟踪和均线交叉的优点,既可以抓住长期趋势,也可以在趋势转折点形成交易信号。
本策略使用3条不同周期的简单移动平均线:30日线、60日线和200日线。其中,30日线代表短期趋势,200日线代表长期趋势,60日线作为中间参考。当短期趋势线上穿长期趋势线时,表示行情由盘整转为上涨,产生买入信号;当短期趋势下穿长期趋势线时,表示行情趋势由上涨转为盘整,产生卖出信号。
该策略同时结合了止损和止盈点来控制风险。在买入后设置了40点的止损空间,以控制亏损;同时设置了40点的止盈空间以锁定 profit。
本策略具有以下优势:
-
结合趋势跟踪和瞬时信号的优点,既考虑了长期趋势判断,又SETS短期买卖点。
-
均线交叉 timesteps 明确,不易产生多次重复信号。
-
止损止盈设置合理,可以有效控制单笔亏损。
-
策略逻辑简单清晰,容易理解和实现。
-
移动平均线技术成熟稳定,应用广泛。
本策略也存在一些风险:
-
短期止损可能被击穿,无法完全避免亏损。
-
金叉死叉信号可能出现假突破。
-
大盘震荡时,止损止盈难以设置合理。
-
参数設置如周期选择存在主观性,可能影响策略表现。
本策略可以从以下几个方面进行优化:
-
创新止损机制,采用像跟踪止损、指数移动止损等动态止损方式,降低亏损风险。
-
优化参数选择,如测试更多周期参数的优劣,寻找最优参数组合。
-
增加仓位管理机制,通过资金管理优化整体 profit。
-
结合 momentum 指标等过滤假突破。
-
增加机器学习算法,利用大データ训练出更优规则。
本文详细介绍了基于均线金叉死叉的交易策略。该策略以 30、60、200 日移动平均线交叉作为交易信号,兼顾趋势跟踪和瞬时点选时定位。止损止盈设置合理,可以有效控制单笔亏损。但也存在被套、假突破等风险。我们可以从改进止损方式、参数优化、资金管理等多方面进行策略增强和优化,使得策略更加稳定profit。
||
This strategy generates trading signals based on the golden cross and dead cross of the 30-day, 60-day and 200-day simple moving averages. When the short-term moving average crosses over the long-term moving average, a buy signal is generated. When the short-term moving average crosses below the long-term moving average, a sell signal is generated. The strategy combines the advantages of trend following and moving average crossovers, capturing both long-term trends and turning points.
The strategy employs 3 simple moving averages with different timespans: 30-day, 60-day and 200-day. The 30-day line represents short-term trend, the 200-day line represents long-term trend, and the 60-day line serves as a reference. When the short-term trend line crosses over the long-term trend line, it indicates the market is shifting from consolidation to uptrend and generates a buy signal. When the short-term trend line crosses below the long-term trend line, it indicates the uptrend is shifting to consolidation and produces a sell signal.
The strategy also sets a 40-point stop-loss to control risks and a 40-point take-profit to lock in gains after entering a position.
The advantages of this strategy include:
-
Combines the merits of trend following and instant signals, considering both long-term trends and short-term trading points.
-
Crossover signals are clear, avoiding excessive repeated signals.
-
Reasonable stop-loss and take-profit setups effectively control per trade loss.
-
Simple and clear logic, easy to understand and implement.
-
Mature and stable moving average techniques with widespread application.
Some risks also exist:
-
Short-term stop-loss may be penetrated, unable to completely avoid losses.
-
Golden cross and dead cross signals can turn out to be false breakouts.
-
Difficult to set reasonable stop-loss and take-profit during market consolidation.
-
Parameter selection like period settings contain subjectivity that may impact strategy performance.
The strategy can be enhanced and optimized from the following aspects:
-
Improve stop-loss mechanisms using trailing stop loss, smoothed rate of change index etc. to lower risk exposure.
-
Optimize parameter selections by testing more periods and finding optimal period combinations.
-
Add position sizing rules to optimize overall profitability through capital management.
-
Filter out false breakouts incorporating momentum indicators.
-
Increase use of machine learning models and big data to find superior tactics.
In summary, this article introduces a trading strategy based on moving average golden crosses and death crosses. It takes the crossovers of 30-day, 60-day and 200-day moving averages as trading signals, combines trend following and timing selection. Reasonable stop-loss and take-profit setups effectively control per trade loss. But risks like whipsaws and false breakouts remain. We can enhance the strategy from multiple aspects like improving stop-loss methods, parameter optimization, capital management to make it more stable and profitable.
[/trans]
Source (PineScript)
/*backtest
start: 2024-01-01 00:00:00
end: 2024-01-31 23:59:59
period: 1h
basePeriod: 15m
exchanges: [{"eid":"Futures_Binance","currency":"BTC_USDT"}]
*/

//@version=5
strategy("Estrategia de Cruce de Medias Móviles", overlay=true)

// Medias móviles
ma30 = ta.sma(close, 30)
ma60 = ta.sma(close, 60)
ma200 = ta.sma(close, 200)

// Cruce de medias móviles
crossoverUp = ta.crossover(ma30, ma200)
crossoverDown = ta.crossunder(ma30, ma200)

// Señales de compra y venta
longCondition = crossoverUp
shortCondition = crossoverDown

// Ejecución de órdenes
if (longCondition)
    strategy.entry("Buy", strategy.long)
    strategy.exit("Cover", "Buy", stop=close - 40.000, limit=close + 40.000)
if (shortCondition)
    strategy.entry("Sell", strategy.short)
    strategy.exit("Cover", "Sell", stop=close + 40.000, limit=close - 40.000)

// Plot de las medias móviles
plot(ma30, color=color.blue, title="MA 30")
plot(ma60, color=color.orange, title="MA 60")
plot(ma200, color=color.green, title="MA 200")

// Condiciones para cerrar la posición contraria
if (strategy.position_size > 0)
    if (crossoverDown)
        strategy.close("Buy")
if (strategy.position_size < 0)
    if (crossoverUp)
        strategy.close("Sell")
Detail
https://www.fmz.com/strategy/442336
Last Modified
2024-02-21 11:09:08
