Name
基于移动平均线交叉交易策略Moving-Average-Crossover-Strategy
Author
ChaoZhang
Strategy Description
移动平均线交叉策略是一种比较常见的股票交易策略。该策略通过计算快速移动平均线和慢速移动平均线,并在它们交叉时产生买入和卖出信号。具体来说,当快速移动平均线从下方上穿慢速移动平均线时,产生买入信号;当快速移动平均线从上方下穿慢速移动平均线时,产生卖出信号。
该策略的核心逻辑是:快速移动平均线代表股票的短期趋势,慢速移动平均线代表股票的长期趋势。当短期趋势转为上升(金叉),说明股票进入买入区间;当短期趋势转为下降(死叉),说明股票进入卖出区间。
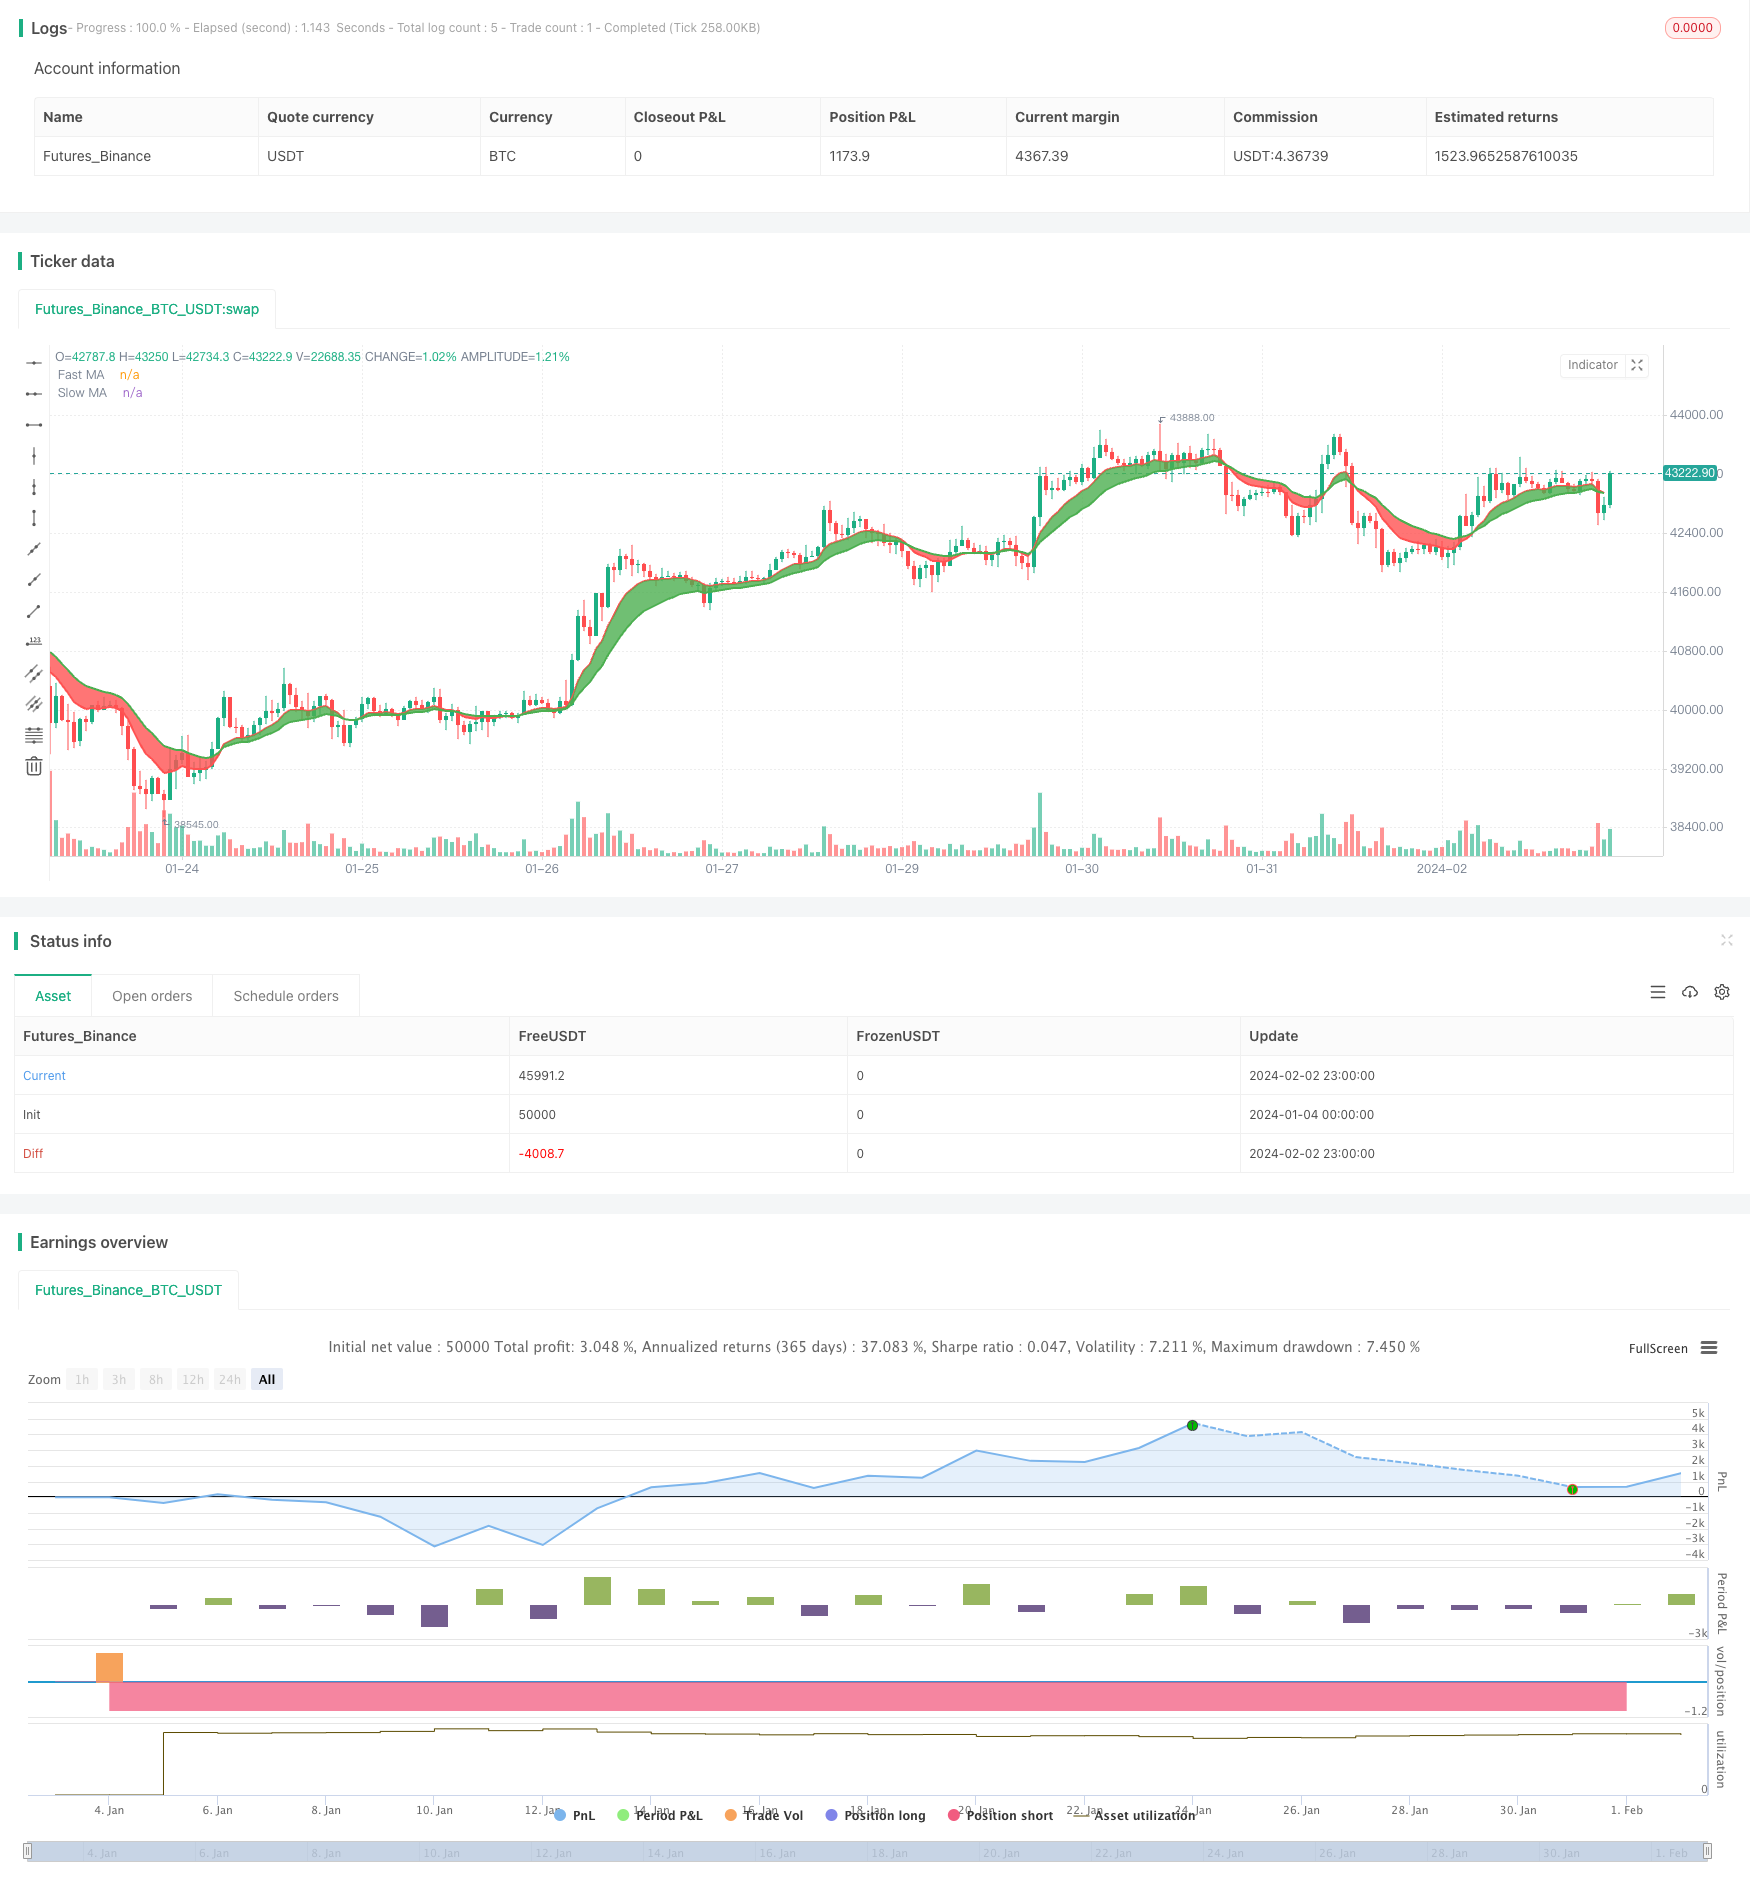
具体来看,该策略中定义了快速移动平均maFast和慢速移动平均maSlow。maFast长度为9,代表股票9天的短期趋势;maSlow长度为18,代表股票18天的长期趋势。策略通过计算两个移动平均线的交叉情况来判断短期和长期趋势的变化。当maFast上穿maSlow时,产生买入信号;当maFast下穿maSlow时,产生卖出信号。
该策略具有以下优势:
- 原理简单易懂,容易理解和实现。
- 移动平均线能有效滤去股票价格的噪音,产生较为可靠的交易信号。
- 快慢移动平均线结合短长期趋势,交易信号比较稳定。
- 可灵活调整移动平均线参数,适应不同股票的特性。
- 可通过优化移动平均线周期参数来获得更好的交易效果。
该策略也存在一些风险:
- 当股票价格波动较大时,会产生更多错误信号和过多交易。
- 参数设置不当会导致交易频率过高或信号延迟。
- 无法有效跟踪快速变化的市场和个股。
- 存在一定的时间滞后,可能错过关键的买入卖出点位。
可以通过调整移动平均线参数、设置停损策略等方法来降低上述风险。
该策略还有进一步优化的空间:
- 结合其他技术指标过滤信号,例如交易量,STOCH等。
- 增加趋势判断机制,避免错失主要趋势。
- 优化移动平均线参数,找到最佳参数组合。
- 设置止损策略,控制单笔损失。
- 结合深度学习等模型预测价格走势。
移动平均线交叉策略整体来说是一个非常经典和实用的策略。它原理简单,容易实现,在实际交易中应用广泛。通过参数调优和辅助技术指标的应用,可以进一步改进该策略,获得更好的风险收益比。总的来说,该策略是量化交易的一个重要基石,值得深入研究和应用。
||
The moving average crossover strategy is a common stock trading strategy. It generates buying and selling signals by calculating fast and slow moving averages and detecting their crossover points. Specifically, when the fast moving average crosses above the slow moving average from below, it generates a buy signal; when the fast moving average crosses below the slow moving average from above, it generates a sell signal.
The core logic of this strategy is: the fast moving average represents the short-term trend of a stock, while the slow moving average represents its long-term trend. When the short-term trend turns upward (golden cross), it indicates the stock may enter a buy zone; when the short-term trend turns downward (death cross), it indicates the stock may enter a sell zone.
In this strategy, the fast moving average maFast and slow moving average maSlow are defined. maFast has a period of 9 representing the 9-day short-term trend of a stock. maSlow has a period of 18 representing the 18-day long-term trend. The strategy detects their crossover to determine changes in short-term and long-term trends. It generates a buy signal when maFast crosses above maSlow, and a sell signal when maFast crosses below maSlow.
The advantages of this strategy are:
- Its logic is simple and easy to understand and implement.
- Moving averages can filter out price noises effectively and generate reliable trading signals.
- The fast and slow MAs combine short-term and long-term trends, making the signals stable.
- The MA parameters can be adjusted flexibly to adapt to different stocks.
- Further optimizations on the MA period parameters can lead to better trading performance.
There are also some risks with this strategy:
- More incorrect signals and excessive trading can happen when price fluctuation is high.
- Improper parameter settings may cause too frequent trading or signal delay.
- It cannot track rapidly changing market and individual stocks effectively.
- There can be some time lag, which may cause missing important entry or exit spots.
These risks can be reduced by adjusting MA parameters, setting stop loss strategies etc.
There are further optimization spaces for this strategy:
- Combine other technical indicators to filter signals, e.g. trading volume, STOCH.
- Add trend determination mechanism to avoid missing major trends.
- Optimize MA parameters to find the best combination.
- Set stop loss strategies to control single trade loss.
- Incorporate deep learning models to predict price movements.
In conclusion, the moving average crossover strategy is a very classic and practical strategy overall. It has simple logic and wide applications in actual trading. By parameter tuning and combining other technical indicators, it can be further improved to achieve better risk-reward ratios. In general, it is an important cornerstone of quantitative trading and deserves in-depth research and application.
[/trans]
Strategy Arguments
| Argument | Default | Description |
|---|---|---|
| v_input_1_close | 0 | Fast MA Source: close |
| v_input_2 | 9 | Fast MA Period |
| v_input_3_close | 0 | Slow MA Source: close |
| v_input_4 | 18 | Slow MA Period |
Source (PineScript)
/*backtest
start: 2024-01-04 00:00:00
end: 2024-02-03 00:00:00
period: 1h
basePeriod: 15m
exchanges: [{"eid":"Futures_Binance","currency":"BTC_USDT"}]
*/

//@version=3
strategy(title="Moving Average Cross", overlay=true, initial_capital=10000, currency='USD')


// === GENERAL INPUTS ===
// short ma
maFastSource   = input(defval = close, title = "Fast MA Source")
maFastLength   = input(defval = 9, title = "Fast MA Period", minval = 1)
// long ma
maSlowSource   = input(defval = close, title = "Slow MA Source")
maSlowLength   = input(defval = 18, title = "Slow MA Period", minval = 1)


// === SERIES SETUP ===
/// a couple of ma's..
maFast = ema(maFastSource, maFastLength)
maSlow = ema(maSlowSource, maSlowLength)


// === PLOTTING ===
fast = plot(maFast, title = "Fast MA", color = red, linewidth = 2, style = line, transp = 30)
slow = plot(maSlow, title = "Slow MA", color = green, linewidth = 2, style = line, transp = 30)


// === LOGIC ===
enterLong = crossover(maFast, maSlow)
exitLong = crossover(maSlow, maFast)


// Entry //
strategy.entry(id="Long Entry", long=true, when=enterLong)
strategy.entry(id="Short Entry", long=false, when=exitLong)


// === FILL ====

fill(fast, slow, color = maFast > maSlow ? green : red)
Detail
https://www.fmz.com/strategy/441002
Last Modified
2024-02-04 16:00:31