Name
基于相对动量策略The-relative-momentum-strategy
Author
ChaoZhang
Strategy Description
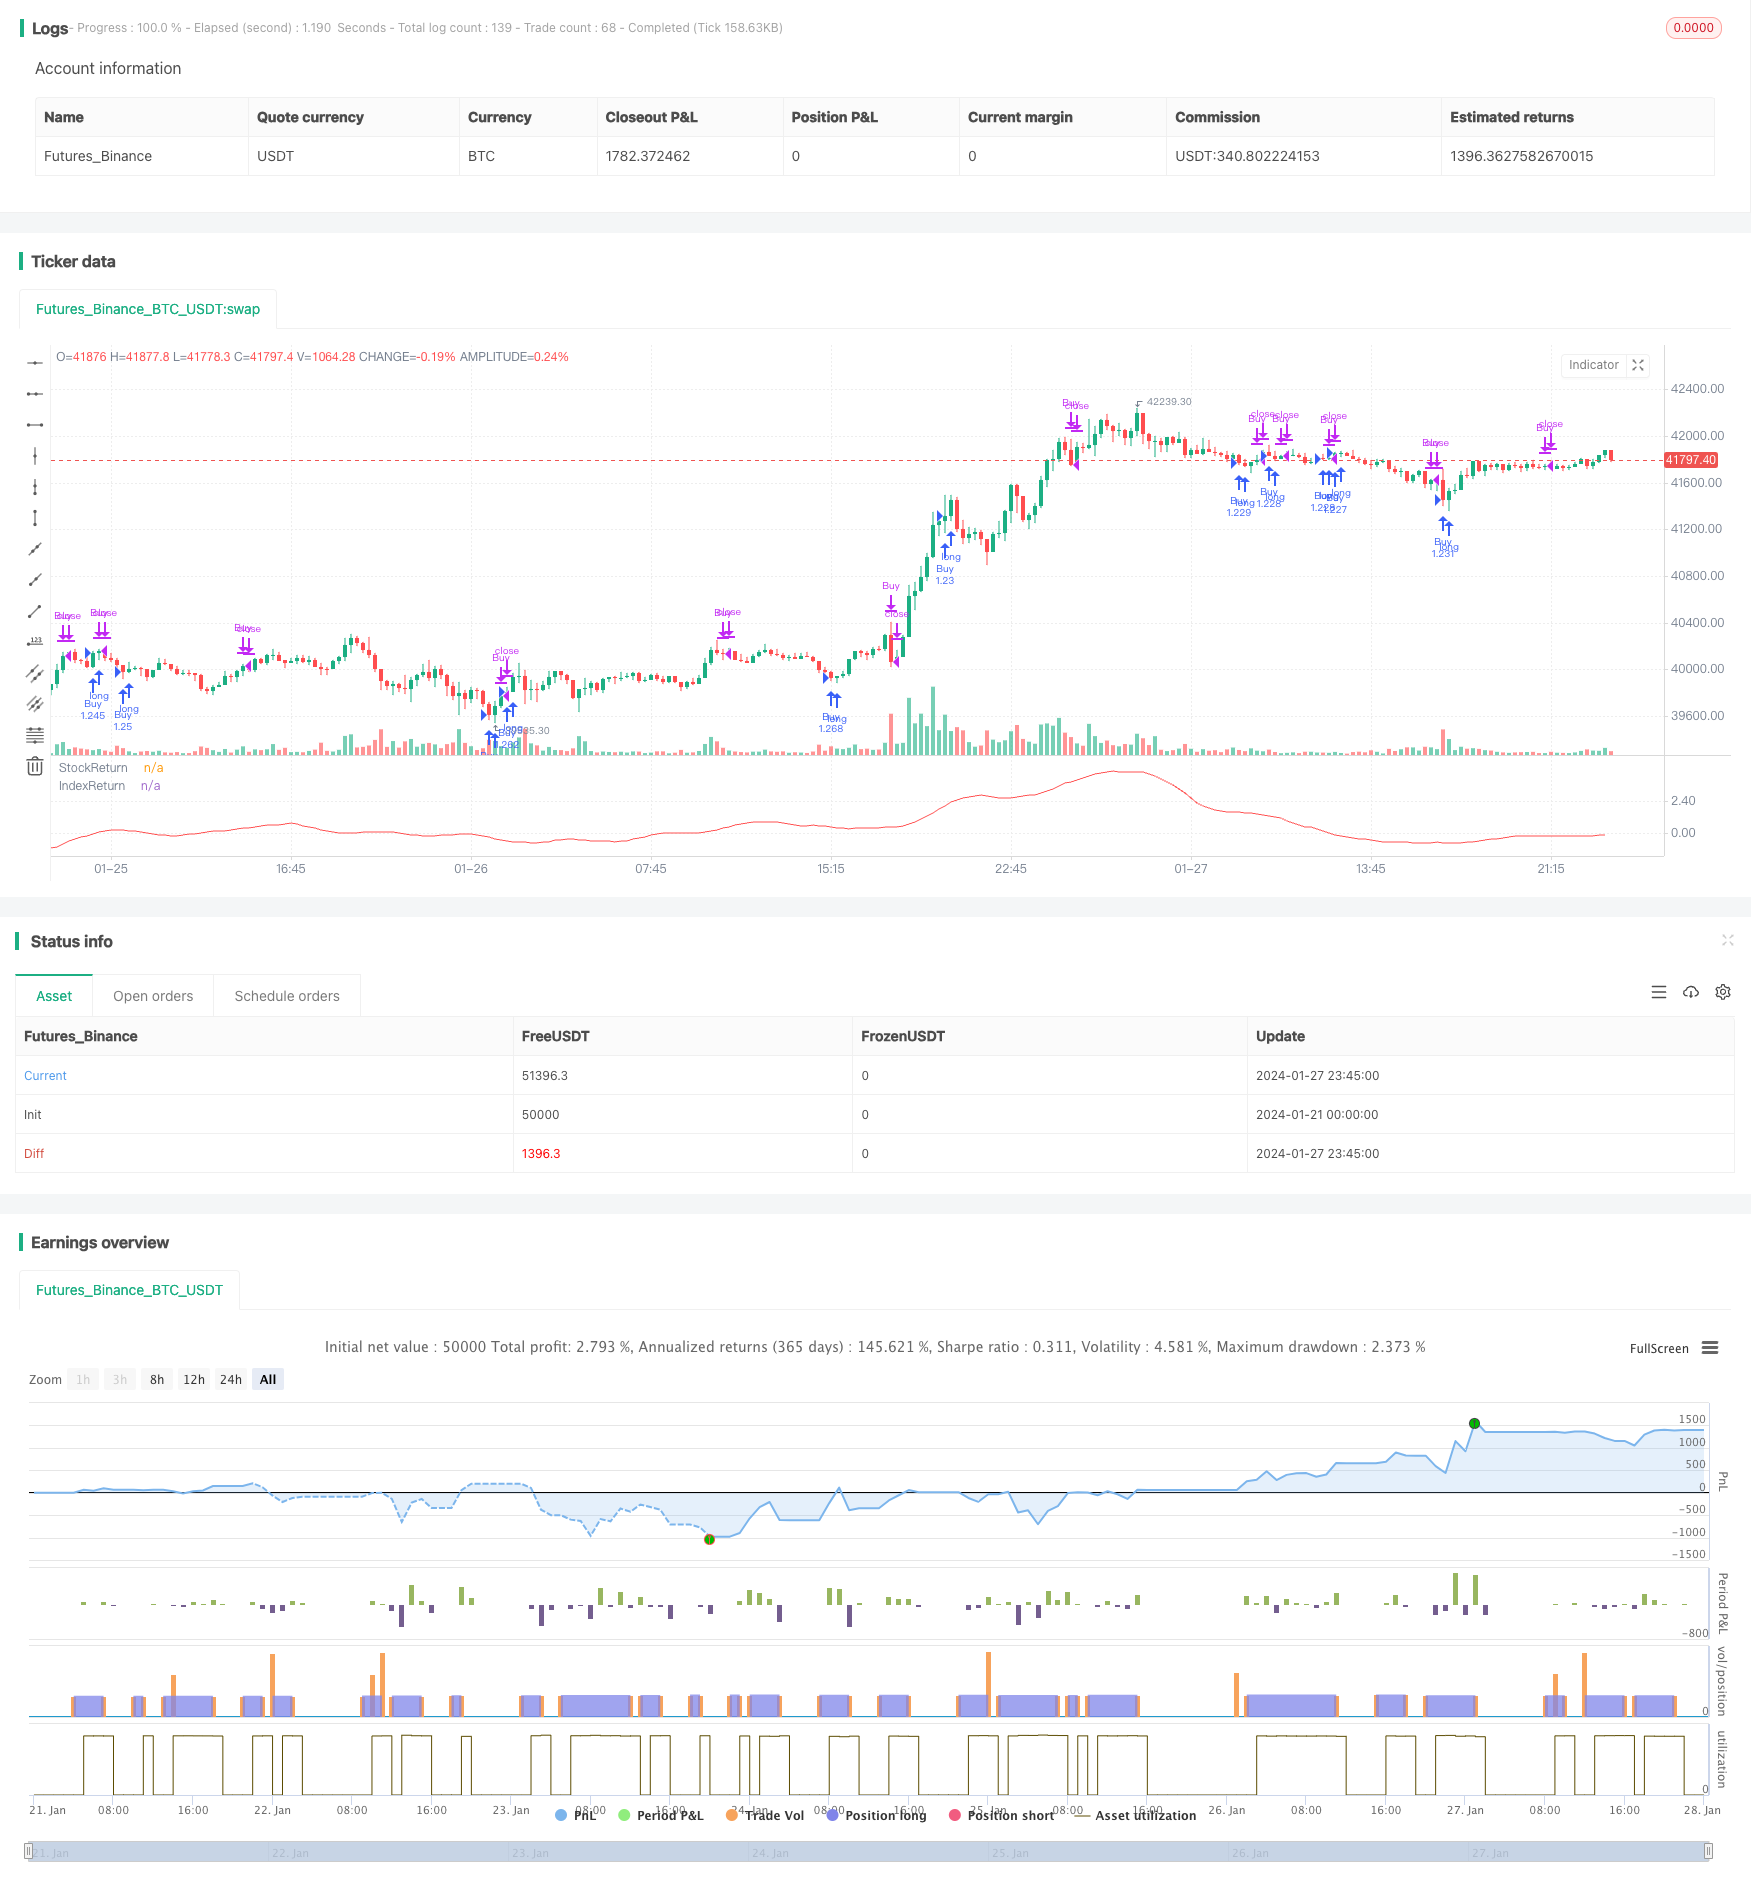
相对动量策略通过比较个股和指数的动量,来判断个股相对于大盘的强弱,当个股的动量高于大盘时买入,个股动量低于大盘时卖出,以捕捉个股的增长高峰。
该策略主要判断个股相对大盘的强弱,具体逻辑是:
- 计算个股在某段时间内的收益率作为个股动量
- 计算指数在同一段时间内的收益率作为指数动量
- 将个股动量和指数动量计算移动平均线平滑处理
- 当个股动量的移动平均线上穿指数动量的移动平均线时,认为个股动量强于指数整体,成为买入信号
- 当个股动量的移动平均线下穿指数动量的移动平均线时,认为个股动量弱于指数整体,成为卖出信号
通过这样的逻辑判断,我们可以买入个股增长旺盛的时期,并在其增长动力消退时及时卖出,锁定其增长高峰期的超额收益。
相对动量策略主要具有以下优势:
- 可动态捕捉个股增长高峰,无需关心具体行情,只要个股增长快于大盘即可买入
- 通过移动平均线处理,可过滤掉短期波动的干扰,增强信号的可靠性
- 简单直接的买入卖出条件,容易理解操作
- 可自由设定计算相对动量的时间参数,优化策略
相对动量策略也存在一定的风险:
- 个股增长高峰结束后可能出现回调调整,存在止盈不足的风险
- 相对动量指标可能产生错误信号,识别的增长高峰并非真实高峰
- 需设置止损来控制最大亏损
这些风险可以通过合理止盈止损、适当调整参数等方法来控制。
相对动量策略可从以下几个方面进行优化:
- 测试不同的动量计算时间参数,找到最佳参数
- 测试不同类型和长度的移动平均线,寻找最优参数
- 加入成交量指标过滤,避免量能不足的假突破
- 结合其他技术指标确认买入时机
相对动量策略通过捕捉个股相对大盘的增长高峰,可有效获取超额收益。该策略具有简单清晰的买入卖出逻辑、易于操作的优点,通过参数优化和风险控制,可获得较好的效果。
||
The relative momentum strategy compares the momentum of individual stocks and indexes to judge the relative strength of stocks to the broader market. It buys when the stock momentum is higher than that of the index, and sells when the stock momentum is lower than that of the index, in order to capture the growth peak of individual stocks.
The core logic of this strategy is to judge the relative strength of individual stocks versus the market, specifically:
- Calculate the return over a period of time as the momentum of the stock
- Calculate index return over the same period as the index momentum
- Use moving average to smooth the stock and index momentum
- When the moving average of stock momentum crosses above that of the index, the stock momentum is considered stronger than the market overall - that is the buy signal
- When the stock momentum moving average crosses below the index momentum moving average, the stock momentum is considered weaker, triggering the sell signal
Through this logic, we can buy into stocks when their growth is thriving and sell out as the growth momentum fades, locking in excess returns during the growth peak period of stocks.
The main advantages of the relative momentum strategy:
- Can dynamically capture the growth peak of stocks without concerning specific market conditions - just buy when the stock growth outpaces the overall market
- Smoothing with moving averages filters out short-term fluctuations and enhances signal reliability
- Simple direct buy and sell conditions, easy to understand and operate
- Flexibility to configure the time period for calculating relative momentum and optimize
There are also some risks with the relative momentum strategy:
- Stocks may pullback after growth peak ends, posing insufficient profit-taking risk
- Relative momentum signals can be false, identifying a fake instead of real peak
- Need to set stop loss to control maximum loss
These risks can be managed by reasonable profit-taking, stop losses, parameter tuning etc.
The relative momentum strategy can be optimized mainly from the following aspects:
- Test different time periods for computing momentum to find optimum
- Try out different types and lengths of moving averages for best parameters
- Add volume filter to avoid false breakouts due to lack of momentum
- Incorporate other indicators to confirm optimal entry timing
The relative momentum strategy captures the excess growth phases of individual stocks versus the overall market to generate alpha. With its simple, clear buy/sell logic and ease of operation, and when coupled with parameter optimization and risk control, this strategy can perform very well.
[/trans]
Strategy Arguments
| Argument | Default | Description |
|---|---|---|
| v_input_1 | BTC_USDT:swap | index_ticker |
| v_input_2 | 40 | Loopback |
| v_input_3 | true | useStopAndIndexReturns |
| v_input_4 | true | useStopAndIndexReturnsMa |
| v_input_5 | 0 | Moving Average Type: sma |
| v_input_6 | 10 | MALength |
| v_input_7 | timestamp(01 Jan 2010 00:00 +0000) | Backtest Start Time |
| v_input_8 | timestamp(01 Jan 2099 00:00 +0000) | Backtest End Time |
Source (PineScript)
/*backtest
start: 2024-01-21 00:00:00
end: 2024-01-28 00:00:00
period: 15m
basePeriod: 5m
exchanges: [{"eid":"Futures_Binance","currency":"BTC_USDT"}]
*/

// This source code is subject to the terms of the Mozilla Public License 2.0 at https://mozilla.org/MPL/2.0/
// © HeWhoMustNotBeNamed

//@version=4
strategy("Relative Returns Strategy", overlay=false, initial_capital = 100000, default_qty_type = strategy.percent_of_equity, default_qty_value = 100, commission_type = strategy.commission.percent, pyramiding = 1, commission_value = 0.01, calc_on_order_fills = true)

index_ticker=input("BTC_USDT:swap")
Loopback = input(40, step=20)
useStopAndIndexReturns = input(true)
useStopAndIndexReturnsMa = input(true)

useDifference = not useStopAndIndexReturns

MAType = input(title="Moving Average Type", defval="sma", options=["ema", "sma", "hma", "rma", "vwma", "wma"])
MALength = input(10, minval=10,step=10)

i_startTime = input(defval = timestamp("01 Jan 2010 00:00 +0000"), title = "Backtest Start Time", type = input.time)
i_endTime = input(defval = timestamp("01 Jan 2099 00:00 +0000"), title = "Backtest End Time", type = input.time)
inDateRange = true

f_secureSecurity(_symbol, _res, _src, _offset) => security(_symbol, _res, _src[_offset], lookahead = barmerge.lookahead_on)
f_getMovingAverage(source, MAType, length)=>
    ma = sma(source, length)
    if(MAType == "ema")
        ma := ema(source,length)
    if(MAType == "hma")
        ma := hma(source,length)
    if(MAType == "rma")
        ma := rma(source,length)
    if(MAType == "vwma")
        ma := vwma(source,length)
    if(MAType == "wma")
        ma := wma(source,length)
    ma

index = f_secureSecurity(index_ticker, '1D', close, 0)
stock_return = (close - close[Loopback])*100/close
index_return = (index - index[Loopback])*100/index

stock_return_ma = f_getMovingAverage(stock_return, MAType, MALength)
index_return_ma = f_getMovingAverage(index_return, MAType, MALength)
relativeReturns = stock_return - index_return
relativeReturns_ma = f_getMovingAverage(relativeReturns, MAType, MALength)

plot(useStopAndIndexReturns ? useStopAndIndexReturnsMa ? stock_return_ma : stock_return : na, title="StockReturn", color=color.green, linewidth=1)
plot(useStopAndIndexReturns ? useStopAndIndexReturnsMa ? index_return_ma : index_return : na, title="IndexReturn", color=color.red, linewidth=1)

plot(useDifference?relativeReturns:na, title="Relative-Returns", color=color.blue, linewidth=1)
plot(useDifference?relativeReturns_ma:na, title="MA", color=color.red, linewidth=1)

buyCondition = (useStopAndIndexReturns ? useStopAndIndexReturnsMa ? stock_return_ma > index_return_ma : stock_return > index_return : relativeReturns > relativeReturns_ma)
closeBuyCondition = (useStopAndIndexReturns ? useStopAndIndexReturnsMa ? stock_return_ma < index_return_ma : stock_return < index_return : relativeReturns < relativeReturns_ma)
strategy.entry("Buy", strategy.long, when=buyCondition and inDateRange, oca_name="oca")
strategy.close("Buy", when=closeBuyCondition)
Detail
https://www.fmz.com/strategy/440286
Last Modified
2024-01-29 08:38:04
