Name
基于枢轴点和斐波那契回撤的自动趋势追踪策略Pivot-Point-and-Fibonacci-Retracement-Based-Automatic-Trend-Following-Strategy
Author
ChaoZhang
Strategy Description
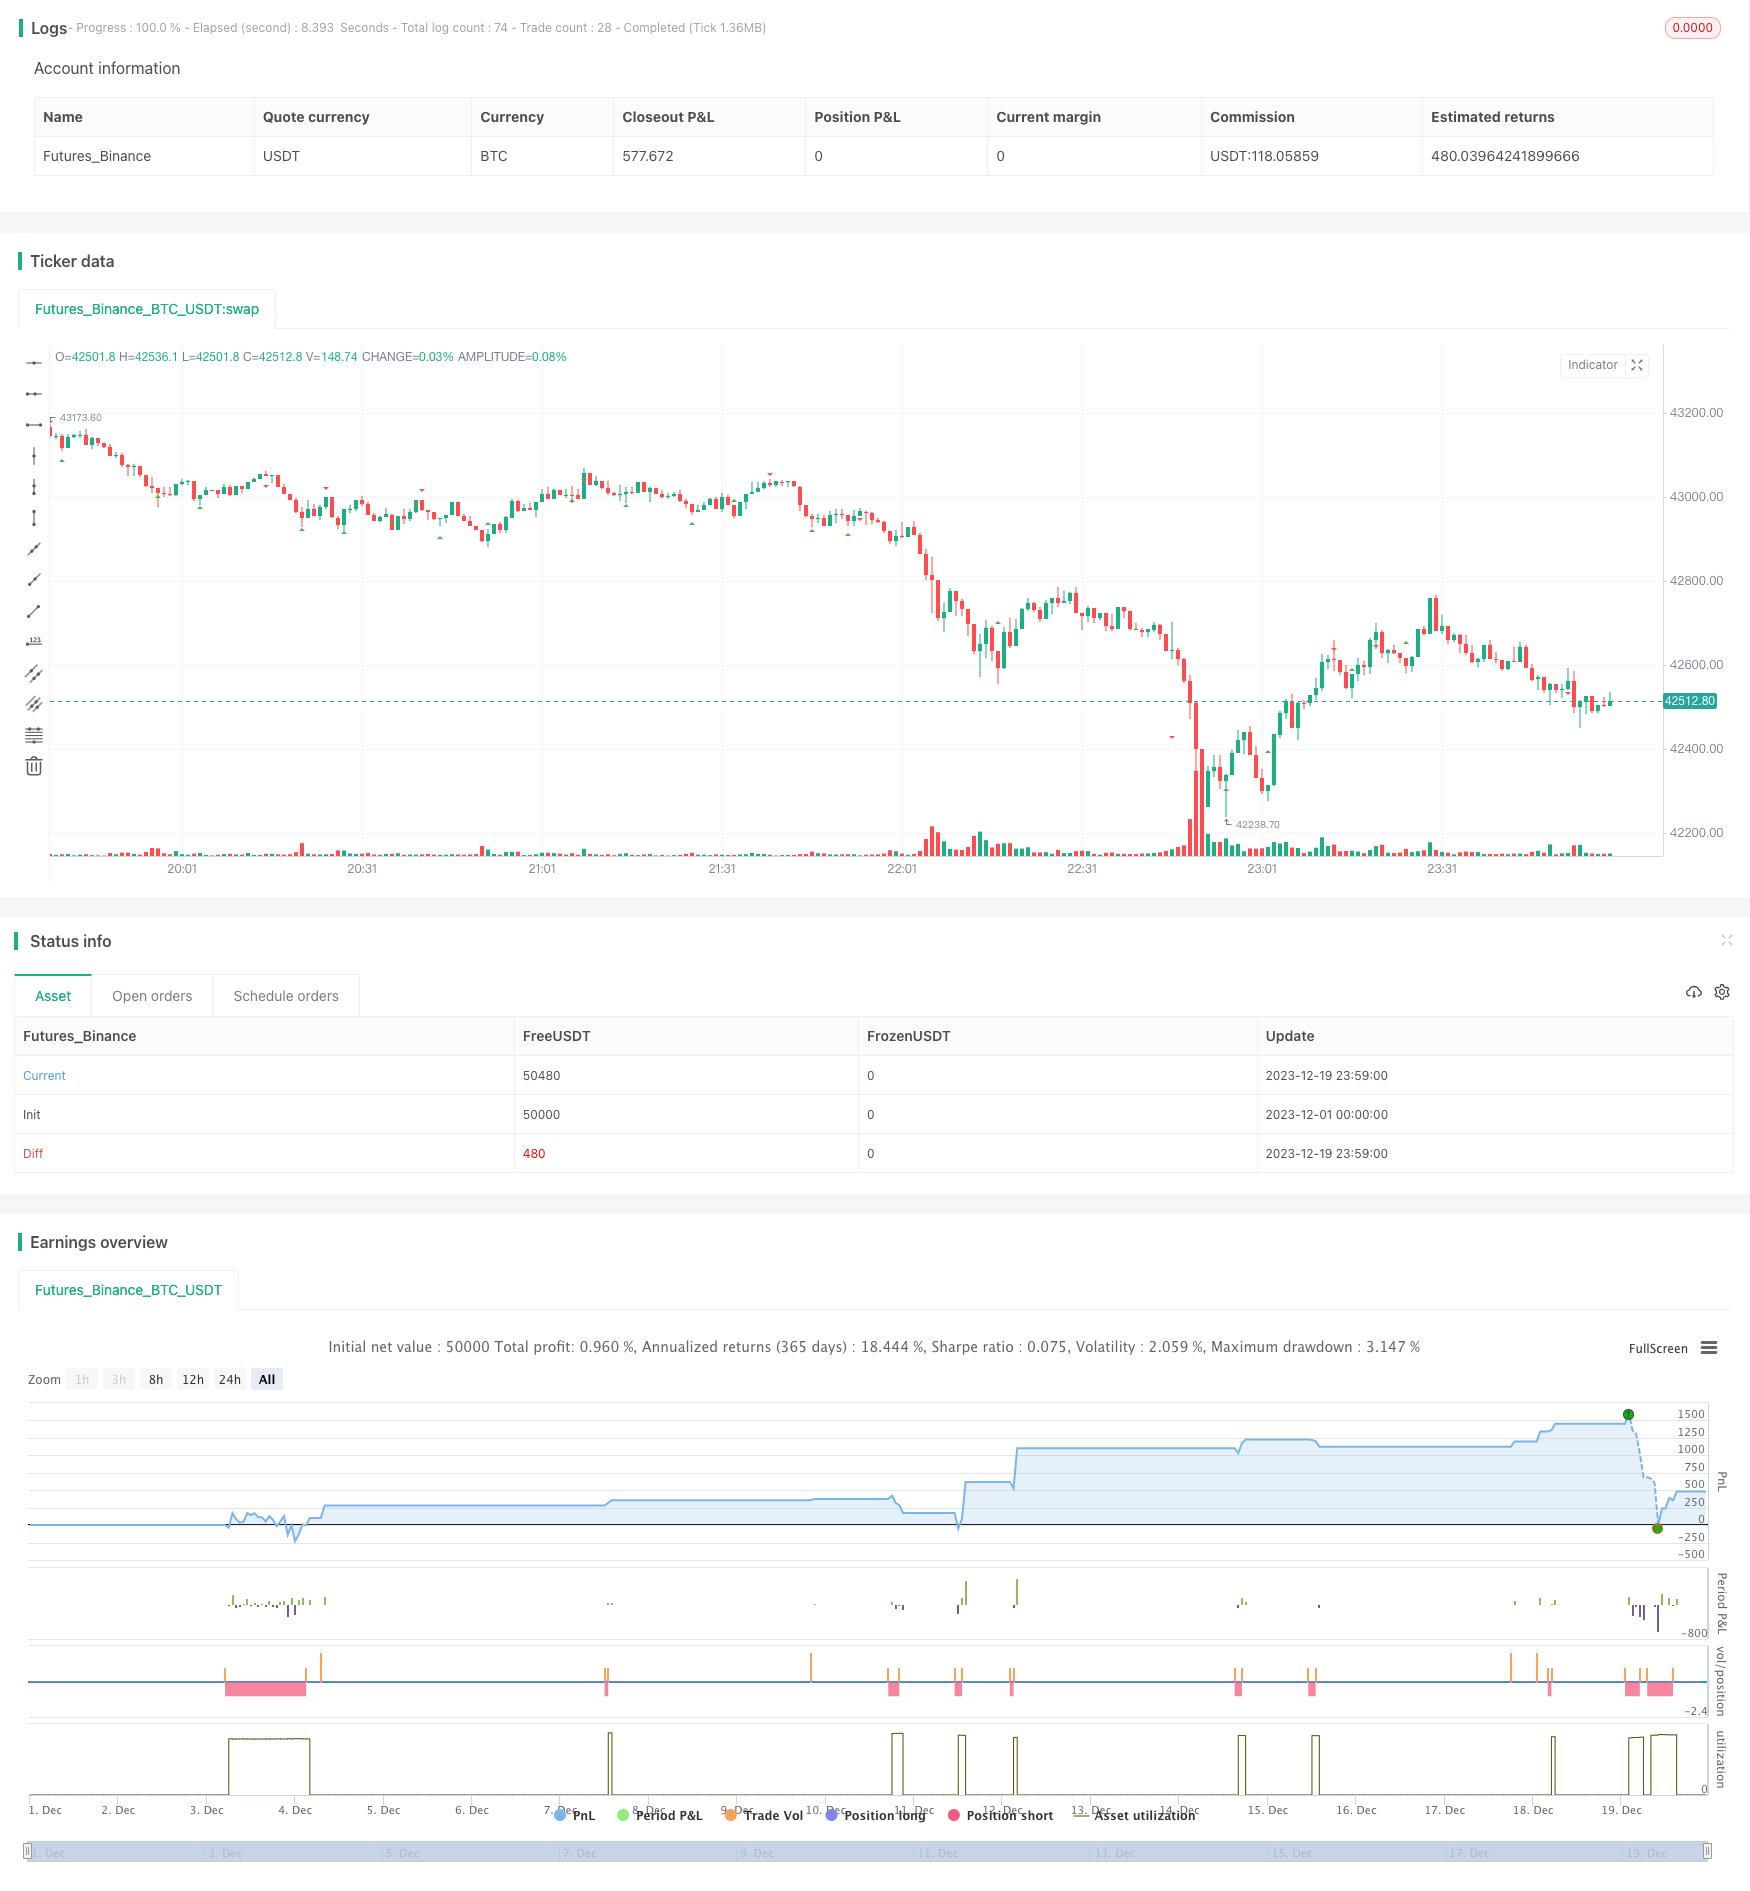
该策略基于枢轴点和斐波那契回撤比率自动识别股价的ABC波段,并给出长短仓信号。策略利用枢轴点判断股价波段,然后计算ABC波段之间的斐波那契回撤比例,如果符合一定条件就产生交易信号。
- 计算股票的枢轴高点和低点
- 判断价格是否从上一波段高点下落或从上一波段低点上涨
- 计算当前波段与上一波段之间的斐波那契回撤比例
- 如果上涨波段和下跌波段的回撤比例都在适当范围内,则判定可能形成ABC波段
- 在ABC波段确认后,做多时设置止损为C点位,止盈为1.5倍波动;做空时设置止损为A点位,止盈为1.5倍波动
- 利用枢轴点判断关键支撑阻力区域,提高信号准确率
- 应用斐波那契回撤识别ABC形态,自动捕捉趋势转换点
- 止盈止损清晰合理,避免出现巨大亏损
- 枢轴点和斐波那契回撤并不能保证每次都精确判断趋势转换点,可能出现误判
- C点和A点止损可能被突破,造成损失扩大
- 需要参数优化,比如斐波那契回撤比率的范围
- 可以结合更多技术指标辅助判断ABC形态,提高信号准确率
- 可以优化斐波那契回撤比率的范围,以适应更多市场情况
- 可以结合机器学习方法训练判断ABC形态的模型
该策略基于枢轴点判断关键支撑阻力区域,并利用斐波那契回撤比例自动识别ABC形态,在波段转折点给出长短仓交易信号。策略逻辑清晰简洁,止盈止损设置合理,能够有效控制风险。但是也存在一定误判风险,需要进一步优化和改进以适应更多市场情况。
||
This strategy automatically identifies ABC patterns in stock prices based on pivot points and Fibonacci retracement ratios, and generates long/short signals. It uses pivot points to determine price waves and calculates Fibonacci retracement ratios between ABC waves. If the ratios meet certain criteria, trading signals are generated.
- Calculate the stock's pivot high and low points
- Judge if the price has fallen from the previous high point or risen from the previous low point
- Calculate the Fibonacci retracement ratio between the current wave and previous wave
- If the retracement ratios of both up and down waves are within proper ranges, determine a potential ABC pattern
- After ABC pattern confirmation, set stop loss at Point C for long, and Point A for short. Set take profit at 1.5 times the price wave range.
- Pivot points identify key support/resistance levels to improve signal accuracy
- Fibonacci retracements catch trend turning points by identifying ABC patterns
- Clear profit/loss rules avoid huge losses
- Pivot points and Fibonacci retracements cannot ensure perfect identification of every trend turning point. Misjudgements may occur.
- Point C and Point A stops can be broken through, leading to larger losses
- Parameters like Fibonacci retracement ratio ranges need further optimization
- Incorporate more technical indicators to assist ABC pattern confirmation, improving signal accuracy
- Optimize Fibonacci retracement ratio ranges to suit more market conditions
- Utilize machine learning methods to train ABC pattern recognition models
This strategy identifies ABC patterns for generating long/short signals at trend turning points, based on pivot point confirmation of key support/resistance levels, and Fibonacci retracement ratio calculations. The logic is simple and clean, with sensible profit/loss rules that effectively control risks. However, certain misjudgement risks remain, requiring further optimizations and improvements to suit more market conditions.
[/trans]
Strategy Arguments
| Argument | Default | Description |
|---|---|---|
| v_input_1 | 5 | len |
Source (PineScript)
/*backtest
start: 2023-12-01 00:00:00
end: 2023-12-19 23:59:59
period: 1m
basePeriod: 1m
exchanges: [{"eid":"Futures_Binance","currency":"BTC_USDT"}]
*/

// This source code is subject to the terms of the Mozilla Public License 2.0 at https://mozilla.org/MPL/2.0/
// © kerok3g

//@version=5
strategy("ABCD Strategy", shorttitle="ABCDS", overlay=true, commission_value=0.04)
calcdev(fprice, lprice, fbars, lbars) =>
    rise = lprice - fprice
    run = lbars - fbars
    avg = rise/run
    ((bar_index - lbars) * avg) + lprice

len = input(5)

ph = ta.pivothigh(len, len)
pl = ta.pivotlow(len, len)

var bool ishigh = false
ishigh := ishigh[1]

var float currph = 0.0
var int currphb = 0
currph := nz(currph)
currphb := nz(currphb)

var float oldph = 0.0
var int oldphb = 0
oldph := nz(oldph)
oldphb := nz(oldphb)

var float currpl = 0.0
var int currplb = 0
currpl := nz(currpl)
currplb := nz(currplb)

var float oldpl = 0.0
var int oldplb = 0
oldpl := nz(oldpl)
oldplb := nz(oldplb)

if (not na(ph))
    ishigh := true
    oldph := currph
    oldphb := currphb
    currph := ph
    currphb := bar_index[len]
else
    if (not na(pl))
        ishigh := false
        oldpl := currpl
        oldplb := currplb
        currpl := pl
        currplb := bar_index[len]

endHighPoint = calcdev(oldph, currph, oldphb, currphb)
endLowPoint = calcdev(oldpl, currpl, oldplb, currplb)

plotshape(ph, style=shape.triangledown, color=color.red, location=location.abovebar, offset=-len)
plotshape(pl, style=shape.triangleup, color=color.green, location=location.belowbar, offset=-len)

// var line lnhigher = na
// var line lnlower = na
// lnhigher := line.new(oldphb, oldph, bar_index, endHighPoint)
// lnlower := line.new(oldplb, oldpl, bar_index, endLowPoint)
// line.delete(lnhigher[1])
// line.delete(lnlower[1])

formlong = oldphb < oldplb and oldpl < currphb and currphb < currplb
longratio1 = (currph - oldpl) / (oldph - oldpl)
longratio2 = (currph - currpl) / (currph - oldpl)

formshort = oldplb < oldphb and oldphb < currplb and currplb < currphb
shortratio1 = (oldph - currpl) / (oldph - oldpl)
shortratio2 = (currph - currpl) / (oldph - currpl)

// prevent multiple entry for one pattern
var int signalid = 0
signalid := nz(signalid[1])

longCond = formlong and
           longratio1 < 0.7 and
           longratio1 > 0.5 and
           longratio2 > 1.1 and
           longratio2 < 1.35 and
           close < oldph and
           close > currpl and
           signalid != oldplb
if (longCond)
    signalid := oldplb
    longsl = currpl - ta.tr
    longtp = ((close - longsl) * 1.5) + close
    strategy.entry("Long", strategy.long)
    strategy.exit("Exit Long", "Long", limit=math.min(longtp, oldph), stop=longsl)

shortCond = formshort and
             shortratio1 < 0.7 and
             shortratio1 > 0.5 and
             shortratio2 > 1.1 and
             shortratio2 < 1.35 and
             close > oldpl and
             close < currph and
             signalid != oldphb

if (shortCond)
    signalid := oldphb
    shortsl = currph + ta.tr
    shorttp = close - ((shortsl - close) * 1.5)
    strategy.entry("Short", strategy.short)
    strategy.exit("Exit Short", "Short", limit=math.max(shorttp, oldpl), stop=shortsl)
Detail
https://www.fmz.com/strategy/437740
Last Modified
2024-01-05 11:34:17
