Name
基于月相计算的比特币交易策略Lunar-Phase-Based-Bitcoin-Trading-Strategy
Author
ChaoZhang
Strategy Description
[trans]
本策略基于月相周期作为交易信号,结合RSI、MACD、OBV等多个指标来识别比特币等数字货币的交易机会。该策略主要优势是利用月相阶段这一外部因素作为交易启发信号,与大多数只依赖技术指标的策略不同,可以在一定程度上避免被市场操纵。
该策略的核心逻辑是根据月相周期的不同阶段来判断是否符合做多或做空的条件。月相计算公式为:
月相周期长度=29.5305882天 已知某次满月时间,可以计算从该满月开始到当前时间的天数 月相年龄=距离已知满月的天数%月相周期长度 月相值=(1 + cos(月相年龄/月相周期长度2π))/2
根据月相值的大小可以判断当前是什么月相。月相在0到1之间变化,值越大表示离满月越近,值越小表示离新月越近。
策略根据月相阈值判断是否符合做多或做空条件。如果月相值大于做多阈值(默认0.51),则有机会做多;如果月相值小于做空阈值(默认0.49),则有机会做空。
此外,策略还结合交易量、RSI、MACD等指标来避免在非理想情况下发出交易信号。只有在交易量放大、RSI和MACD符合条件时,才会打开仓位。
该策略主要有以下几个优势:
- 利用月相提供独特的交易信号,可以在一定程度上规避市场操纵
- 结合多种指标判断市场状况,避免在不利环境中交易
- 采用平均真实波幅ATR来计算合理交易量,有效控制单笔交易最大损失
- 设置回撤止损来预防大额亏损
- 应用OBV判断资金流向,避免逆势交易
- 设置移动止损来锁定盈利
总的来说,该策略充分利用月相的独特优势,并辅以多种技术指标来识别高概率交易机会,通过风险控制手段有效控制交易风险。
该策略主要存在以下风险:
- 月相与市场走势可能偶尔会失效
- 回撤止损点设置不当可能造成策略过早停止
- MACD、RSI等指标发出错误信号的概率
- 移动止损点设置不当可能使策略错过更大利润
为控制这些风险,可以采取以下措施:
- 调整月相阈值,确保月相信号有效率
- 测试多组回撤止损参数,选择最优参数
- 调整MACD和RSI的参数,确保它们能高效发出信号
- 测试多组移动止损参数,追求最大利润
通过参数优化和综合指标应用,可以在很大程度上规避交易风险。
该策略仍有进一步优化的空间:
- 可以测试不同月相参数,寻找最佳阈值;
- 可以尝试结合更多指标进行组合交易,提高策略效率;
- 可以优化止损机制参数,平衡风险和收益;
- 可以扩展更多交易品种,验证策略的泛化能力。
本策略通过月相独特的交易信号,配合主流技术指标,实现了高效的比特币交易。相比单一指标策略,本策略可以更好抵御市场操纵风险,具有独特优势。通过止损预防风险和优化参数,可以稳定获取较好收益。该策略仍可进一步提升,具有很大的应用前景。
||
This strategy uses the lunar phase cycle as trading signals, combined with RSI, MACD, OBV and other indicators to identify trading opportunities for cryptocurrencies like Bitcoin. The key advantage of this strategy is utilizing the lunar phase, an external factor, as the trading trigger, which is different from most strategies solely relying on technical indicators, thus can avoid market manipulation to some extent.
The core logic of this strategy is to determine long or short opportunities based on different stages of the lunar phase cycle. The lunar phase is calculated as:
Lunar phase cycle length = 29.5305882 days
Given a known full moon time, the number of days from that full moon to the current time can be calculated
Lunar age = Days since known full moon % Lunar phase cycle length
Lunar phase value = (1 + cos(Lunar age / Lunar phase cycle length * 2 * π)) / 2
The lunar phase value fluctuates between 0 to 1. The larger the value means closer to the full moon, while the smaller value means closer to the new moon.
The strategy judges long or short opportunities based on lunar phase thresholds. If lunar phase value is greater than the long threshold (default 0.51), there is chance to go long. If the lunar phase value is less than the short threshold (default 0.49), there is chance to go short.
In addition, the strategy also combines indicators like trading volume, RSI and MACD to avoid trading signals during unfavorable conditions. It only opens positions when volume surges, RSI and MACD signals align.
The main advantages of this strategy:
- Utilize unique lunar phase trading signal, avoid market manipulation to some extent
- Combine indicators to determine market condition, avoid trading in unfavorable environments
- Use ATR to calculate reasonable position size, effectively control maximum loss per trade
- Set drawdown stop loss to prevent huge loss
- Judge fund flow direction with OBV, avoid trading against the trend
- Set trailing stop loss to lock in profits
In summary, this strategy makes full use of the unique advantages of lunar phases, and combines multiple technical indicators to identify high probability trading chances, while leverages risk control mechanisms to effectively define trading risks.
The main risks of this strategy includes:
- Lunar phase and market moves may occasionally fail
- Improper drawdown stop loss may stop the strategy prematurely
- Probability of false signals from MACD, RSI
- Improper trailing stop loss may cause strategy to miss larger profits
To control these risks, the following measures can be taken:
- Adjust lunar phase thresholds to ensure valid lunar signals
- Test multiple drawdown stop loss parameters and select optimal
- Fine tune MACD and RSI parameters to efficiently generate signals
- Test multiple sets of trailing stop loss parameters for maximum profits
Through parameter optimization and combined indicators, trading risks can be mitigated to a large extent.
There is still room for further optimization of this strategy:
- Test different lunar parameters to find optimal thresholds
- Try combining more indicators for ensemble trading and improve efficiency
- Optimize stop loss mechanisms parameters to balance risks and returns
- Expand to more trading assets to test generalization ability
This strategy realizes efficient Bitcoin trading through unique lunar phase trading signals, combined with mainstream technical indicators. Compared to single indicator strategies, this strategy can better hedge against market manipulation risks and has unique advantages. By leveraging stop loss to prevent risks and parameter optimization, steady and good returns can be obtained stably. There is still large room for improving this strategy and it has promising application prospects.
[/trans]
Strategy Arguments
| Argument | Default | Description |
|---|---|---|
| v_input_1 | 2023 | Start year |
| v_input_2 | 2023 | End year |
| v_input_3 | 0.51 | Long Phase Threshold |
| v_input_4 | 0.49 | Short Phase Threshold |
| v_input_5 | 0.05 | Risk Per Trade (as a % of Equity) |
| v_input_6 | 0.01 | Stop Loss Percentage |
| v_input_7 | 21 | ATR Length for Volatility |
| v_input_8 | 0.1 | Trailing Stop Percentage |
| v_input_9 | 0.1 | Maximum Drawdown Percentage |
| v_input_10 | 7 | Volume MA Length |
Source (PineScript)
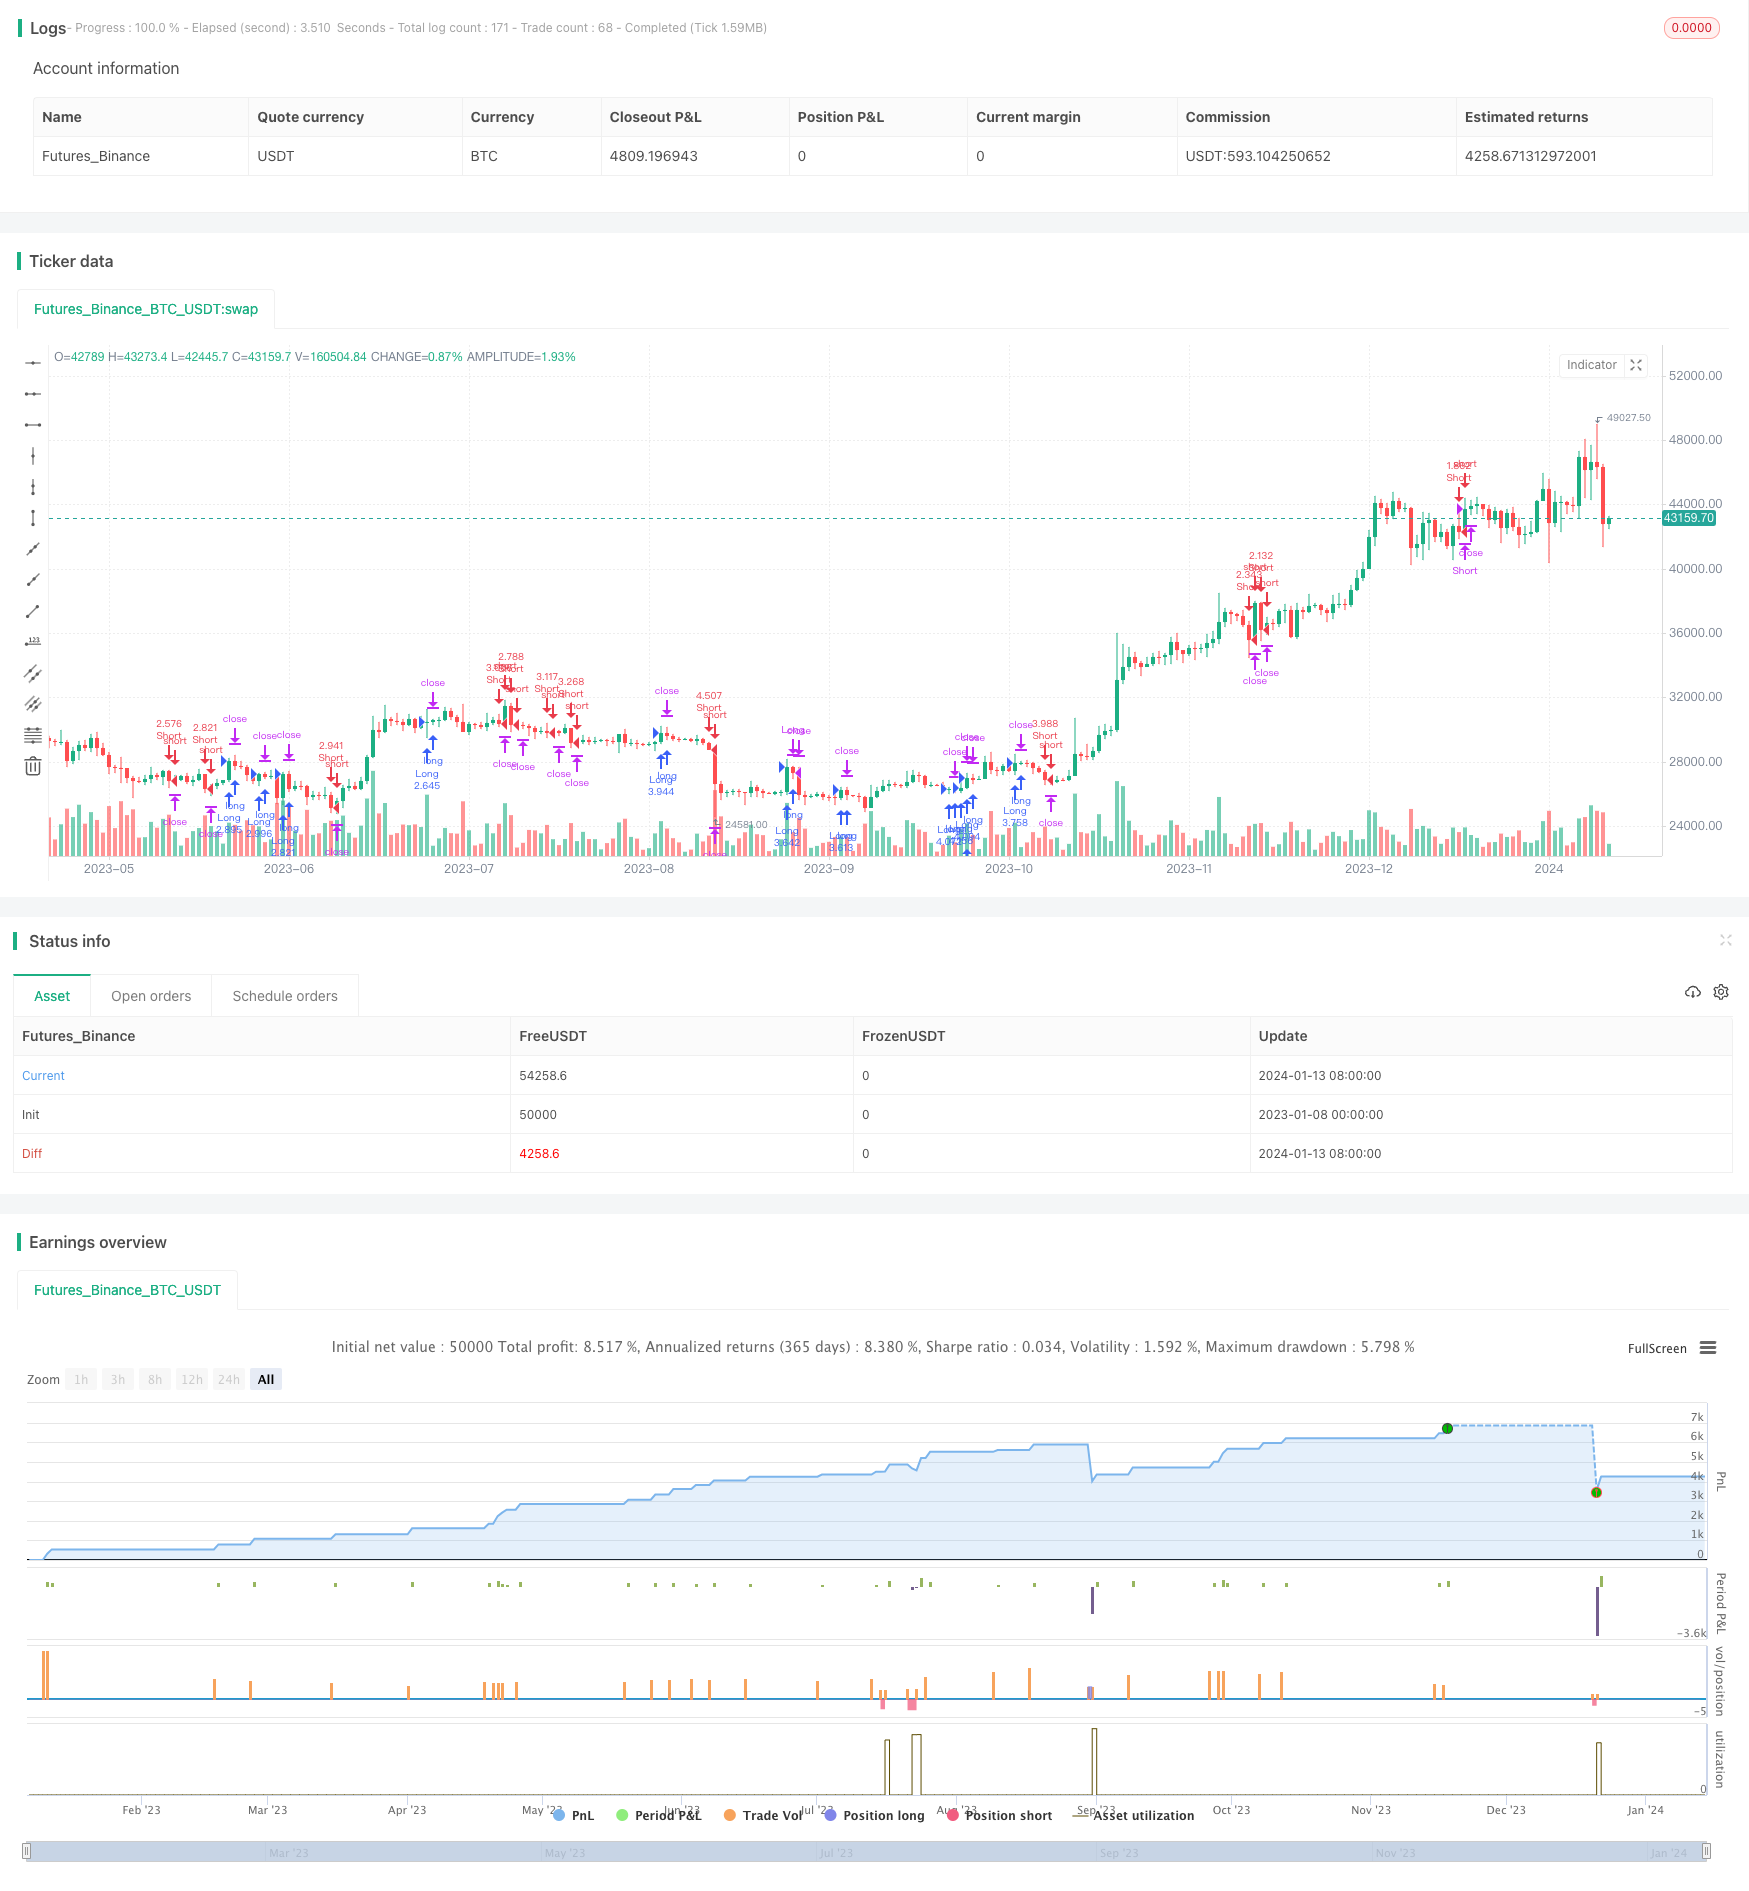
/*backtest
start: 2023-01-08 00:00:00
end: 2024-01-14 00:00:00
period: 1d
basePeriod: 1h
exchanges: [{"eid":"Futures_Binance","currency":"BTC_USDT"}]
*/

//@version=5
strategy("Lunar Phase Strategy by Symphoenix", overlay=true)

// Input parameters
start_year = input(2023, title="Start year")
end_year = input(2023, title="End year")
longPhaseThreshold = input(0.51, title="Long Phase Threshold")
shortPhaseThreshold = input(0.49, title="Short Phase Threshold")
riskPerTrade = input(0.05, title="Risk Per Trade (as a % of Equity)")
stopLossPerc = input(0.01, title="Stop Loss Percentage")
atrLength = input(21, title="ATR Length for Volatility")
trailPerc = input(0.1, title="Trailing Stop Percentage")
maxDrawdownPerc = input(0.1, title="Maximum Drawdown Percentage")
volumeLength = input(7, title="Volume MA Length")

// Constants for lunar phase calculation and ATR
atr = ta.atr(atrLength)
volMA = ta.sma(volume, volumeLength) // Volume moving average

// Improved Lunar Phase Calculation
calculateLunarPhase() =>
    moonCycleLength = 29.5305882
    daysSinceKnownFullMoon = (time - timestamp("2019-12-12T05:12:00")) / (24 * 60 * 60 * 1000)
    lunarAge = daysSinceKnownFullMoon % moonCycleLength
    phase = ((1 + math.cos(lunarAge / moonCycleLength * 2 * math.pi)) / 2)
    phase

lunarPhase = calculateLunarPhase()

// Advanced Volume Analysis
priceChange = ta.change(close)
obv = ta.cum(priceChange > 0 ? volume : priceChange < 0 ? -volume : 0)

// Additional Technical Indicators
rsi = ta.rsi(close, 14)
[macdLine, signalLine, _] = ta.macd(close, 12, 26, 9)

// Calculate Position Size based on Volatility and Account Equity
calculatePositionSize() =>
    equity = strategy.equity
    riskAmount = equity * riskPerTrade
    positionSize = riskAmount / atr
    if positionSize > 1000000000000
        positionSize := 1000000000000
    positionSize

positionSize = calculatePositionSize()

// Maximum Drawdown Tracking
var float maxPortfolioValue = na
maxPortfolioValue := math.max(maxPortfolioValue, strategy.equity)
drawdown = (maxPortfolioValue - strategy.equity) / maxPortfolioValue

// Check for maximum drawdown
if drawdown > maxDrawdownPerc
    strategy.close_all()
    strategy.cancel_all()

// Volume Analysis
isVolumeConfirmed = volume > volMA

// Date Check for Backtesting Period
isWithinBacktestPeriod = year >= start_year and year <= end_year

// Entry and Exit Conditions
// Adjusted Entry and Exit Conditions
longCondition = lunarPhase > longPhaseThreshold and lunarPhase < 0.999 and isVolumeConfirmed and obv > obv[1] and rsi < 70 and macdLine > signalLine and isWithinBacktestPeriod
shortCondition = lunarPhase < shortPhaseThreshold and lunarPhase > 0.001 and isVolumeConfirmed and obv < obv[1] and rsi > 30 and macdLine < signalLine and isWithinBacktestPeriod

if longCondition
    if strategy.position_size < 0
        strategy.close_all()
    if strategy.position_size < positionSize
        strategy.entry("Long", strategy.long, qty=positionSize)
        strategy.exit("Exit Long", "Long", trail_offset=atr * trailPerc, trail_points=atr)

if shortCondition
    if strategy.position_size > 0
        strategy.close_all()
    if strategy.position_size > -positionSize
        strategy.entry("Short", strategy.short, qty=positionSize)
        strategy.exit("Exit Short", "Short", trail_offset=atr * trailPerc, trail_points=atr)

// Implementing Stop-Loss Logic
longStopLoss = strategy.position_avg_price * (1 - stopLossPerc)
shortStopLoss = strategy.position_avg_price * (1 + stopLossPerc)

if strategy.position_size > 0 and close < longStopLoss
    strategy.close("Long")

if strategy.position_size < 0 and close > shortStopLoss
    strategy.close("Short")
Detail
https://www.fmz.com/strategy/438784
Last Modified
2024-01-15 12:31:06