Name
基于斐波那契平均K线和移动平均线的量化交易策略Fibonacci-Average-Candle-with-Moving-Average-Strategy-for-Quantitative-Trading
Author
ChaoZhang
Strategy Description
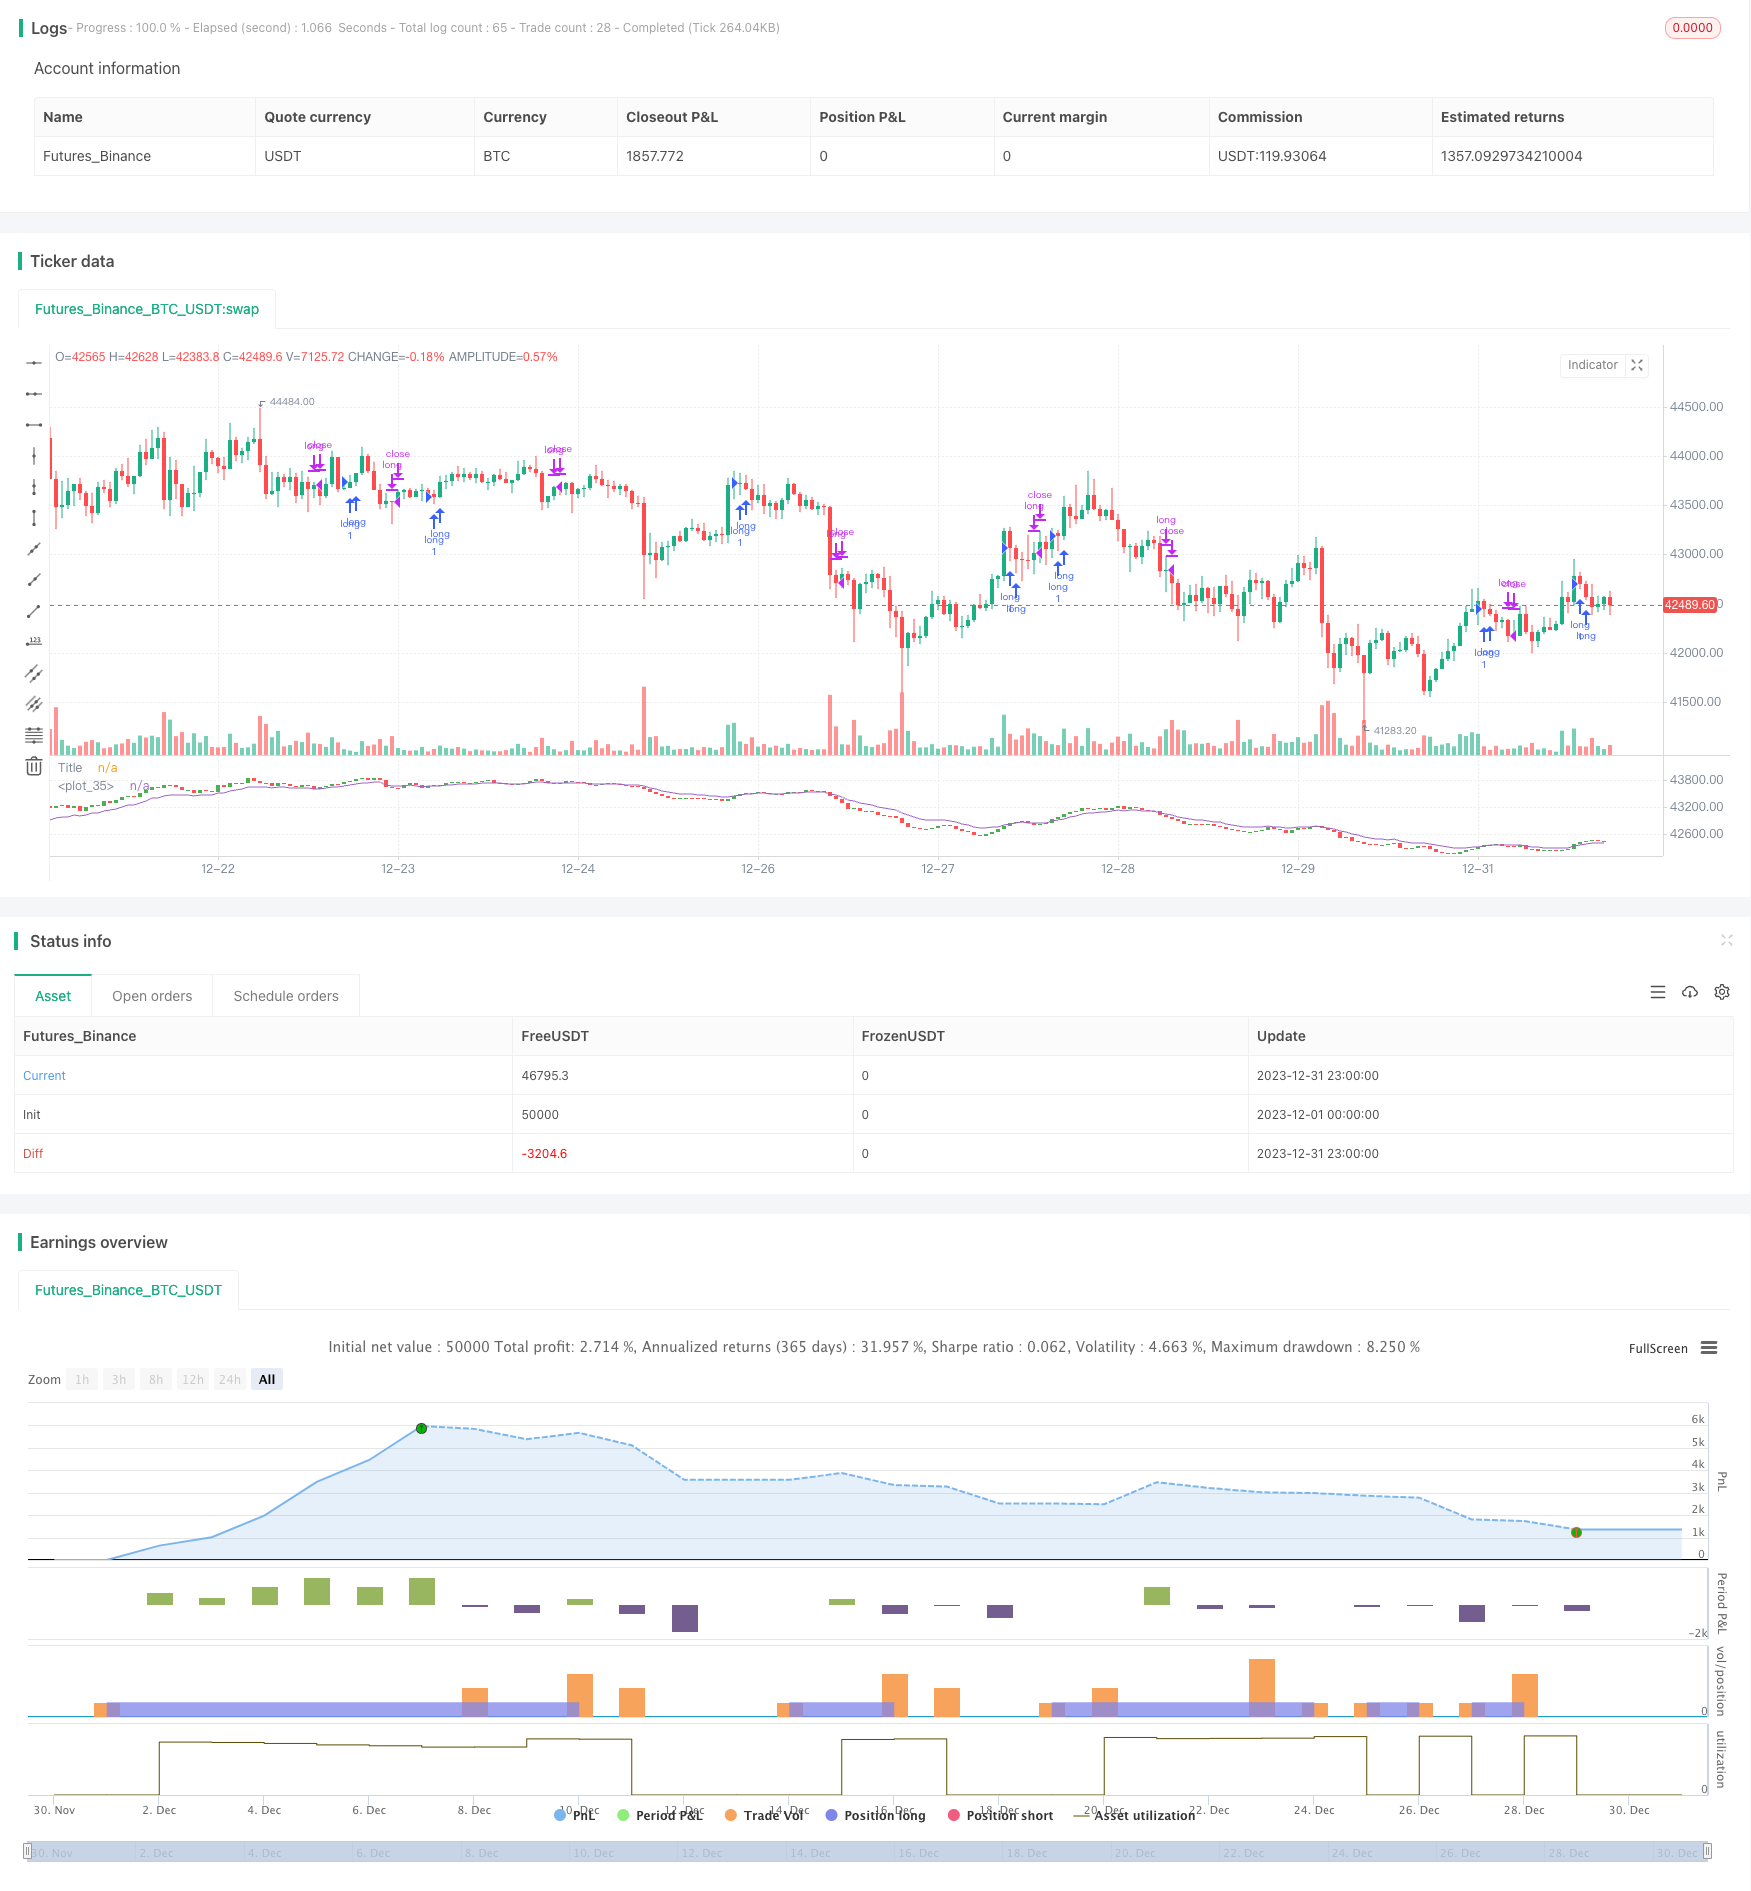
本策略通过构建基于斐波那契数列计算的平均K线和移动平均线,结合多种价格技术指标规则,实现仅做多不做空的量化交易。初步测试表明,该策略在大周期图形上表现较好。
本策略主要通过以下步骤实现:
-
根据斐波那契数列,计算最近10个斐波那契周期的平均收盘价、最高价、最低价和开盘价,构建平均K线。
-
对平均收盘价计算1、2、3、5、8、13、21、34和55周期的指数移动平均线(EMA),并计算这9个EMA的平均值,得到平均EMA。
-
设置做多和平仓条件:当平均K线形态显示多头信号(收阳、阳包阳等)且收盘价高于平均EMA时开仓做多;当平均K线形态显示空头信号(收阴、阴包阴等)且收盘价低于平均EMA时平仓。
通过计算平均K线滤波价格波动,再结合均线指标发出交易信号,可以有效识别趋势,控制交易风险。
-
基于斐波那契数列计算平均K线,可以有效滤波随机价格波动,识别趋势信号。
-
多个EMA均值构建平均EMA,可以增强支持阻力位的稳定性,提高信号质量。
-
仅做多不做空可以减少交易次数,降低交易成本和滑点影响。
-
在大周期运行表现较好,适合中长线操作。
-
仅做多的策略在空头市场中可能遭受较大亏损。
-
EMA均线容易产生滞后,可能错过最佳入场时点。
-
过于追求大周期操作,可能错过中短线机会。
-
参数优化空间有限,实盘表现可能弱于参数优化的回测结果。
-
可以测试添加适当的止损策略,在亏损扩大时止损出场。
-
可以结合波动率指标如ATR,动态调整仓位规模。
-
可以测试在下跌趋势中适当介入做空,增加策略收益。
-
可以优化EMA的周期参数,找到最佳参数组合。
本策略通过构建斐波那契平均K线和均线指标,识别趋势信号实现量化交易。策略具有计算平均K线滤波价格优势,以及仅做多操作减少交易成本优势。同时也存在只做多的市场风险,以及EMA滞后的问题。总体来说,本策略从多个维度控制了交易风险,在大周期中表现较好,适合中长线操作。通过继续优化可以提升策略稳定性和收益水平。
||
This strategy constructs average candles and moving averages based on the Fibonacci sequence to implement quantitative trading with only long positions and no short positions. Initial tests show that this strategy performs better on larger timeframes.
The main steps of this strategy are:
-
Calculate the average close, high, low and open prices of the most recent 10 Fibonacci cycles to construct an average candle.
-
Compute 1-, 2-, 3-, 5-, 8-, 13-, 21-, 34- and 55-period exponential moving averages (EMA) of the average close price, and take their average to obtain the average EMA.
-
Set long and close conditions: open long position when the average candle shows bullish patterns (like closing above open, bullish engulfing) and close is above average EMA; close long position when average candle shows bearish patterns (like closing below open, bearish engulfing) and close is below average EMA.
By calculating average candles to filter price fluctuations and combining with moving average indicators to generate trading signals, this strategy can effectively identify trends and control trading risks.
-
Average candles based on Fibonacci sequence can filter random price noise effectively and identify trend signals.
-
Average of multiple EMAs enhances stability of support/resistance levels and improves signal quality.
-
Only long positions reduces number of trades, lowers trading costs and slippage impacts.
-
Performs well on larger timeframes, suitable for medium-to-long term trading.
-
Only-long strategy can incur significant losses in bearish markets.
-
EMA lines are prone to lagging, potentially missing best entry points.
-
Overly pursuing large timeframes may miss opportunities in shorter timeframes.
-
Limited parameter optimization space means real trading performance may underperform backtest results.
-
Can test adding appropriate stop loss to exit positions when losses mount.
-
Can combine volatility measures like ATR to dynamically adjust position sizing.
-
Can test taking short positions appropriately during downtrends to increase profits.
-
Can optimize EMA period parameters to find best combinations.
This strategy identifies trend signals for quantitative trading by constructing Fibonacci average candles and moving average indicators. It takes advantage of filtering price noise with average candles and reducing trading costs by only going long. It also has the risks of bearish markets for only-long positions and EMA lagging issues. Overall, this strategy controls trading risks from multiple aspects and performs well on larger timeframes, suitable for medium-to-long term trading. Further optimizations can improve robustness and profitability.
[/trans]
Source (PineScript)
/*backtest
start: 2023-12-01 00:00:00
end: 2023-12-31 23:59:59
period: 1h
basePeriod: 15m
exchanges: [{"eid":"Futures_Binance","currency":"BTC_USDT"}]
*/

// This source code is subject to the terms of the Mozilla Public License 2.0 at https://mozilla.org/MPL/2.0/
// © SoftKill21

//@version=4
strategy("Fibonacci candle", overlay=false  )


//plot of our fibonacci candle
// Fibonacci
// Fn = Fn-1 + Fn-2
// F10 = 55
// 0 1 2 3 5 8 13 21 34 55

avg_close = (close[0] + close[1] + close[2] + close[3] +close[5] + close[8] + close[13]+ close[21] + close[34] + close[55]) / 10
avg_high = (high[0] + high[1] + high[2] + high[3] +high[5] + high[8] + high[13]+ high[21] + high[34] + high[55]) / 10
avg_low = (low[0] + low[1] + low[2] + low[3] +low[5] + low[8] + low[13]+ low[21] + low[34] + low[55]) / 10
avg_open = (open[0] + open[1] + open[2] + open[3] +open[5] + open[8] + open[13]+ open[21] + open[34] + open[55]) / 10


src = avg_close//input(avg_close, title="Source")


out55 = ema(src, 55)
out1 = ema(src, 1)
out2 = ema(src, 2)
out3 = ema(src, 3)
out5 = ema(src, 5)
out8 = ema(src, 8)
out13 = ema(src, 13)
out21 = ema(src, 21)
out34 = ema(src, 34)

avg_ema = (out55 + out1 + out2 + out3+ out5 + out8 + out13 + out21 + out34)/9

plot(avg_ema)

plotcandle(avg_open, avg_high, avg_low, avg_close, title='Title', color = avg_open < avg_close ? color.green : color.red, wickcolor=color.white)

long = avg_open < avg_close and avg_close > avg_close[1] and avg_high > avg_high[1] and  avg_close[1] > avg_close[2] and avg_high[1] > avg_high[2]
short = avg_open > avg_close and avg_close < avg_close[1] and avg_low < avg_low[1] and avg_close[1] < avg_close[2] and avg_low[1] < avg_low[2]

strategy.entry("long",1,when=long and avg_close > avg_ema)
strategy.close('long',when=short and avg_close < avg_ema)
Detail
https://www.fmz.com/strategy/439350
Last Modified
2024-01-19 14:36:45
