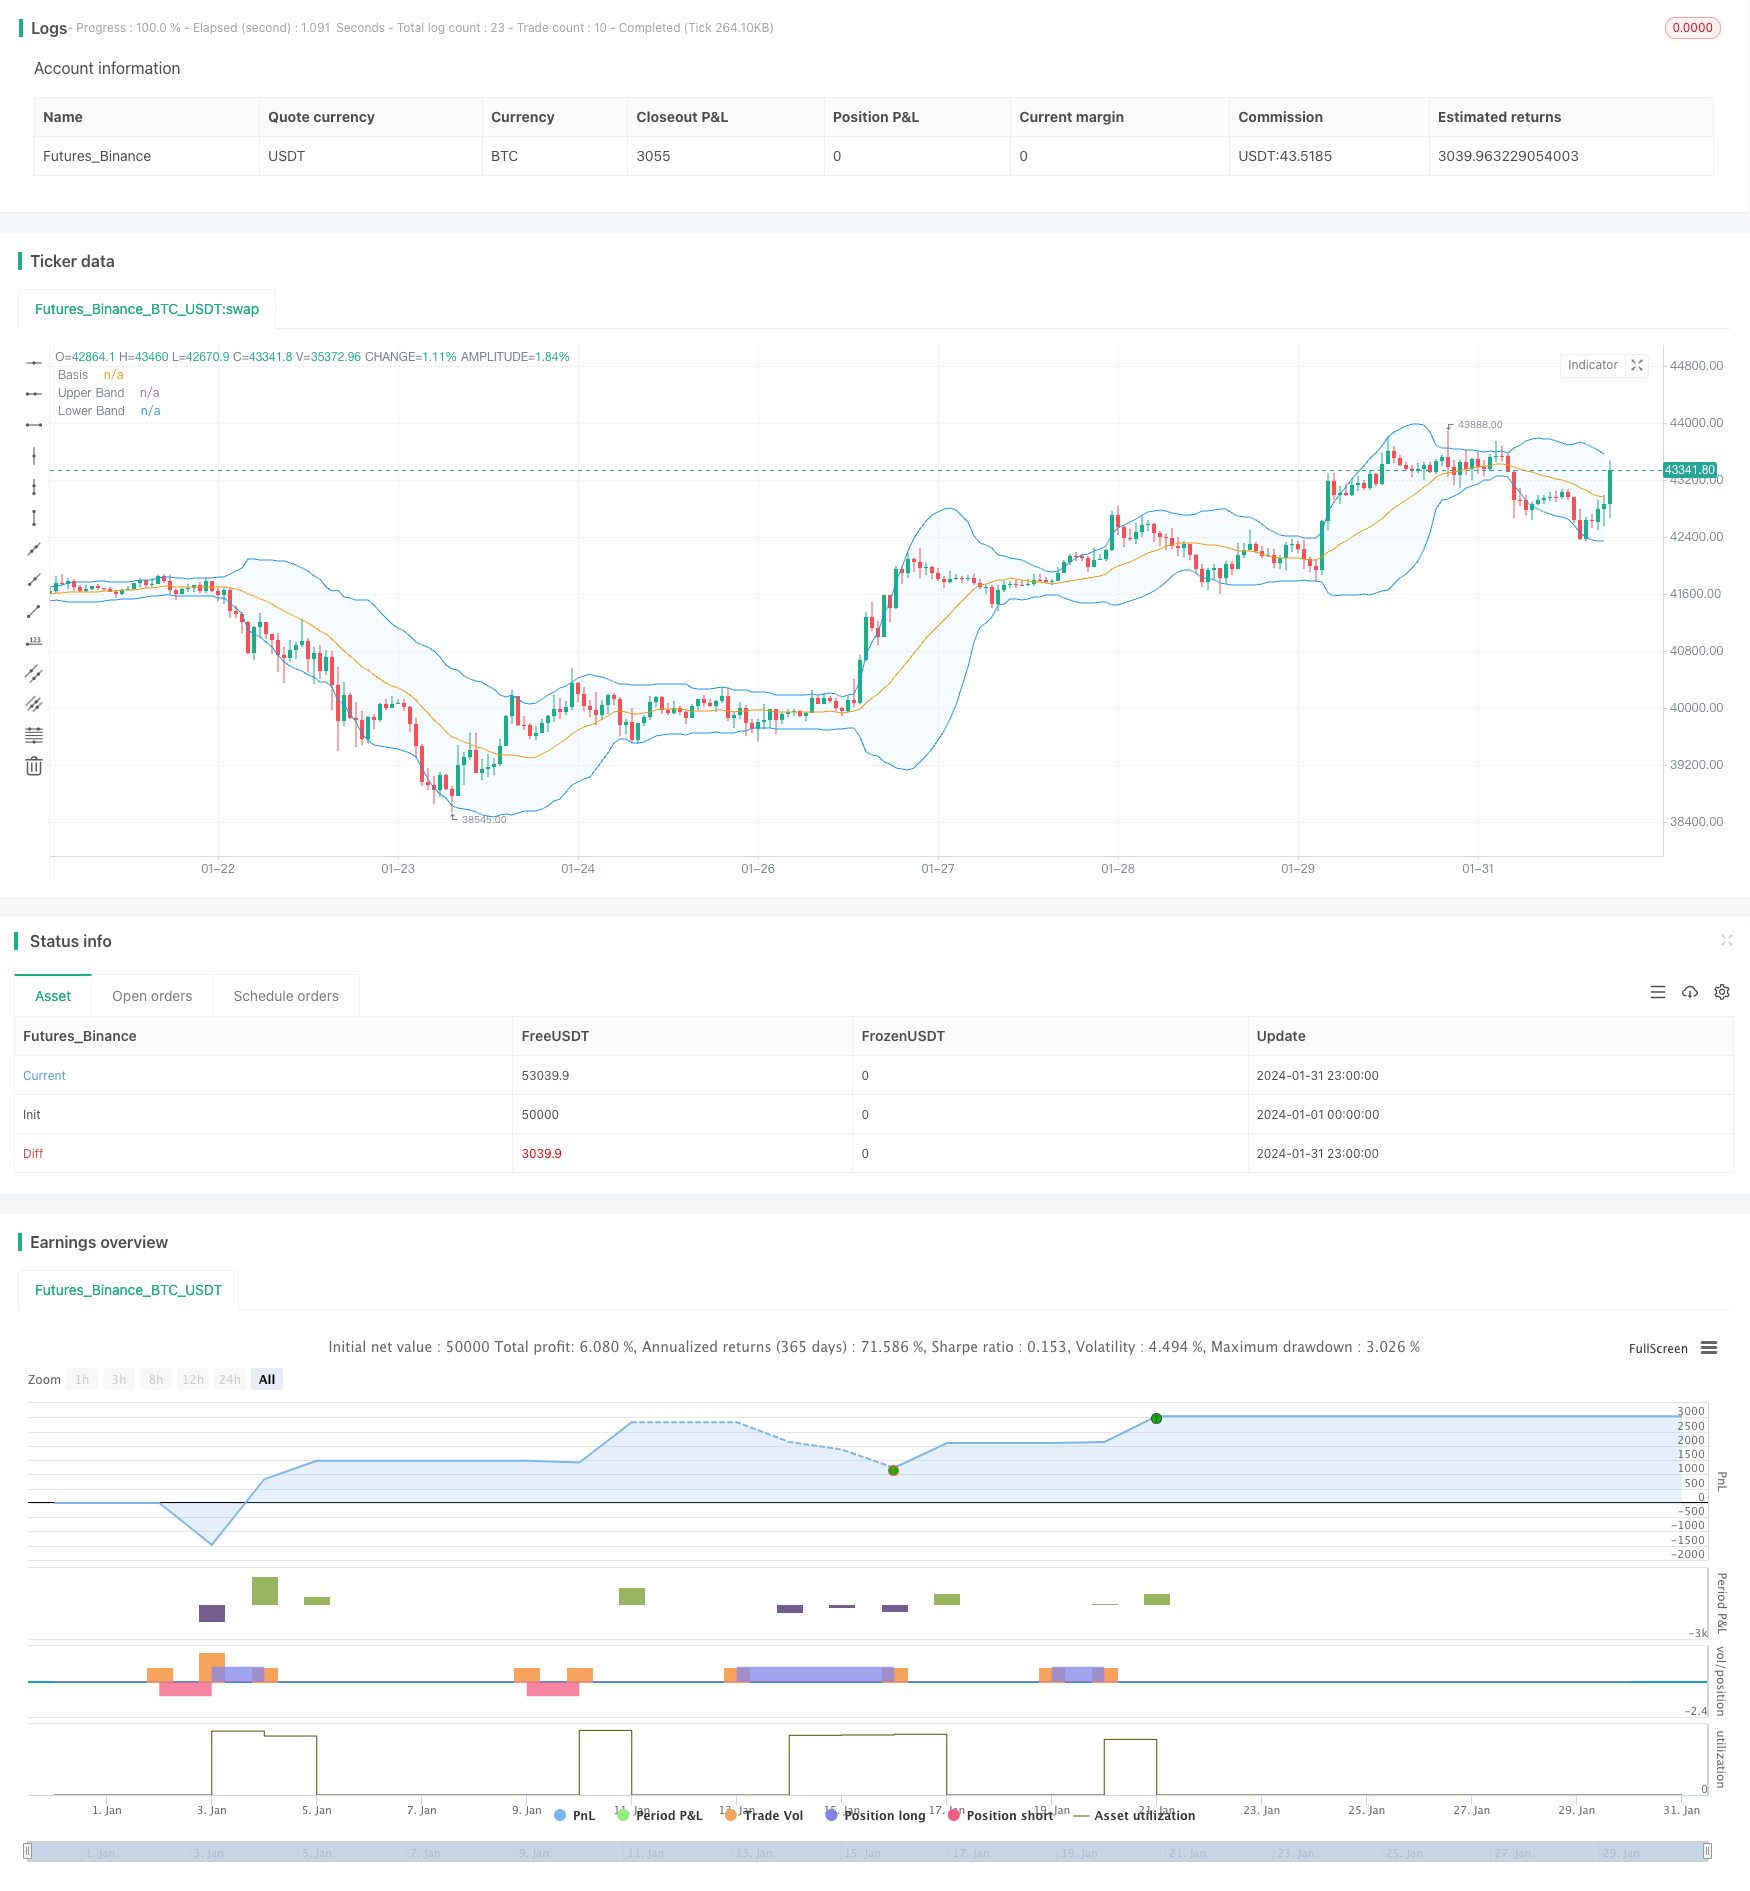
Name
基于布林带突破和RSI指标的多时间框架趋势策略Multi-timeframe-Bollinger-Bands-Breakout-Strategy-Incorporating-RSI
Author
ChaoZhang
Strategy Description
本策略融合了布林带指标、RSI指标以及多时间框架分析,旨在捕捉中长线趋势的方向。通过布林带上轨和下轨突破结合RSI过买过卖信号判断趋势反转点,实现低风险进场。同时应用更高时间框架过滤震荡行情,避免被套。
-
应用布林带指标判断价格突破。布林带中轨为N日收盘价的移动平均线,上轨和下轨分别是中轨上下各自一个标准差。当收盘价突破上轨时为强势信号,突破下轨时为弱势信号。
-
结合RSI指标判断超买超卖现象。RSI大于70为超买区,小于30为超卖区。当RSI从下向上突破70时,认为处于超买状态,布林带上轨突破作为趋势反转的确认。 当RSI从上向下突破30时,认为处于超卖状态,布林带下轨突破作为趋势反转的确认。
-
应用更高时间框架过滤假突破。当日线出现突破信号时,需要4小时或更高时间框架作为确认,避免被套。
-
多指标融合,提高策略的稳定性和盈利率。
-
RSI指标判断反转点,可以减少假突破带来的损失。
-
多时间框架分析,有效过滤震荡走势,避免被套。
-
突破信号判断优化(3根K线都要突破布林带上下轨),确保趋势发展成熟后再入场。
-
Vortex指标判断趋势方向,能够捕捉开始形成的新趋势。
-
布林带参数设置不当可能导致超买超卖信号错误。
-
RSI参数设置需要根据不同品种确定合理数值。
-
突破信号可能出现假突破,应适当放大止损点差。
-
保证充足的止损幅度,如ATR指标的3倍。
-
应用机器学习算法实时优化布林带和RSI的参数。
-
利用波动率指标优化止损点差。
-
增加交易量控制模块,根据市场变化调整仓位。
-
结合资金管理原则,限制单笔交易亏损比例。
-
评估不同交易时段突破信号的稳定性。
本策略综合考虑了趋势判断、超买超卖现象、多时间框架分析等多种技术指标,在控制风险的前提下,选择合适的进场时机,捕捉中长线质量趋势,能够获得较好的盈亏比。同时也有进一步优化的空间,通过参数调优、止损机制完善等手段,可望获得更出色的投资业绩。
||
This strategy incorporates Bollinger Bands, RSI indicator and multi-timeframe analysis to capture the direction of mid-to-long term trends. It identifies trend reversal points through Bollinger Bands breakouts combined with RSI overbought/oversold signals for low-risk entry. Meanwhile, higher timeframes are applied to filter out ranging markets and avoid being trapped.
-
Apply Bollinger Bands to determine price breakouts. The middle band is the Moving Average of closing price over N days. The upper and lower bands are placed at a distance of one standard deviation on either side of the middle band. Breaking above upper band signals bullishness while breaking below lower band signals bearishness.
-
Incorporate the RSI indicator to identify overbought/oversold levels. RSI above 70 suggests overbought conditions while below 30 suggests oversold conditions. An RSI upside breakout above 70 confirms the weakening of upside momentum. An RSI downside breakout below 30 confirms the weakening of downside momentum.
-
Utilize higher timeframes to filter false breakouts. When a breakout signal emerges on the daily timeframe, it requires additional confirmation from the 4-hour or higher timeframes to avoid being trapped.
-
Multi-indicator integration enhances strategy stability and profitability.
-
RSI inclusion mitigates losses from false breakouts.
-
Multi-timeframe analysis effectively filters out ranging markets and prevents being trapped.
-
Optimized breakout signal determination (breakouts over 3 consecutive bars) ensures sufficient trend maturity before entries.
-
Vortex Indicator determines nascent trend directionality early on.
-
Inadequate Bollinger Bands parameterization leads to erroneous overbought/oversold signals.
-
Reasonable RSI parameter values must be determined separately for different products.
-
Breakout signals may turn out to be false breakouts. Consider widening stop loss accordingly.
-
Maintain sufficient stop loss margin, e.g. 3 times ATR.
-
Apply machine learning algorithms to auto-tune parameters for Bollinger Bands and RSI.
-
Optimize stop loss levels based on volatility metrics.
-
Incorporate position sizing module to calibrate exposures based on changing market conditions.
-
Constrain maximum loss per trade based on money management principles.
-
Evaluate signal stability across different trading sessions.
This strategy comprehensively examines trend determination, overbought/oversold conditions and multiple timeframes to control risks while seeking optimal entry timing to capture high-quality mid-to-long term trends for attractive risk-reward profiles. Further enhancements may be explored through parameter optimization, stop loss mechanisms etc. to achieve even better investment performance.
[/trans]
Strategy Arguments
| Argument | Default | Description |
|---|---|---|
| v_input_1 | 20 | Length |
| v_input_2 | 2 | Multiplier |
| v_input_int_1 | 14 | Period |
| v_input_3 | 14 | RSI Length |
| v_input_4 | 70 | Overbought Level |
| v_input_5 | 30 | Oversold Level |
Source (PineScript)
/*backtest
start: 2024-01-01 00:00:00
end: 2024-01-31 23:59:59
period: 1h
basePeriod: 15m
exchanges: [{"eid":"Futures_Binance","currency":"BTC_USDT"}]
*/

// This Pine Script™ code is subject to the terms of the Mozilla Public License 2.0 at https://mozilla.org/MPL/2.0/
// © Noway0utstorm
//@version=5
strategy(title='Vortex0.71.3 + bb 3bar breakout + rsi - close hit upper or lower', shorttitle='truongphuthinh', format=format.price, precision=4,overlay = true)

length = input(20, title="Length")
mult = input(2.0, title="Multiplier")
source = close

basis = ta.sma(source, length)
dev = mult * ta.stdev(source, length)

upperBand = basis + dev
lowerBand = basis - dev

isClosedBar = ta.change(time("15"))

var bool closeAboveUpperBand = false
var bool closeBelowLowerBand = false


// Vortex Indicator Settings
period_ = input.int(14, title='Period', minval=2)

VMP = math.sum(math.abs(high - low[1]), period_)
VMM = math.sum(math.abs(low - high[1]), period_)
STR = math.sum(ta.atr(1), period_)
VIP = VMP / STR
VIM = VMM / STR

//
lengthrsi = input(14, title="RSI Length")
overboughtLevel = input(70, title="Overbought Level")
oversoldLevel = input(30, title="Oversold Level")

sourcersi = close
rsiValue = ta.rsi(sourcersi, lengthrsi)

shouldShort = rsiValue > overboughtLevel
shouldLong = rsiValue < oversoldLevel


if bool(isClosedBar[1]) and bool(isClosedBar[2]) and bool(isClosedBar[3])

    if close[1] > upperBand[1] and close[2] > upperBand[2] and close[3] > upperBand[3] and VIP > 1.25 and VIM < 0.7 and rsiValue > overboughtLevel
        strategy.entry("Short", strategy.short)
        closeAboveUpperBand := false  // Reset the condition when entering a new Short position
    if close[1] < lowerBand[1] and close[2] < lowerBand[2] and close[3] < lowerBand[3] and VIP < 0.7 and VIM > 1.25 and rsiValue < oversoldLevel
        strategy.entry("Long", strategy.long)
        closeBelowLowerBand := false  // Reset the condition when entering a new Long position


if strategy.position_size > 0  // Check if there is an open Long position
    closeAboveUpperBand := close > upperBand  // Update the condition based on close price
    if closeAboveUpperBand
        strategy.close("Long",disable_alert=true)  // Close the Long position if close price is above upper band

if strategy.position_size < 0  // Check if there is an open Short position
    closeBelowLowerBand := close < lowerBand  // Update the condition based on close price
    if closeBelowLowerBand
        strategy.close("Short",disable_alert=true)  // Close the Short position if close price is below lower band

// Plots
plot(basis, color=color.orange, title="Basis")
p1 = plot(upperBand, color=color.blue, title="Upper Band")
p2 = plot(lowerBand, color=color.blue, title="Lower Band")
fill(p1, p2, title = "Background", color=color.rgb(33, 150, 243, 95))
Detail
https://www.fmz.com/strategy/442361
Last Modified
2024-02-21 13:59:31
